
Executive Summary
The sudden gain in spot rates seen by carriers in the final week of 2022 was completely wiped out after the first week of February 2023 before remaining relatively flat through the rest of the month. Rates are anticipated to continue seeing moderate MoM decreases into Q2 with pockets of capacity constraints as construction ramps up and carriers shift to get in position for produce volume expected in April. The current spread between contract and spot rates sits around $0.64, which remains elevated against the normal spread of $0.35 – $0.45, indicating there is still room for contract rates to drop further before the market finds a floor. Capacity remains abundant as carriers continue to protect previously awarded volumes and customer routing guides to avoid further losing market share. Total container imports fell 9.9% MoM in February, ending the month nearly identical to 2019 levels. The near-term market outlook remains deflationary through the rest of Q1 and into Q2 of 2023, pending any significant economic or weather events.
Main Takeaways
- The current supply side of the market is oversaturated with capacity, forcing rates to continue to decline.
- Despite already decreasing levels, Q1 is historically the weakest point of the year for demand, with 2023 not breaking from that trend.
- The typical market cycle generally lasts 10-12 quarters (2-3 years) as we enter the final month of the 10th quarter for the current cycle, indicating the industry is nearing a trough.
- We continue to point towards the start of a rebound occurring in Q2 of 2023 with a return to typical seasonality in the back half of the year, pending any seismic events.
Economy
United States ISM Manufacturing PMI
Key Points
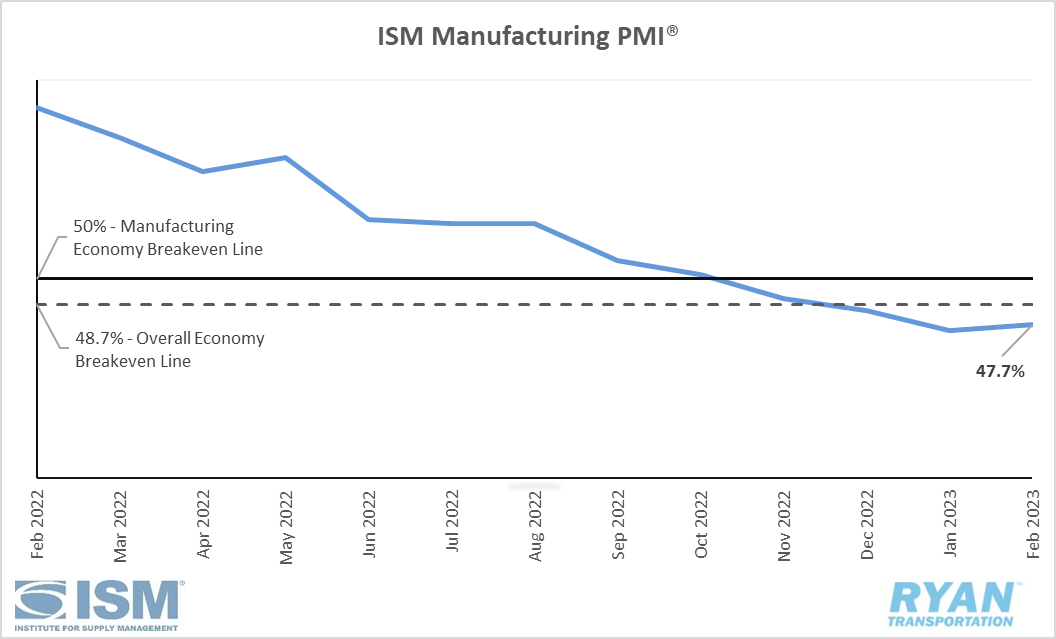
- The ISM Manufacturing PMI® contracted for the fourth consecutive month in February, registering 47.7%, a 0.3 percentage point increase from January’s reading of 47.4%. In the last two months, the Manufacturing PMI® has recorded its lowest readings since May of 2020 when it registered 43.5%.
- Of the five subindexes that directly factor into the Manufacturing PMI® (New Orders, Production, Employment, Supplier Deliveries and Inventories), all but Inventories registered in contraction territory in February, with the Inventories index falling 0.1 percentage points from January’s 50.2% reading to 50.1%.
- The New Orders Index saw slight improvement, registering 47.0%, a 4.5% increase from January’s reading of 42.5%, however it remains in contraction territory for the sixth consecutive month.
- The Employment Index registered 49.1% in February, 1.5% lower than January and slipping into contraction after spending two months in growth territory.
- Prices returned to "increasing" territory in February after jumping up 6.8% from January and registering 51.3%.
Summary
Despite marginal improvement from the previous month, the Manufacturing PMI® remained in contraction for the fourth consecutive month. According to the ISM, survey panelists have reported softening New Order rates for the last nine months, which is reflected in the February composite index as companies slow outputs to better match demand in the first half of 2023 and prepare for growth in the second half of the year. The Customer Inventories Index signals levels remain low which is a positive sign for future production while the Backlog of Orders Index showed signs of recovering for the third straight month. Despite employment and production registering in contraction in February, companies continue to remain positive about the latter half of 2023 with no indication of substantially reducing head count. The increase in the Prices Index also supports positive momentum for the second half, as it signals agreements between buyers and sellers to place orders in the near term according to the ISM.
Why it Matters: The near-term outlook for economic activity within the manufacturing sector will likely continue to remain soft through at least Q2 of 2023 with positive signals for expansion in Q3 and Q4 of 2023, barring any significant global events. New orders remain slow due to price level disagreements between buyers and suppliers as well as economic uncertainty. However, with Customer Inventories approaching "too low" levels, production should start to rebound leading into the second half of 2023.
Macro Impacts
- The February Jobs Report released by the Bureau of Labor Statistics (BLS) indicated that growth in the labor market, which has been the bedrock figure over the last several months for those arguing the economy is still strong, is showing signs of moderating.
- According to the BLS, total nonfarm payroll increased by 311k in February, much stronger than the 224k increase expected but far less than the recently revised January reading of 504k.
- The unemployment rate ticked up by 0.2% from January, registering 3.6% in February.
- Total transportation and warehousing employment fell by 22k, with truck transportation employment falling 9k.
- The Consumer Price Index (CPI) is expected to raise by 0.54% MoM in February, according to the Federal Reserve Bank of Cleveland’s “Nowcasting” data.
- According to the Cleveland FED data, CPI is expected to increase 6.2% on a 12-month basis, with Core CPI rising 5.5% in the same timeframe.
- The Consumer Price Index report is expected to be released on March 13 and will be crucial for determining the next interest rate increase when the Fed meets on March 22.
- The Fed is currently expected to continue increasing rates by 25 basis points, according to the CME FedWatch Tool, however a higher than expected CPI reading could push rate hikes back up to 50 bps as seen at the end of last year.
Industry Overview
February Key Figures (YoY)
| Truck Data Points | YoY% Change |
| DAT Spot Rates (incl. FSC) | -24.9 |
| Fuel Prices | +9.4 |
| ACT Class 8 Preliminary Orders | -13.3 |
| ATA NSTA Truck Tonnage | +3.4 |
| Cass Freight Index | -6.0 |
| Cass Freight Expenditures | -9.7 |
| Cass Freight Shipments | -0.3 |
Spot Rates
Key Points
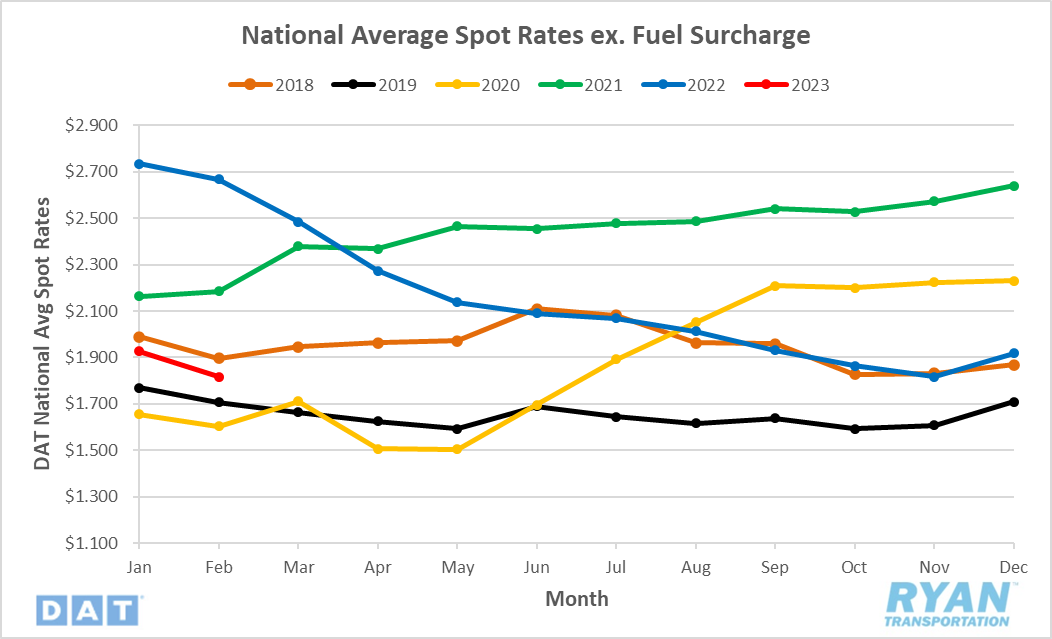
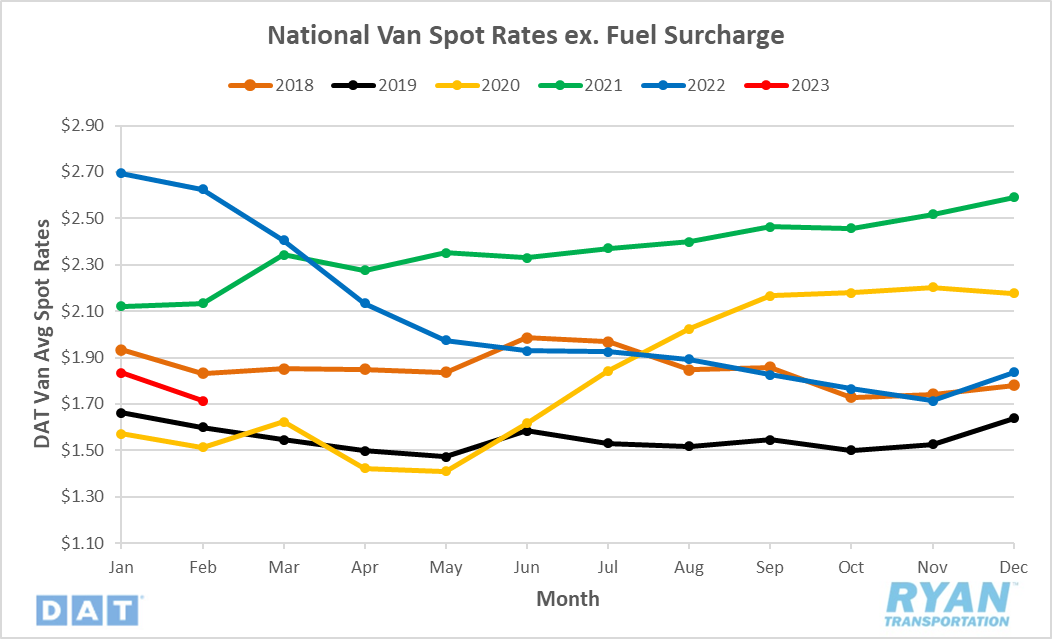
- National spot rates excl. fuel surcharge fell 5.7% MoM in February, ending the month 31.9% down from previous year levels.
- Spot rates remain below the 5-year average for the fifth consecutive month, registering 9.8% below in February.
Summary
Rates continued to cool in February following typical seasonal trends for this time of year, as demand is historically at its softest in the first quarter. Overall spot rates excl. fuel have fallen just over 11.6%, or $0.25 per mile, from where they started this year with the dry van and refrigerated markets being impacted the most by the cooling demand. The 5.7% decline in spot rates from January and February provides further support to the theory that the market is showing signs of returning to typical seasonality, or a somewhat muted version of it. Looking back to 2018, the last year of what most consider typical seasonality before the 2019 industry recession and supply chain disruptions caused by the pandemic (2020 to 2022), we see sequential spot rate increases from November 2017 to January 2018 before dropping off again in February. This pattern can also be noted at the end of 2018 leading into 2019 ahead of the industry recession. The sample size is small, however, and there is still strong evidence supporting the idea that the market cycle has yet to find its floor so we cannot claim for certain that the seasonality theory will hold up. The coming months may shed more light on the matter but also pose a risk of creating the false narrative that the market has hit a true inflection point with the influx of produce volume and construction-related freight against weaker-than-normal demand levels.
Truckload Demand
Key Points
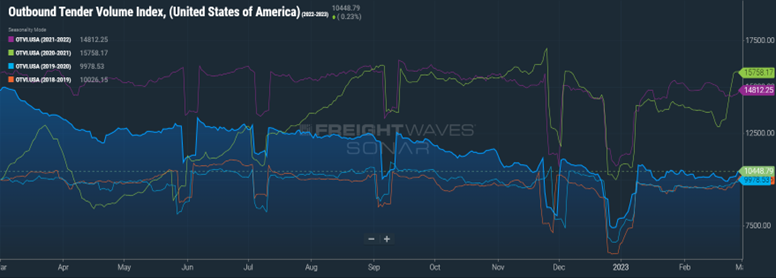
- The FreightWaves SONAR Outbound Tender Volume Index (OTVI), which measures contract tender volumes across all modes, increased for the second consecutive month in February, registering 2.6% above January’s reading. On a yearly basis, however, the OTVI was down 29.5% from February-2022 levels and remained 14.4% below the 5-year average.
- The Cass Freight Index, which analyzes the number of freight shipments in North America and the total dollar value spent on freight shipments, reported decreases in February YoY levels for both Shipments and Expenditures of 0.3% and 9.7% respectively.
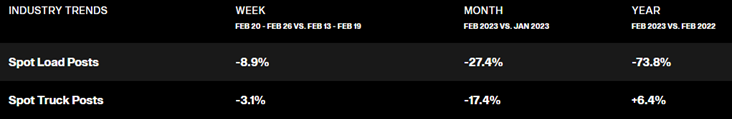
- Spot Market volumes were down -73.8% YoY in February according to DAT. MoM volumes decreased -27.4%
Summary
Contract market volumes have remained relatively steady so far in 2023 from the initial demand surge at the start of the second week in January. Since that week, there has been little variance in the Outbound Tender Volume Index on a daily basis, averaging a 0.1% decrease change DoD. Spot market volumes remain extremely volatile, however, and resumed the significant MoM declines that began roughly around this time last year. FreightWaves SONAR Contract Loads Accepted Volumes Index (CLAV), which measures carriers’ willingness to accept contracted load volumes, saw a 3.4% increase MoM, painting a clearer picture for the continued deterioration of the spot market. As overall demand remains near pre-pandemic levels, carriers are focused on meeting current customer routing guide requirements, thus leaving little volume to be pushed out to bid on in the spot market.
Truckload Supply
Key Points
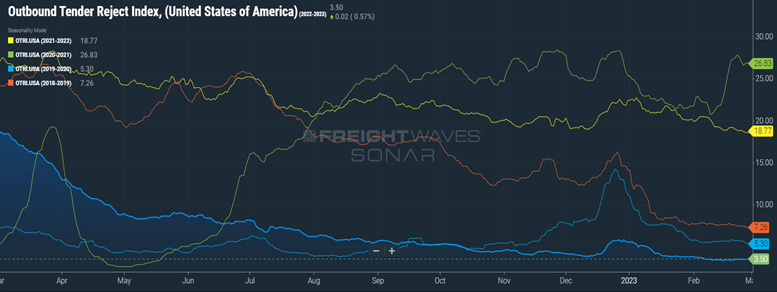
- The FreightWaves Outbound Tender Rejection Index (OTRI), which measures the amount of loads rejected by carriers that are under contract as a percentage, registered roughly 17.1% below February 2022 averages after dropping 1.1% MoM from January.
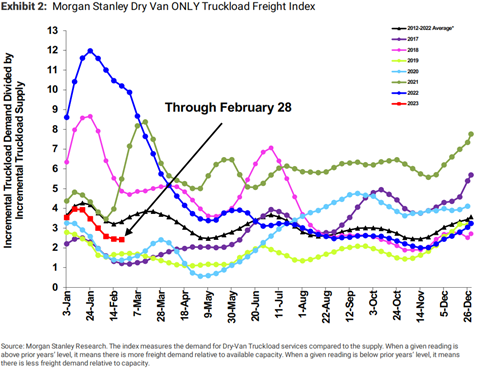
- The Morgan Stanley Truckload Freight Index (MSTLFI) declined in the first half of February before flattening out through the back half and continues to underperform against normal seasonality. It remains below the long-term average (the black line in the chart below), as it has since mid-August of last year.
Summary
The truckload supply remains oversaturated as demand levels show little sign of recovery. The decline of rejections rates between January and February was the most significant drop on a monthly basis since August 2022, as rates continue to reach record lows not seen since the 2019 recession. With the current state of the industry, many shippers are leveraging their pricing power against the soft demand by moving to quarterly bids and utilizing mini bids to continue capturing and locking in lower rates. Active utilization registered a full percentage point below expectations in January with an 87.4%, slightly above the record low set in Q4 of 2022, according to FTR. The January figure, which is the most current reading from FTR, now has the forecasted bottom to hit 84% by Q4 of 2023, 2.5% below what was previously projected. The adjustments in near-term utilization will have a marginal impact in the near-term market outlook but will likely be more noticeable once demand begins to recover.
Truckload Capacity Outlook
Key Points
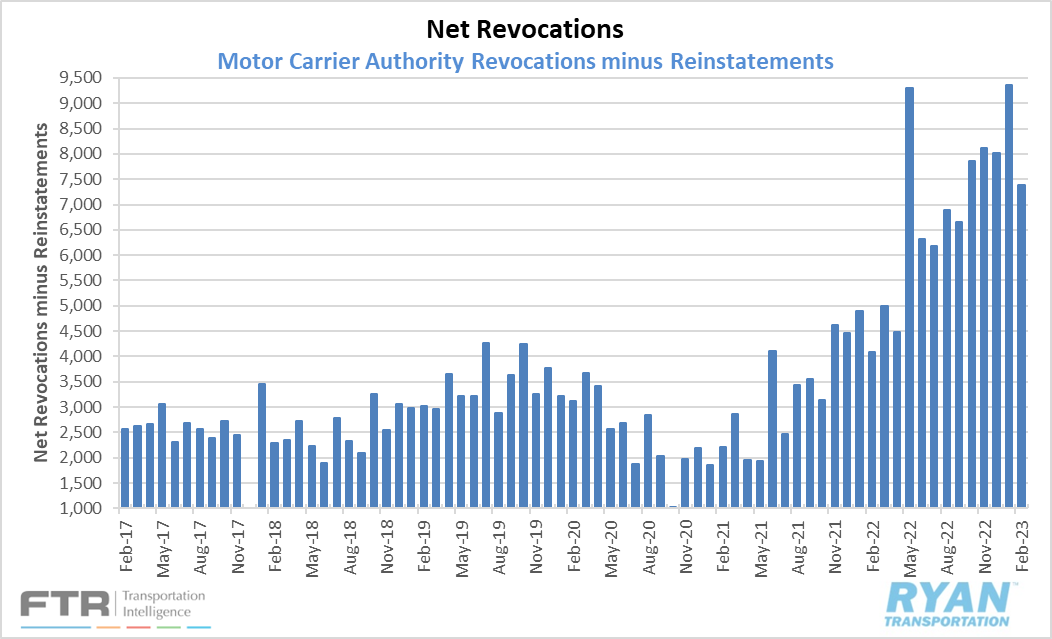
- FTR’s preliminary analysis of the Federal Motor Carrier Safety Administration (FMCSA) data indicates net revocations, which are revocations of operating authority minus reinstatements, dropped to 7,393 in February from the record high set in January of 9,350.
- After five consecutive months of declines, newly authorized for-hire trucking companies increased in February to 6,267, according to FTR.
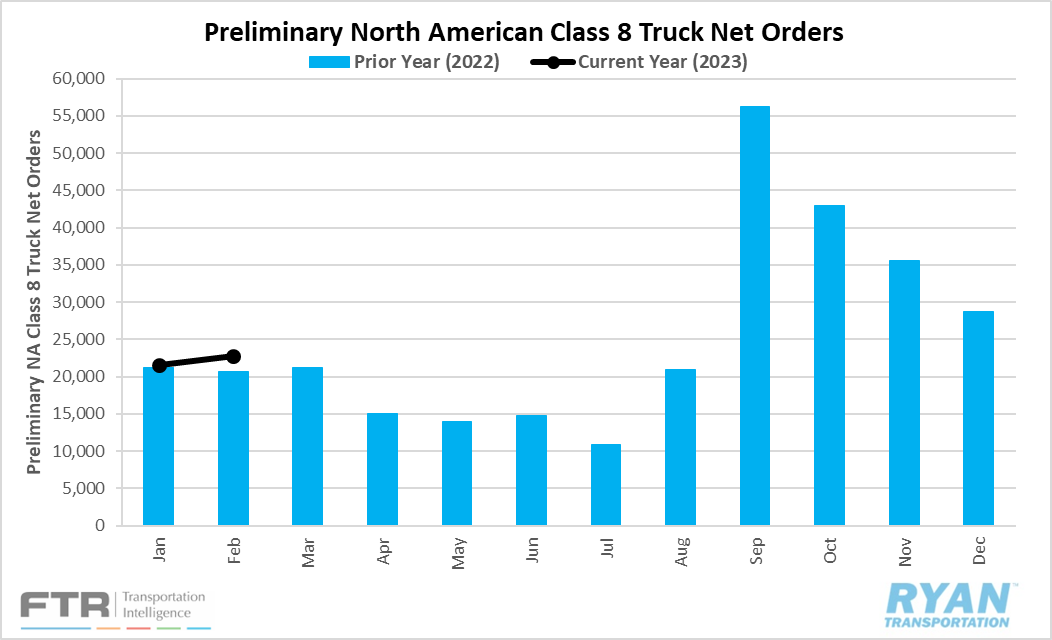
- FTR reported Preliminary Class 8 Orders rose in February to 22,800, a 13% increase from January’s order activity and a 10% increase YoY. ACT Research reported a slightly higher number in February with net orders totaling 23,600, or 22,400 on a seasonally-adjusted basis, a 13% YoY increase and 27% higher than January.
Summary
The net change in the carrier population continued to decrease in February by 1,126 carriers, according to FTR. Comparable to January’s net change of -3,464, the highest ever on record, February’s decline feels modest thanks to the sharp drop in net revocations against a slight increase in new authorized carriers. FTR notes that the process for revoking a carrier’s authority can take at least 30 days at a bare minimum but realistically at least a couple of months to finalize. With many of the required annual renewals for trucking authorities taking place in January, the previous month’s surge is likely attributed to smaller carriers opting out of those renewals and choosing instead to exit the market. Despite the decline, February’s revocation levels sits 81% above the previous year’s levels, indicating capacity is exiting at a significant pace as the market continues to search for balance.
Fuel Prices
Key Points
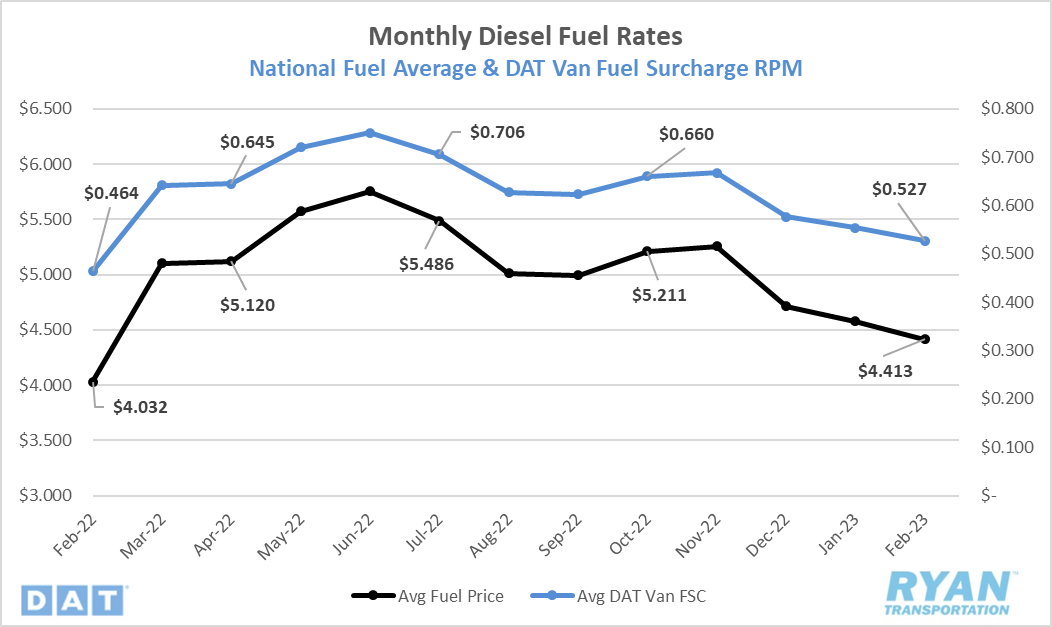
- The national fuel price average declined sequentially in February, dropping $0.328/gallon, finishing the month down 5.4% from where it started.
- February marked the fourth consecutive month of declines in fuel prices, bringing the national average within 10% of the levels prior to Russia invading Ukraine last year, sitting at +9.4% YoY.
- Crude Inventories far exceeded expectations, rising by 25.1M barrels versus 6.2M between the weeks ending February 3 and February 24, according to EIA reports.
Summary
National fuel prices ended February down by more than 26%, or $1.52 per gallon, since the record high of $5.81 set in the third week of June last year. The steady declines were in large part a result of increased refinery utilization, emergency releases of the U.S. Strategic Petroleum Reserve (SPR) and Russia still maintaining better than expected supply numbers despite sanctions. The warmer than normal temperatures this winter played a part as well by keeping demand for Liquified Natural Gas (LNG) low, diesel’s biggest competitor as both fuel sources are refined from the same distillate. The second and third week of February generally marks the beginning of refinery maintenance season as refiners decrease utilization to address needed repairs ahead of the warmer driving seasons, a process that can take anywhere from two to several weeks depending on the extent of required maintenance. With the drop in utilization paired with already muted demand levels, crude inventory increases exceeded expectations, which in turn should continue to keep near-term price levels suppressed.
Why It Matters: The global market has remained well supplied in the past few months as Russian supply has held up better than most expected. While the near-term forecast suggests it is likely to remain that way, the coming months could see several opposing factors that accelerate increase in prices. One major factor, that we mentioned in our last update, is increased demand from the reopening of China’s economy and its manufacturing activity. While it had lifted its zero-Covid policy in late December of 2022, the true impact has yet to be felt on a global scale as the Lunar New Year keeps the majority of its economic activity subdued at the start of every year. Another factor is the EU’s total ban on Russian energy imports going into effect, on top of Russia announcing it will cut supply by 500Mbbls/d starting at the beginning of this month, further reducing the global supply. This impact has seen futures for both Brent Crude and West Texas Intermediate start to trade higher with expectations for Brent, currently trading around $80/bbl, to surpass $100/bbl later this year.
Dry Van Overview
Spot Rates
Key Points
- The national average dry van spot rate excl. fuel surcharge ended February at $1.713/mile, a 6.6% decline from January.
- Van spot rates declined 34.8% YoY in February and remains 11.1% below the 5-year average.
Load-to-Truck Ratio
Key Points
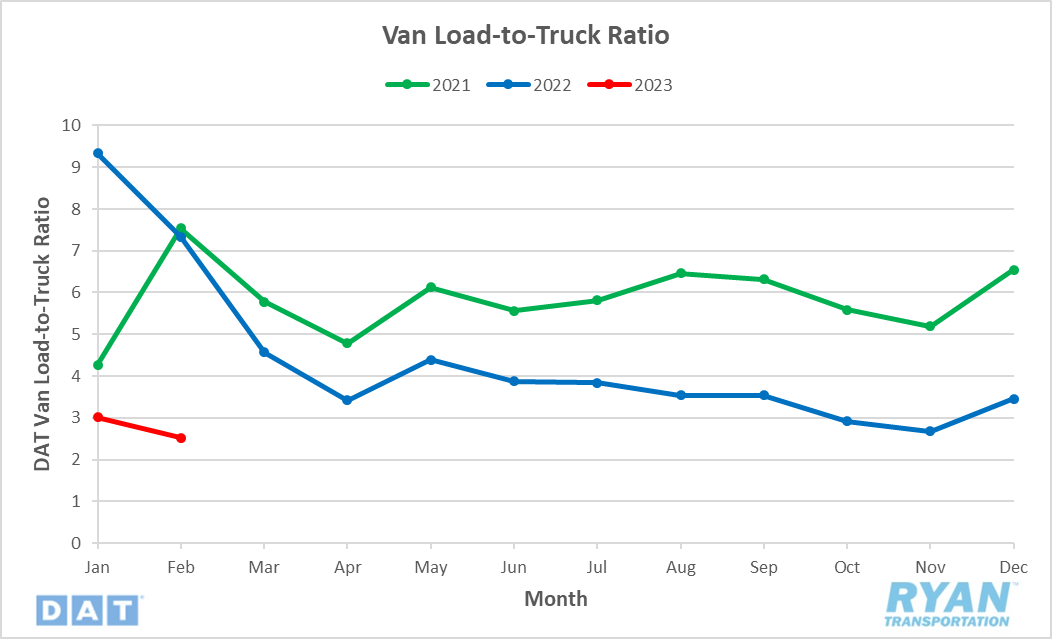
- The dry van load-to-truck ratio was down 19.7% MoM and 67.1% YoY in February.
Market Conditions
Dry Van Summary
Dry van rates on a YoY basis have felt the most impact of softening demand so far in 2023 out of the three major modes. Through the third week of February, van rates excl. fuel dropped roughly 14%, or just over $0.28 per mile, from their elevated status the last week of 2022, when holiday impacts and significant weather caused a capacity squeeze.
Reefer Overview
Spot Rates
Key Points
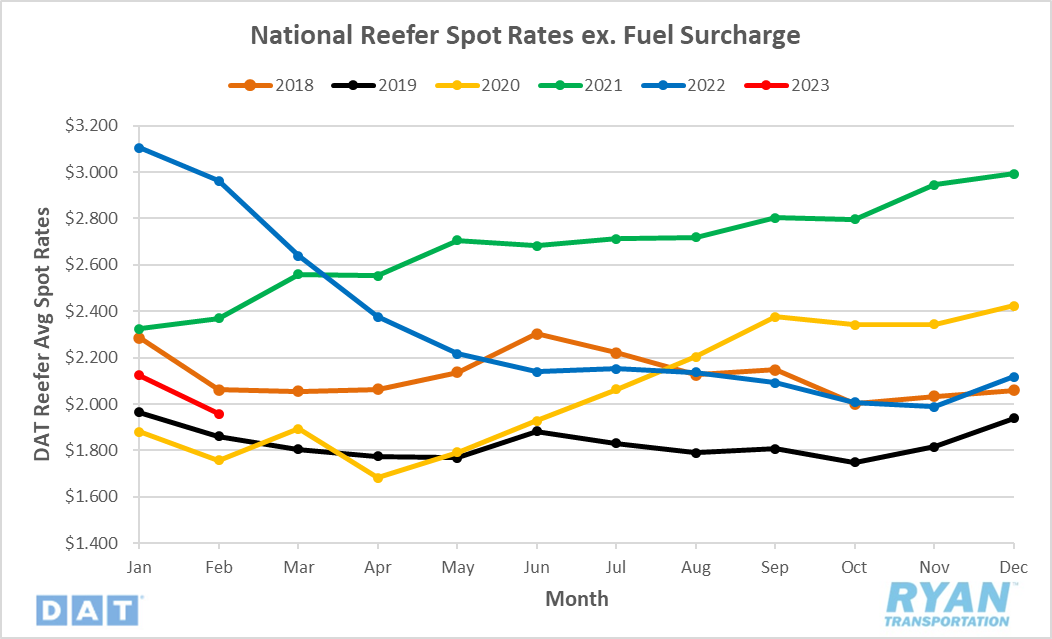
- The national average reefer spot rate excl. fuel surcharge in February was $1.96, falling 7.9% from the previous month.
- Reefer rates in February were 34.0% below 2022 levels and 11.2% below the 5-year average.
Load-to-Truck Ratio
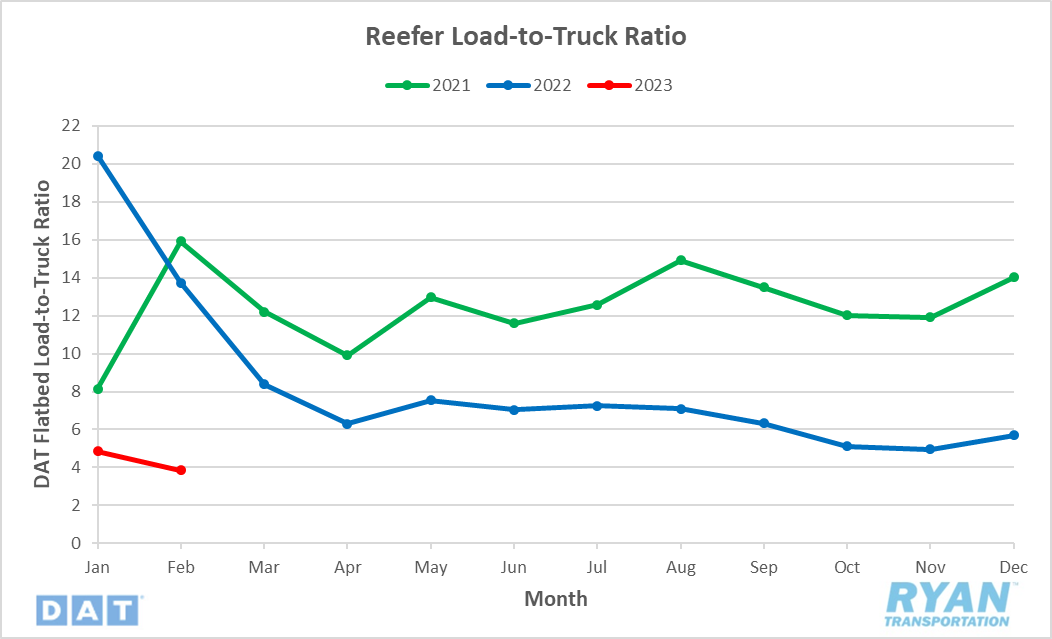
Key Points
- The reefer load-to-truck ratio fell 23.5% MoM in February and was 72.9% below 2022 levels.
Market Conditions
Reefer Summary
The refrigerated sector is not far behind dry vans for feeling the downside of the softening market. Q4 was particularly difficult for reefers as colder weather forced many customers to utilize the insulated trailer to protect their product from freezing, significantly reducing the available capacity. The unseasonably warm temperatures this winter paired with dwindling demand, meaning reefer carriers were not able to capitalize on the influx of additional volume as they had years past until the last week of 2022 when the arctic freeze that swept across the country caused reefer rates to jump 20%, or $0.41, from the week before. However, those gains were completely erased by the first week of February with rates having declined $0.42. We anticipate this trend to continue through most of March, pending any significant weather events, with signs of tightening starting toward the end of the month as carriers begin to reposition ahead of produce coming out of Florida and Texas.
Flatbed Overview
Spot Rates
Key Points
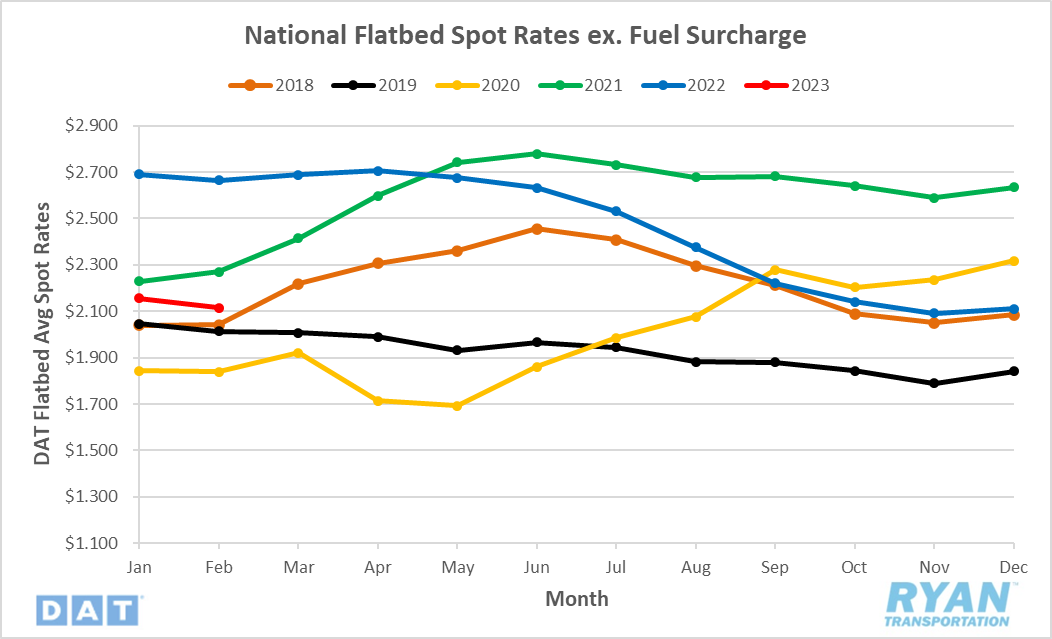
- The national average flatbed spot rate excl. fuel surcharge in February was $2.12, dropping 1.9% from January.
- Flatbed spot rates in February were down 20.6% YoY, sitting 5.4% below the 5-year average.
Load-to-Truck Ratio
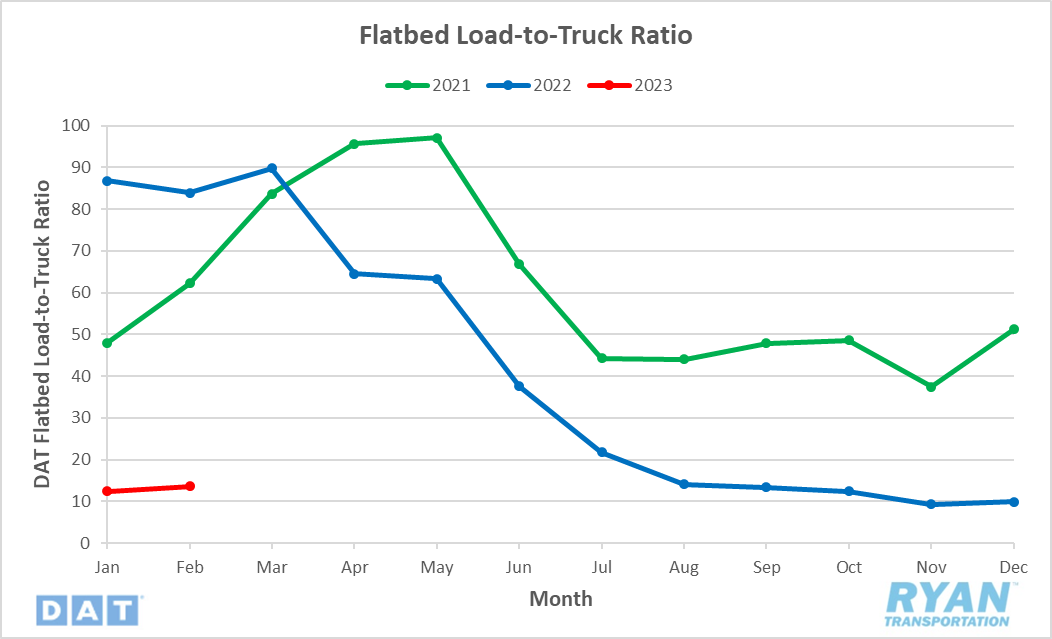
Key Points
- The flatbed load-to-truck ratio declined 84.3% YoY but saw a MoM increase of 5.8% from January.
Market Conditions
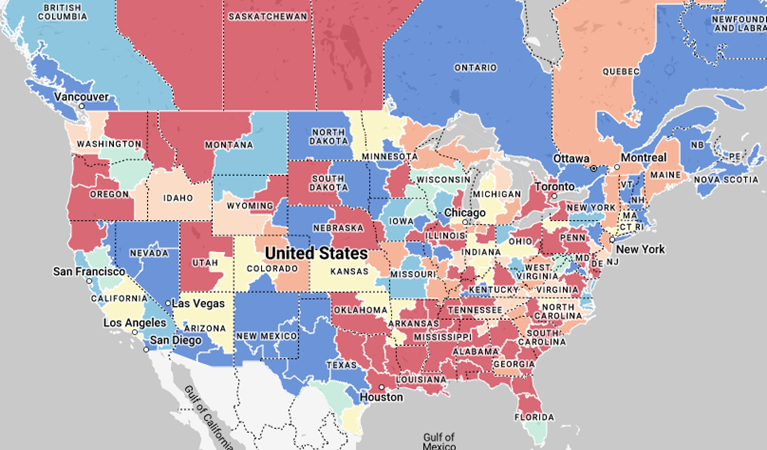
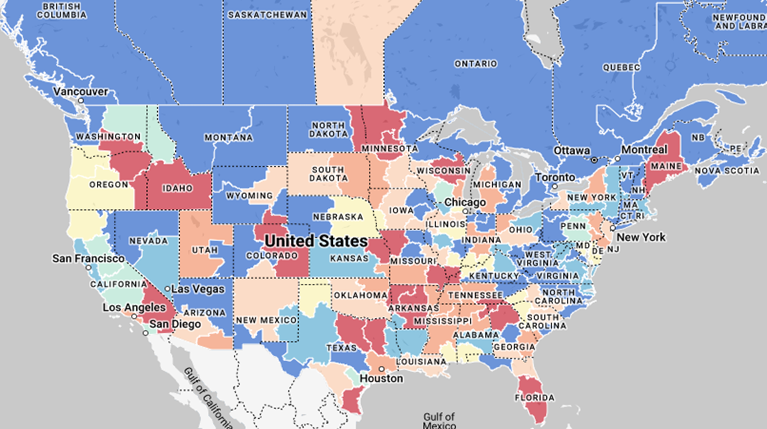
Flatbed Summary
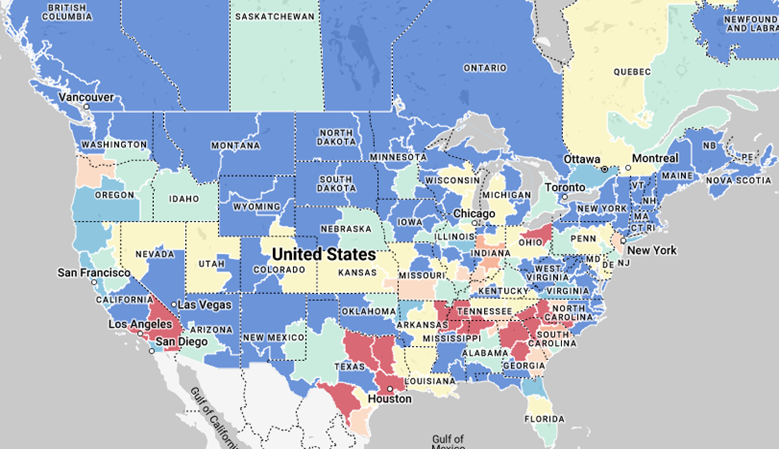
The flatbed market remained flat through most of February as general flatbed freight remained mostly out of season. The last week of February, however, began to see capacity tightening across the Southeastern corridor and into parts of East Texas as DAT reported load posts from the area surged by 30% from the previous week. While volumes remain roughly 80% below 2022 levels, the tightening is in line with typical seasonality as construction season starts to ramp up.
Further Reading
- FreightWaves: American Shipper: Imports sink again as wholesale inventories remain bloated
- FreightWaves: Manufacturers move away from China in light of supply issues, cost increases
- Logistics Management: Preliminary February Class 8 truck net orders see gains