
Executive Summary
Despite some tightening in capacity and fuel costs in late December due to holidays and arctic weather, we see the remainder of January through Q2 looking like the trends set in Q4 of 2022. Spot and contract rates have flattened and appear to be near a new equilibrium point similar to pre-pandemic levels. The December CPI figures will likely convince the Federal Reserve to lower future interest rate hikes, increasing the likelihood of a soft landing. Import volumes also remain near pre-pandemic levels, but if consumer demand remains steady, there will be a point when retailers and manufacturers will need to replenish inventory levels.
January Outlook
- TL Capacity
- Decreasing fuel prices will continue to expose smaller carriers to softening spot rates, forcing further increases in net revocations with the potential to move up the timeline of a significant capacity shift in Q2.
- Maritime/Imports
- Freightwaves Container Import Bookings Index in December was down 33.4% YoY, finishing the year only 2.6% above 2019 levels when the last freight recession occurred.
- Employment vs. Monetary Policy
- The Federal Reserve is considering further interest rate increases between 25 - 50 bps as jobs reports continue to remain strong. The Fed raised interest rates 225 bps in the second half of 2022.
Economy
United States ISM Manufacturing PMI
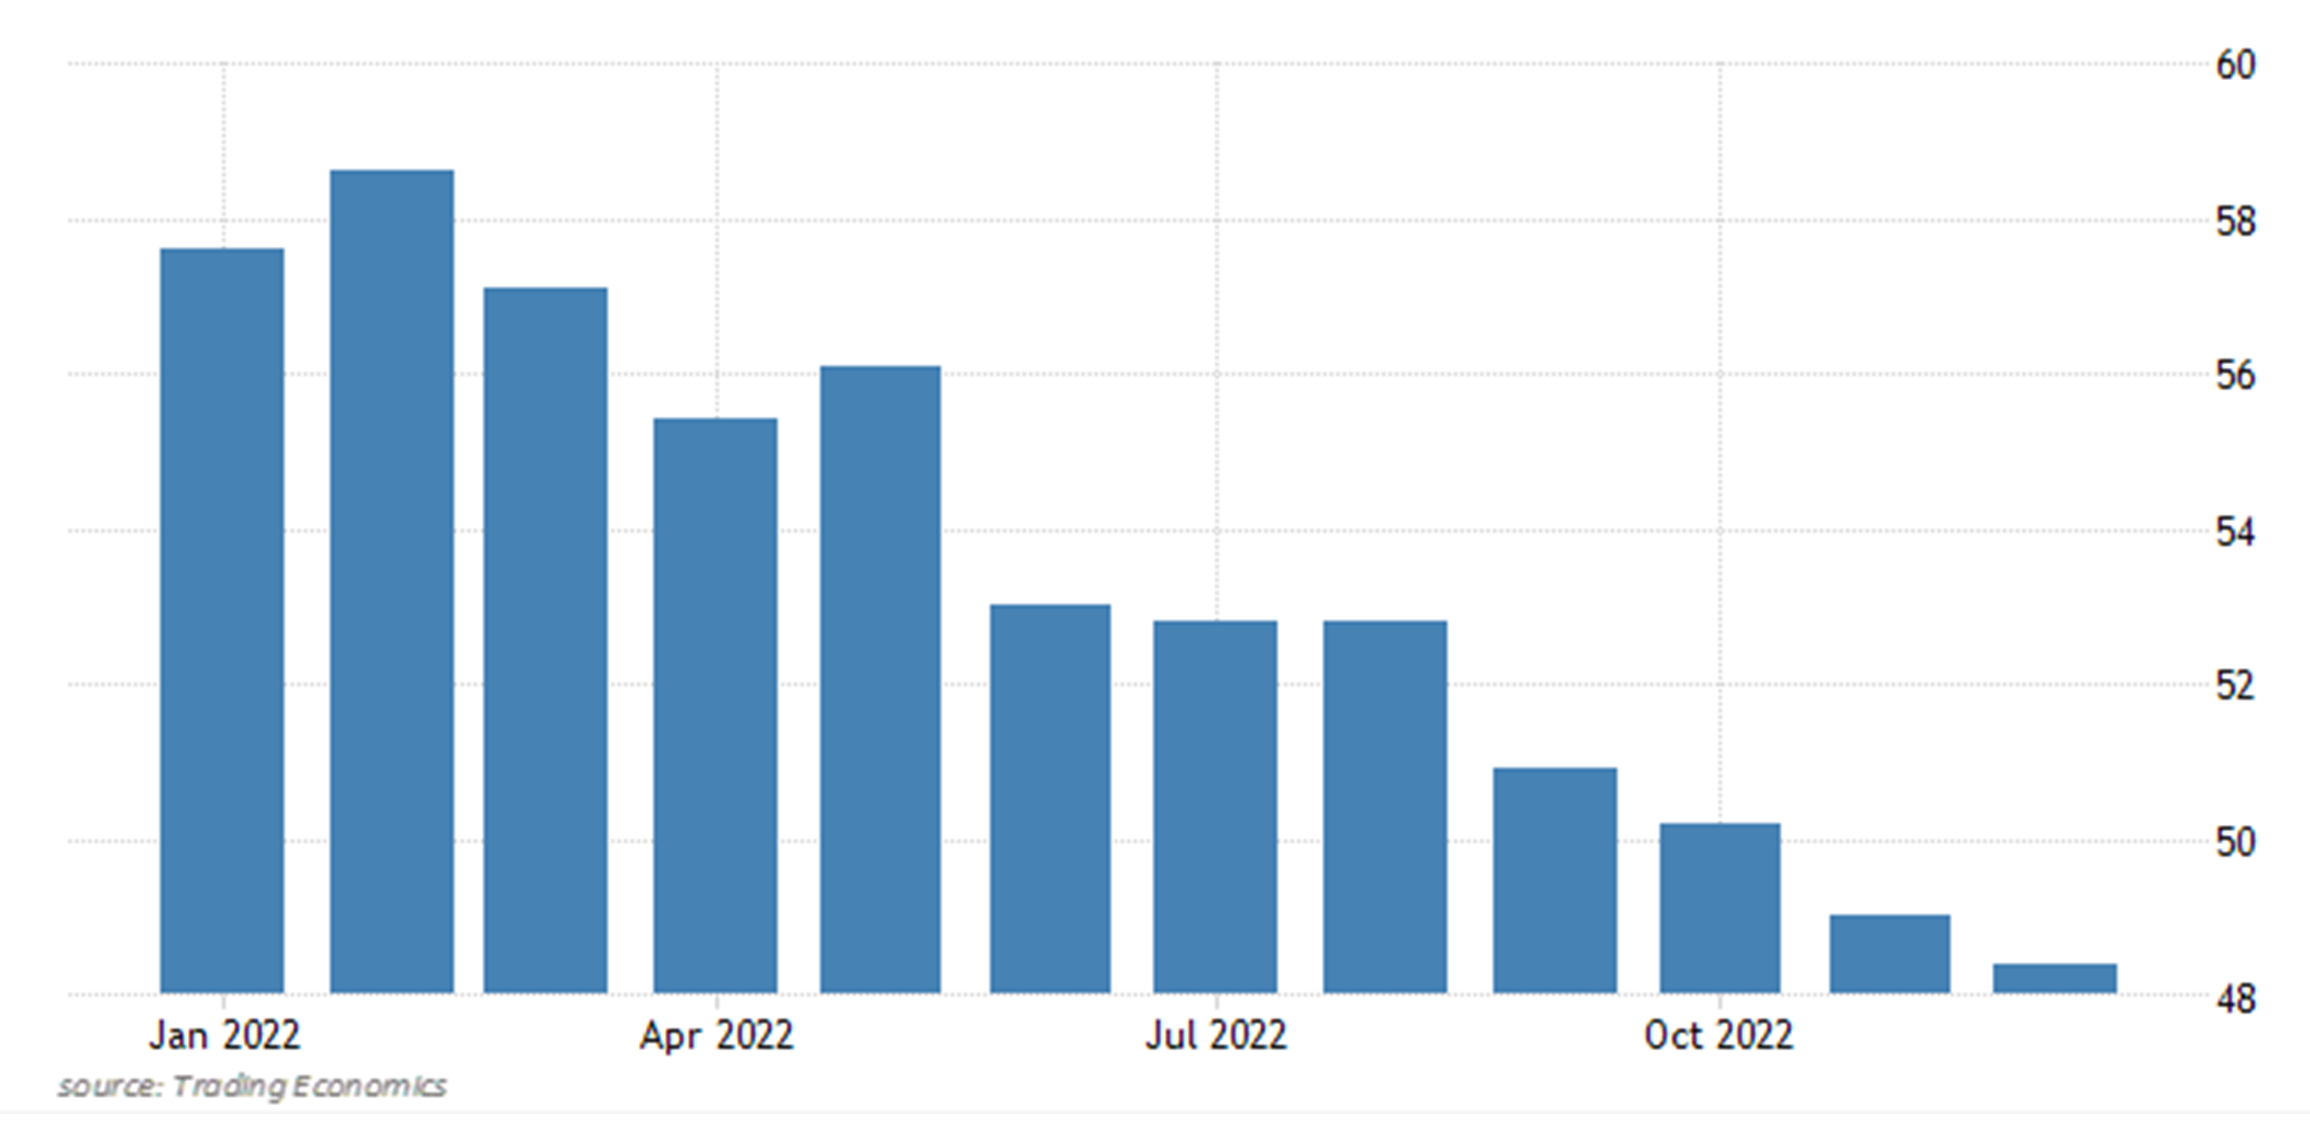
Key Points
- The ISM Manufacturing PMI® for December registered 48.4%, 0.6 percentage points below the 49% reading recorded in November.
- New orders moved further into contraction registering 45.2%, down 2% from November.
- Inventories grew in December, registering 51.8%, a 0.9% gain from November.
- Production moved into contraction territory, dropping 3.0% in December from November and below the 50% threshold.
- Employment registered 51.4% in December, a 3% gain from November, moving it back into growth territory.
Summary
This is the second consecutive month the ISM Manufacturing PMI® registered in contraction territory after spending 29 consecutive months in growth territory. This is also the lowest reading since May 2020, when it registered 43.5%. This is expected to be the norm at least through the first quarter of 2023, with the PMI® registering between 48% and 52%.
While inflation is showing signs of decelerating, it continues to tighten consumer spending, and the previous disruptions downstream in the supply chain are starting to trickle upstream. Inventories continue to grow for a 17th consecutive month, forcing further cuts to new orders and slowing production. There are a few positive signs for future activity as employment remains strong and prices continue to drop for a third consecutive month.
Macro Factors
- Jobs reports remained strong in December with 223,000 jobs added and the unemployment rate falling to 3.5%, matching the lowest level in 53 years.
- Several major U.S. companies have already announced significant cuts to their workforce in the first few weeks of January with likely more to follow to help increase bottom lines.
- The Consumer Price Index (CPI) fell 0.1% in December after increasing 6.5% over the last 12 months.
- The decrease in gas prices was the largest contributor for bringing the CPI down, dropping 9.4% from November.
- Food and housing both increased MoM, with December readings 0.3% and 0.8% respectively up from November.
Industry Overview
December Key Figures (YoY)
| Truck Data Points | YoY % Change |
| DAT Spot Rates (incl. FSC) | -17.3 |
| Fuel Prices | +29.5 |
| ACT Class 8 Preliminary Orders | +25.0 |
| ATA NSTA Truck Tonnage | +0.70 |
| Cass Freight Expenditures | -4.30 |
| Cass Freight Shipments | -3.90 |
Spot Rates
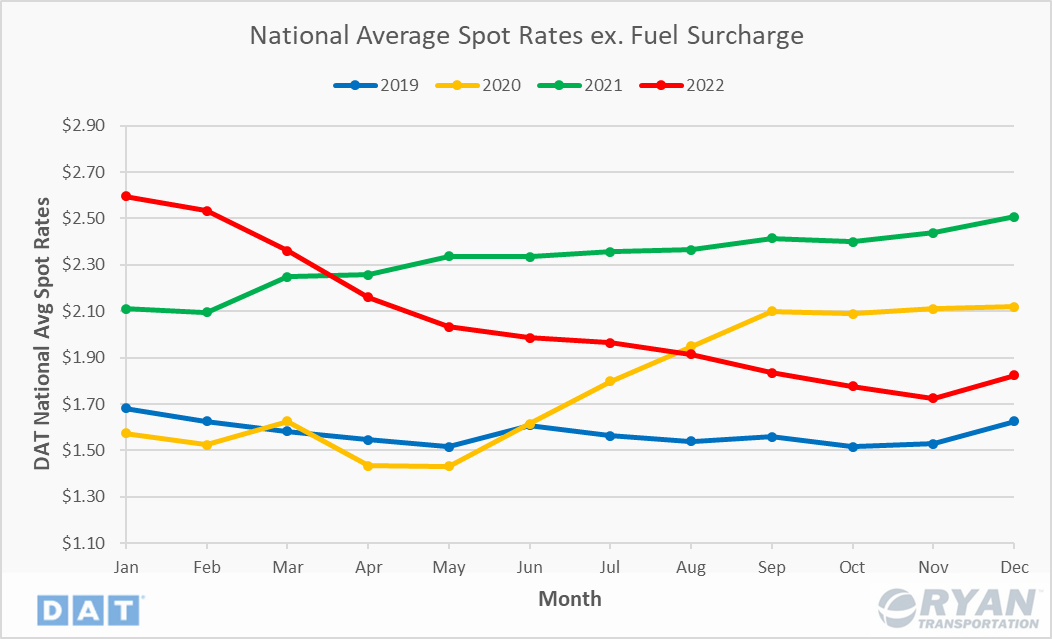
Key Points
- National spot rates excl. fuel surcharge declined 27.1% YoY in December and ended the year down 29.7% from the record highs set in January.
- After 11 consecutive months of decline and underperforming seasonality, spot rates excl. fuel increased 5.8% between November and December and are in line with historic trends.
Truckload Demand
Key Points
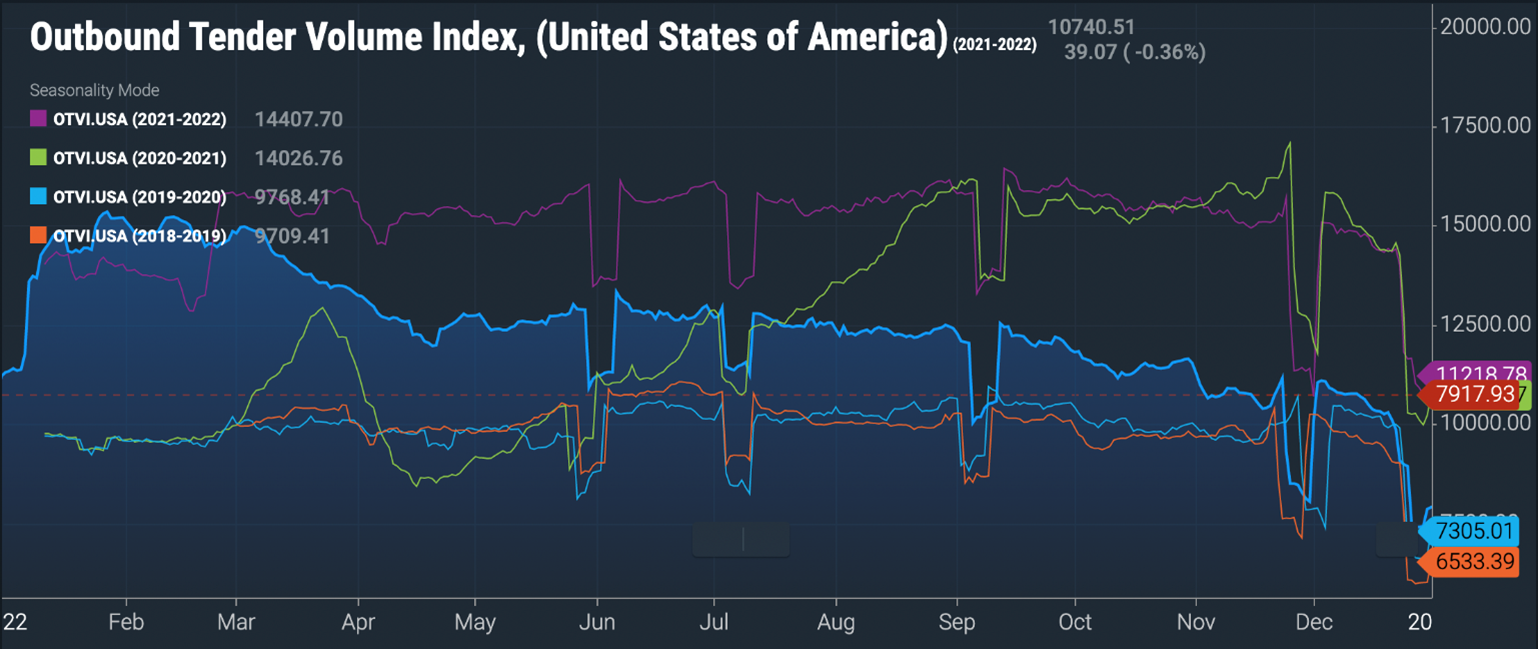
- The Freightwaves Outbound Tender Volume Index (OTVI), which measures contract tender volumes across all modes, fell 29.4% YoY in December and registered 3.6% below November. The OTVI ended the year 9.4% below the five-year average.
- The Cass Freight Index, which analyzes the number of freight shipments in North America and the total dollar value spent on freight shipments, reported declines in December YoY levels for both shipments and expenditures by 3.9% and 4.3% respectively.
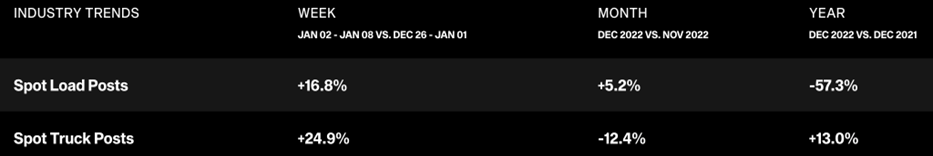
- Spot Market volumes were down 57% YoY in December according to DAT. Volumes did increase 5% MoM which is normal during this time of year due to peak retail shipping.
Summary
While truckload demand saw considerable declines in the first half of 2022, volume trends toward the end of the year showed signs of nearing typical seasonality. While spot market volumes saw the biggest declines, contract volumes remained relatively steady, indicating a move by shippers to lean more on awarded contracts and increased routing guide compliance. This is prevalent in the Freightwaves Contract Load Accepted Volume Index (CLAV), which adjusts the OTVI by the decrease in rejection rates to measure accepted load volumes moving under contractual agreements, which registered only 14% below 2021 levels in December.
Truckload Supply
Key Points
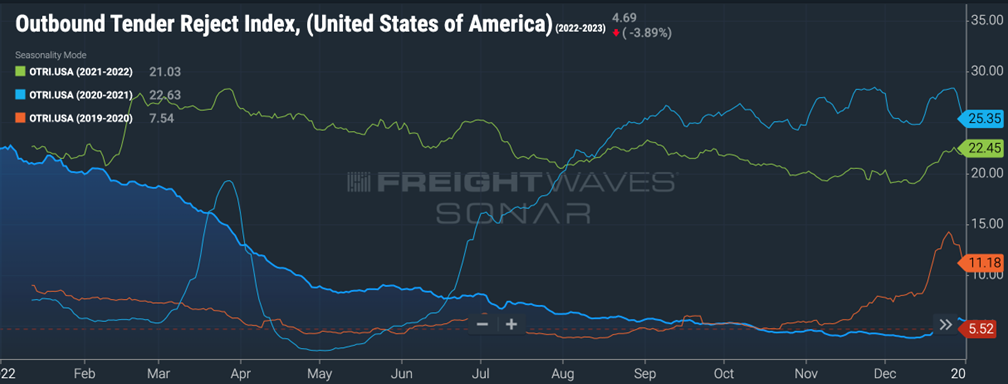
- The Freightwaves Outbound Tender Rejection Index (OTRI), which measures the amount of loads rejected by carriers that are under contract, was down 75.4% YoY in December and 50.6% below pre-pandemic levels.
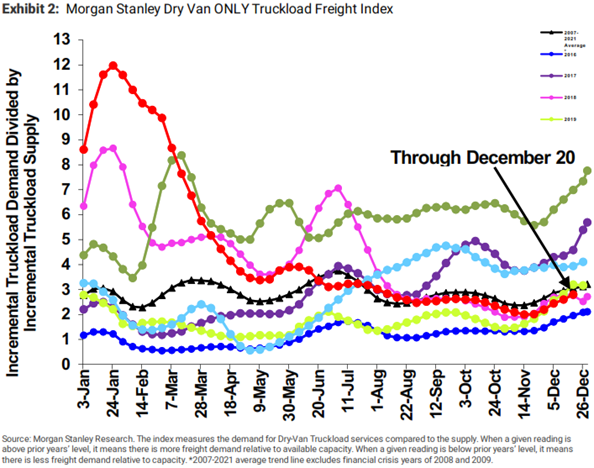
- The Morgan Stanley Truckload Freight Index (MSTLFI) outperformed seasonality and increased sequentially between November and December to close out the year. It currently sits slightly below the long-term averages after initially dropping below mid-August.
Summary
Available truckload capacity in December remained steady against normal seasonality. Historically, available capacity tightens post-Thanksgiving leading into the week of Christmas when supply decreases substantially. This comes as a result of an influx of volume as retailers make a final push to get product out ahead of the holidays paired with drivers heading home for the holidays.
Rejection rates saw a slight uptick in the last few weeks of December to close out the year as anticipated with drivers returning home for the holidays. Heading into 2023, rejections are likely to remain elevated following normal trends. The weeks following Christmas are considered the “reverse retail peak” as returns of unwanted Christmas gifts to retailers dominate the space and drivers remain out of place.
Truckload Capacity
Key Points
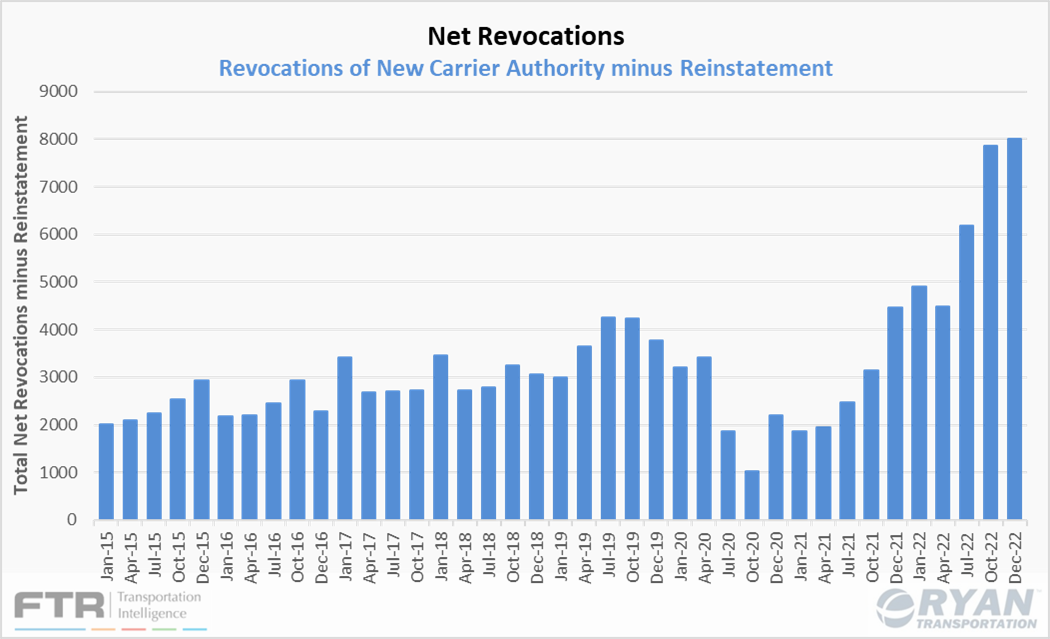
- FTRs preliminary analysis of the Federal Motor Carrier Safety Administration (FMCSA) data indicates net revocations, which are revocations of operating authority minus reinstatements, totaled roughly 8,000 in December.
- New entrants, which are newly authorized, for-hire trucking companies, eased down from around 6,500 in November to roughly 6,000 in December, FTR estimates.
- Class 8 preliminary orders fell in December for the third consecutive month to 28,300 units, a roughly 21% decline MoM according to ACT research.
Summary
FTRs analysis paints a troubling picture for truckload capacity heading into 2023. November and December both had the highest number of net revocations in a month on record. The previous record was also set last year in May when rising fuel prices and declining spot rates forced an early mass exodus. With net revocations increasing and new entrants easing, the timeline of the current deflationary market could be narrowing. FTR reports the initial surge in revocations in May saw many of the drivers shift to larger carriers based on the surge in payroll employment during that period. However, according to recent payroll data from the Bureau of Labor Statistics, the slight increase in payroll jobs in for-hire trucking between November and December is much lower than in May, indicating that large assets have already hired the drivers they need. FTR suggests the new decline in carriers probably means an overall decline in driver supply.
Fuel Prices
Key Points
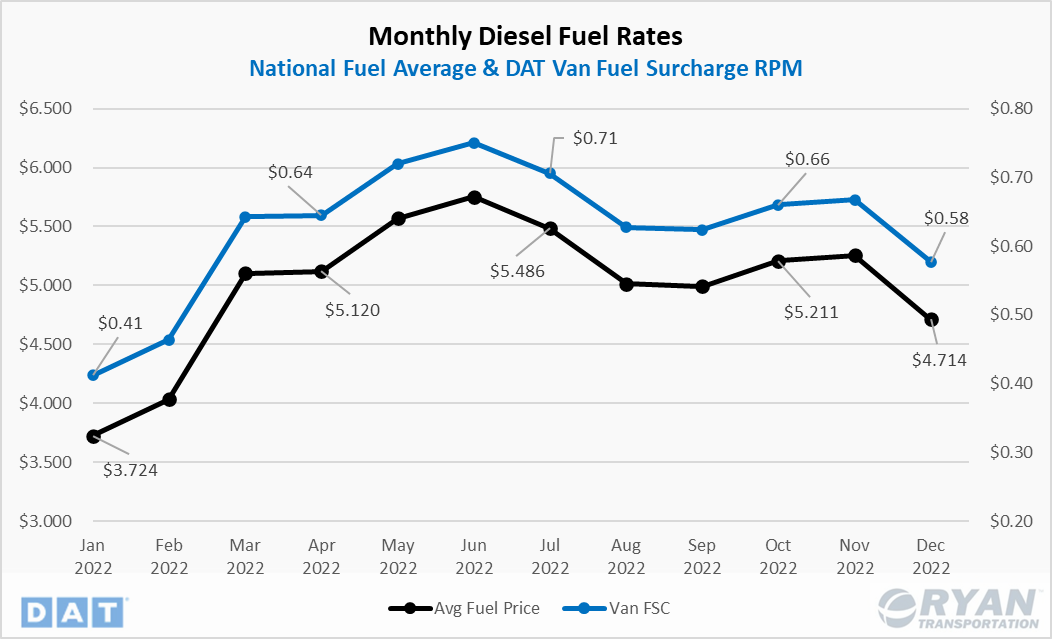
- Fuel prices were 22.7% above the five-year average at the start of 2022.
- Fuel prices saw the largest MoM increase on record since 1994 after Russian invaded Ukraine, jumping 26.6% or $1.073/gallon.
- After peaking in June with an average price of $5.754/gallon, prices saw moderate declines to close out the year, with December finishing 26.6% above the start of 2022 and 60.1% above the five-year average.
Summary
Despite starting the year already elevated, oil prices reacted as expected when Russia, the second largest producer in the world at the time, waged war on Ukraine. Fears of supply constraints created turmoil in the market with Western and NATO sanctions on importing Russian oil, further exacerbating the issue. After calls to OPEC+ to increase production to counter the reduction in global supply went unheeded, the current administration tapped the Strategic Petroleum Reserve to release crude oil into the market in an effort to contain pricing. This release, however, meant domestic supply had to compete with the government for purchases causing U.S. pricing to spike.
After conservation efforts enacted in 2020 to tamper down U.S. refinery utilization, the events in 2022 required those efforts be temporarily suspended as refinery utilization finished the year 4% above the long-term average according to the EIA. The ramp up in utilization has restabilized historic low distillate inventories and brought fuel prices down from their June 2022 peak.
Dry Van Overview
Spot Rates
Key Points
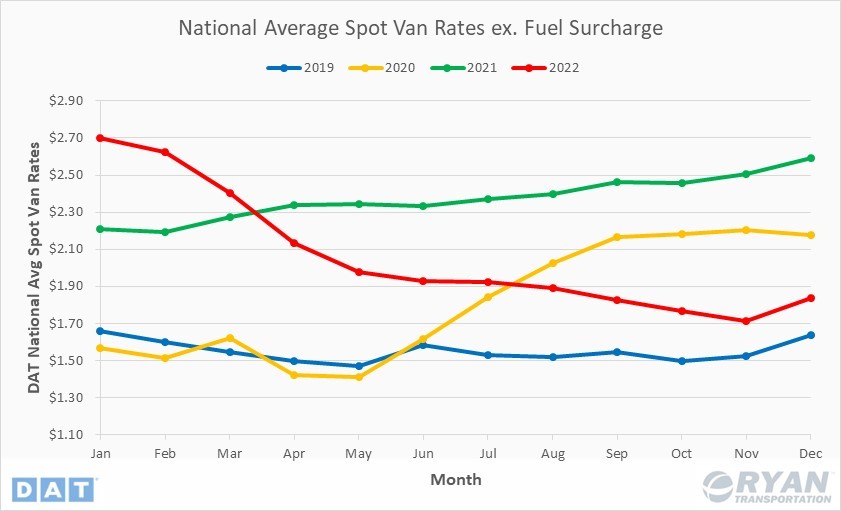
- Dry van spot rates excl. fuel decreased 29.3% YoY in December.
Summary
Dry van spot rates excl. fuel felt the most impact as the market declined in 2022, finishing the year off down 32.1% from its record high in January of $2.70/mile. Dry vans account for the largest share of truckload volume moved each year between the three major truckload modes. Due to its primary use of general freight and the wide scope of commodities that fall into that category, dry van rates are a good indicator for gauging which phase of the market cycle the industry is in.
Load-to-Truck Ratio
Key Points
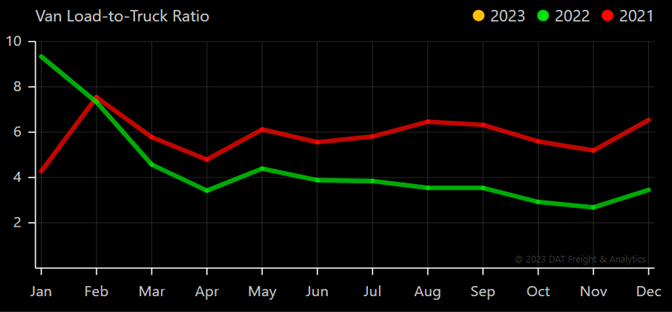
- The dry van load-to-truck ratio declined 47.3% YoY in December.
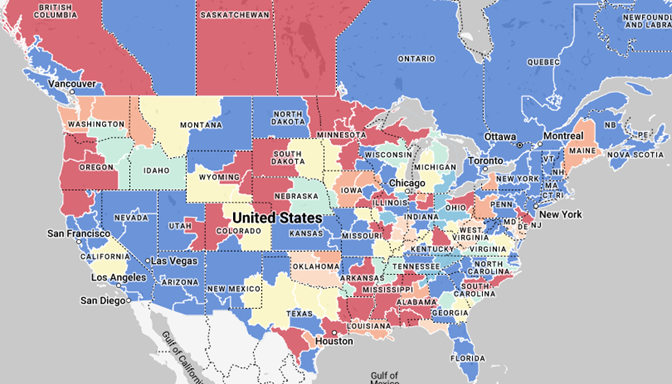
Market Conditions
Reefer Overview
Spot Rates
Key Points
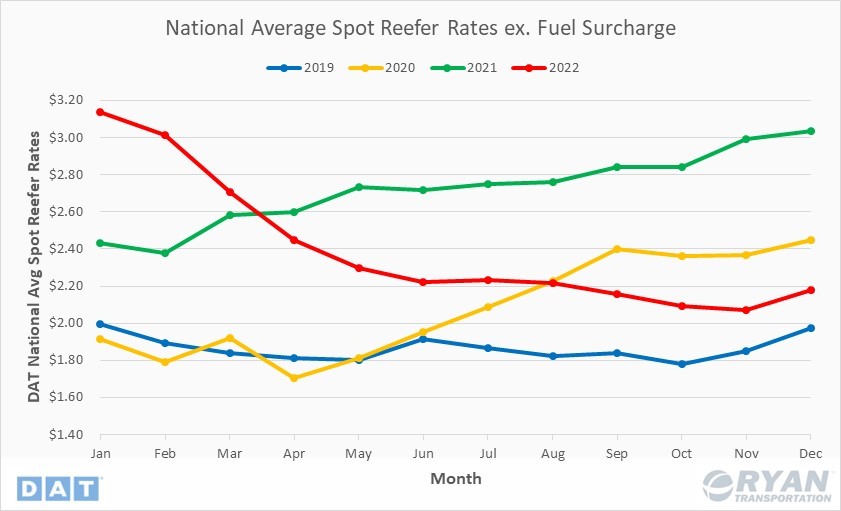
- Reefer spot rates excl. fuel surcharge decreased 18.8% YoY in December.
Summary
Reefer spot rates excl. fuel surcharge also performed poorly in 2022 and were a close second to dry vans as most impacted by softening demand. After peaking in January at $3.14/mile, reefer linehaul spot rates dropped 30.6% over the course of the year, ending the year at $2.18/mile.
Load-to-Truck Ratio
Key Points
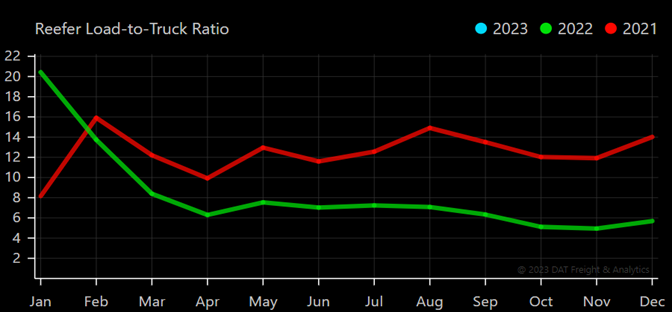
- The reefer load-to-truck ratio declined 59.4% YoY in December.
Market Conditions
Flatbed Overview
Spot Rates
Key Point
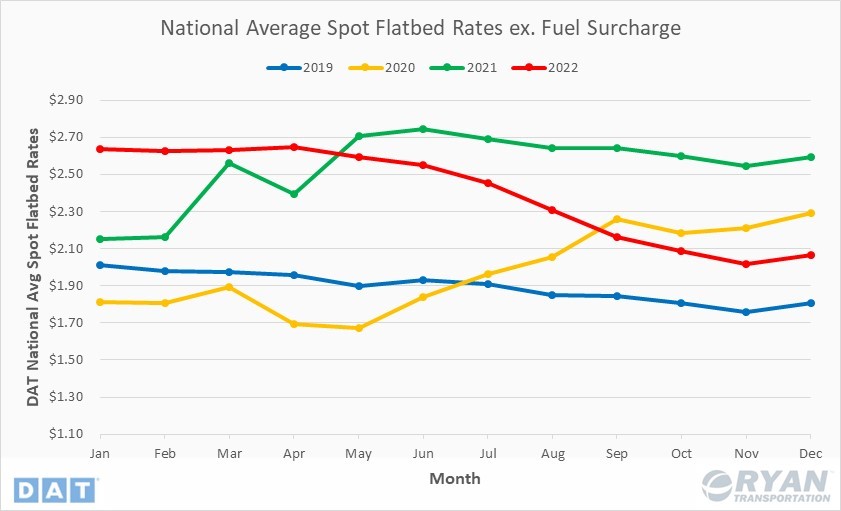
- Flatbed spot rates excl. fuel surcharge decreased 10.2% YoY in December.
Summary
Flatbed spot rates excl. fuel surcharge outperformed the other two modes during 2022, with rates finishing 21.5% below their levels at the start of the year. Due to the seasonality of flatbed freight that begins ramping up in early spring and peaking during the summer months, flatbed carriers were able to prolong their elevated rates while the rest of the market began trending down. Flatbed rates excl. fuel remained consistent with 2021 levels through the first half of the year, peaking in April at $2.65/mile before starting to decline.
Load-to-Truck Ratio
Key Point
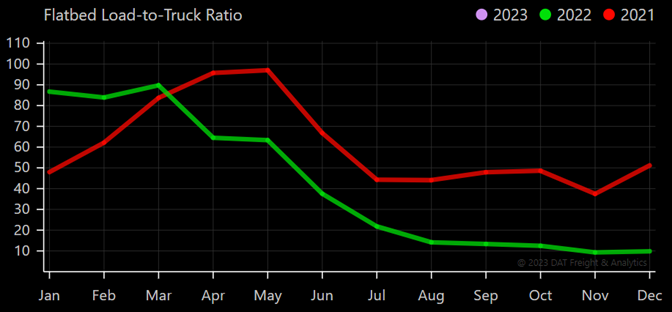
- The flatbed load-to-truck ratio declined 80.7% YoY in December.
Summary
While flatbed carriers were able to insulate themselves against overall declining spot rates for a large part of 2022, available flatbed loads suffered the most out of the three modes. As seen above, flatbed demand underperformed seasonally as peak season generally runs mid-spring through mid- to late-fall.
Market Conditions
Additional Reading
- U.S.-bound imports are heading back to pre-pandemic numbers, reports Port Tracker – Logistics Management
- Total freight costs fall year over year in December for first time in 28 months – FreightWaves
- December Class 8 Sales Reach All-Time High – Transport Topics