
Executive Summary
With pockets of tightness in early January, spot rates fell as we headed into February. We anticipate this trend continuing into Q2 of this year. Since contract rates lag spot rates, downward pressure on contract rates will be persistent as this environment continues. Capacity as a whole is readily available. This has been the main driver so far for the deflation in rates, however, overall freight demand may start to slow as the economy still tries to find balance. Import activity saw a monthly increase in January of 7.2% versus December, however, current levels are almost identical to 2019 and 2020 levels. The outlook for February does not get any better as current projections have imports ending the month 26% below YoY levels and 3% below levels seen in 2019.
Main Takeaways
- Freight demand has been strong, however, economic uncertainty is causing demand to slow.
- FreightWaves outbound tender reject levels are at all-time lows, signaling that carriers are taking almost all volume at their agreed upon contractual rate.
- The spread between spot and contract rates are still elevated historically. Typically, we see a normal environment supporting spreads between $0.35 and $0.45. Current levels are around $0.55, so downward pressure will be applied until the markets normalize.
- We do anticipate the bottom to be seen in Q2 and a relatively stable environment throughout the rest of the year, with 'normal' seasonality the main risk to any market disruption.
Economy
United States ISM Manufacturing PMI
Key Points
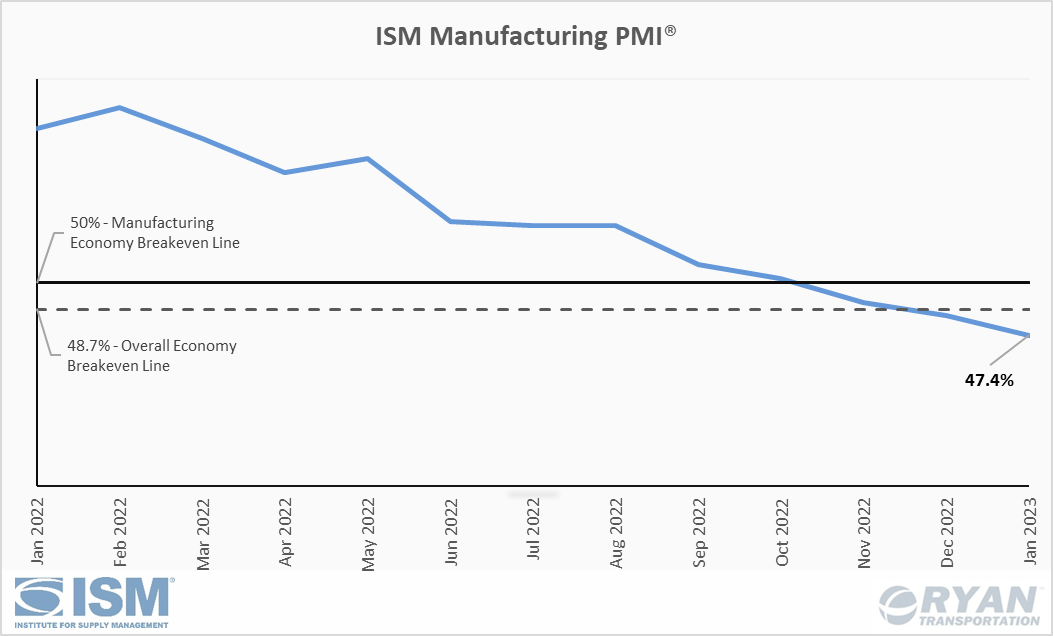
- The ISM Manufacturing PMI® for January registered 47.4%, 1.0 percentage point below the 48.4% reading recorded in December and the third consecutive month in contraction territory.
- Of the five subindexes that directly factor into the Manufacturing PMI® (New Orders, Production, Employment, Supplier Deliveries, and Inventories), only Employment and Inventories registered in growth territory in January, however both slowed compared to December.
- Both the New Orders Index and Production Index remained in contraction territory, registering 42.5% and 48% respectively in January. This is the fifth consecutive month in contraction for the New Orders Index and second consecutive month for Production. Both indexes registered lower in January than the December readings, dropping 2.6 percentage points and 0.6 percentage points respectively.
- The Prices Index registered 44.5% in January, a 5.1 percentage point increase from the December reading of 39.4%.
Summary
The Manufacturing PMI® reading in January is at its lowest level since May 2020 when the coronavirus pandemic recovery began. The composite index reflects businesses’ near-term expectations of continued softening demand through the first half of 2023. New Orders continue to see strong contractions as inflated prices refocus consumer spending habits on essentials. While prices remain elevated, the January reading of 44.5% versus the expected 39.5% indicates the inflationary pressures are cooling. The Output/Consumption factors of the PMI® measured by Production and Employment had a significant negative impact on the index in January. Employment remaining in growth territory, despite slowing in January from December, continues to be a driving factor for both the manufacturing economy and the overall economy and indicates employers remain positive about the second half of 2023.
This means economic activity in the manufacturing industry is likely to continue to cool through Q1 into Q2 of 2023 as inflation remains a key issue. The contractions in both New Orders and Production signal a continued weak supply component for the freight industry. On a more positive note, both the Customer Inventories and Backlog of Orders subindexes showed signs of recovery in January. While both remain in strong contraction territory currently, shrinking inventory levels and a decrease in backlogs bode well for future production growth.
Macro Impacts
- Jobs continued to remain strong per the Bureau of Labor Statistics’ (BLS) January jobs report.
- Despite sweeping layoffs across the technology and financial sectors, unemployment fell in January to 3.4%, hitting the lowest level since May 1969.
- Total nonfarm payroll added 517,000 jobs in January. Transportation and warehouse payroll added 23,000 jobs, matching its monthly average in 2022.
- China rolled back its Zero COVID policy and reopened most of its economy ahead of the holidays in December, leaving little time to get operations back to pre-pandemic levels ahead of Lunar New Year celebrations.
- The Lunar New Year is widely celebrated in China each year in January, resulting in a significant slowdown in production from its manufacturing plants.
- The impact of the delays is typically felt from the first week of January until the second or third week of February when workers have returned and operations are able to return to normal levels.
- China is the second largest importer in the world so the onset of consumption with its economy fully reopened has yet to make ripples across the supply chain.
- The Consumer Price Index (CPI) rose 0.5% MoM seasonally adjusted in January across all items after rising 0.1% in December. Core CPI, which excludes food and energy, increased 0.4% on a monthly basis, up from 0.3% the previous month.
- On an annual basis, the CPI increased 6.4% in January. This is higher than the 6.2% most economists expected, however it is the smallest monthly increase since October 2021.
- The latest report indicates inflation is not going away quietly, and the Feds “disinflation process” still has a long way to go to get to the central bank's 2% goal.
- The services sector continues to be a major driver for core inflation as shelter was by far the largest contributor to January’s CPI increase. Across the goods sector, apparel and used vehicles saw significant price increases.
- Expensive energy prices kept headline CPI high with gas prices increasing 2.0% MoM and natural gas increasing 6.7% MoM.
Industry Overview
January Key Figures YoY
| Truck Data Points | YoY % Change |
| DAT Spot Rates (incl. FSC) | -20.9 |
| Fuel Prices | +22.9 |
| ACT Class 8 Preliminary Orders | -13.3 |
| ATA NSTA Truck Tonnage | -1.3 |
| Cass Freight Expenditures | +1.7 |
| Cass Freight Shipments | +4.3 |
Spot Rates
Key Points
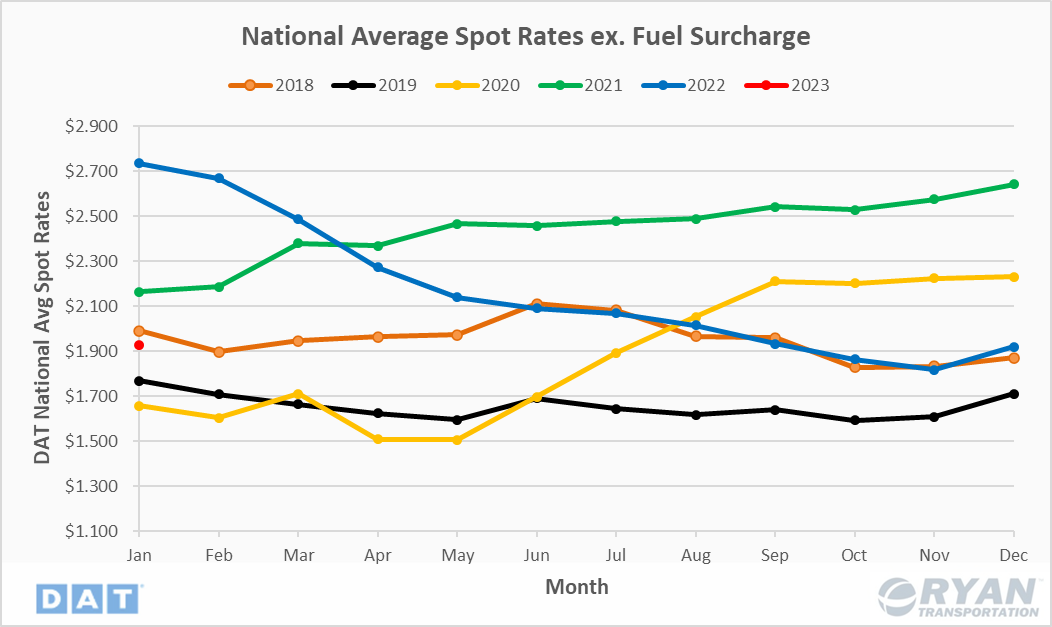
- National spot rates excl. fuel surcharge declined 29.5% YoY in January and remained 4.4% below the 5-year average.
- Spot rates excl. fuel surcharge increased for the second consecutive month in January, finishing 0.43% above December.
Summary
The elevated spot rates across dry van and refrigerated markets, caused by trucking capacity constraints and an arctic cold front that swept across the country in the final two weeks of 2022, have cooled down considerably and fallen in line with typical seasonality for this time of year. According to FTR, who primarily utilizes Truckstop’s system for analyzing prices, refrigerated spot rates have performed the worst so far in 2023, falling $0.75 in the first four weeks of the year after surging more than $0.67 in the final two weeks of 2022. In a similar fashion, dry van spot rates saw a $0.24 spike during the final two weeks of 2022 only to be down $0.34 by the fourth week of 2023. Following normal trends, national spot rates excl. fuel typically see their first increase after the first few weeks in February in part due to the end of Lunar New Year celebrations in China. While moderate increases are expected for a week or two, the market will most likely return to its cooling trend in the back half of the month.
Truckload Demand
Key Points
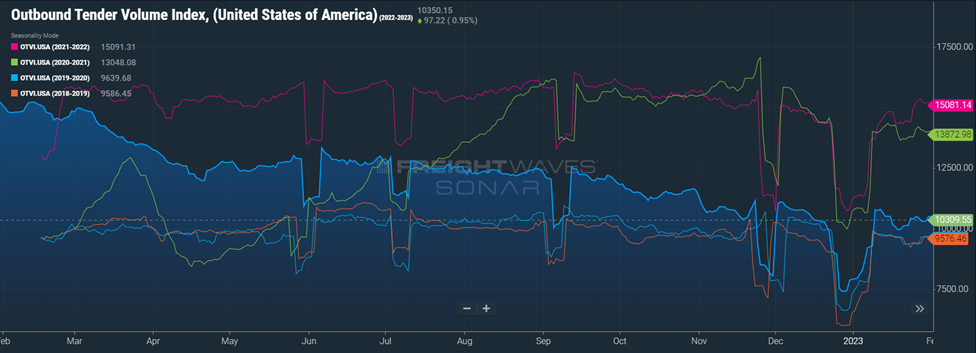
- The Freightwaves Outbound Tender Volume Index (OTVI), which measures contract tender volumes across all modes, fell 30.5% YoY in January and remained 9.2% below the 5-year average. On a monthly basis, the OTVI saw a 6.1% increase from December to January.
- The Cass Freight Index, which analyzes the number of freight shipments in North America and the total dollar value spent on freight shipments, reported increases in January YoY levels for both Shipments and Expenditures of 4.3% and 1.7% respectively.
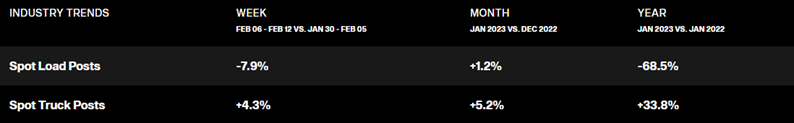
- Spot Market volumes were down 68.5% YoY in January according to DAT. MoM volumes increased sequentially, however, from December to January, remaining in line with typical seasonality.
Summary
Spot market volumes continue to see little relief, as they were in line with normal seasonal trends in January. The surge in the first few weeks of January was likely a factor of reduced capacity from the holidays rather than a significant increase in demand. These constraints paired with December's muted retail peak season and significant weather events provides further explanation for the MoM increase as reported by DAT. Most notably, the YoY decline paints a clearer picture for the current demand environment. While demand levels were at record highs in January 2022, the 68.5% drop in volumes is considerably higher than anything we’ve seen before.
Truckload Supply
Key Points
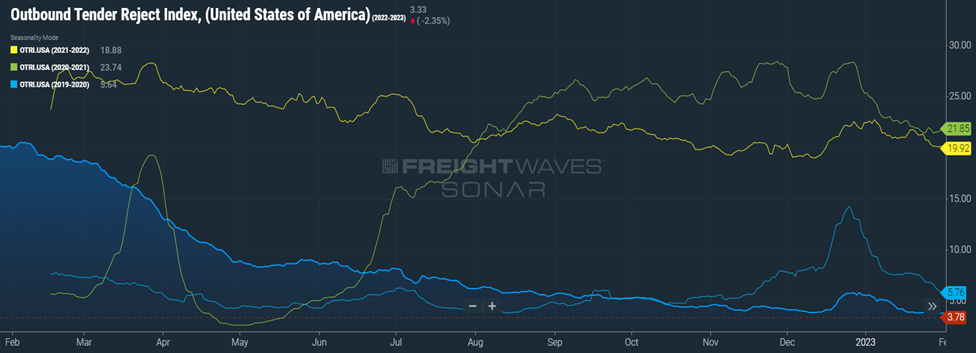
- The Freightwaves Outbound Tender Rejection Index (OTRI), which measures the amount of loads rejected by carriers that are under contract, was down 81.0% YoY in January and 34.4% below pre-pandemic levels.
- The Morgan Stanley Truckload Freight Index (MSTLFI) underperformed seasonally and increased sequentially between December and January. It currently sits below the long-term averages after initially dropping below mid-August.
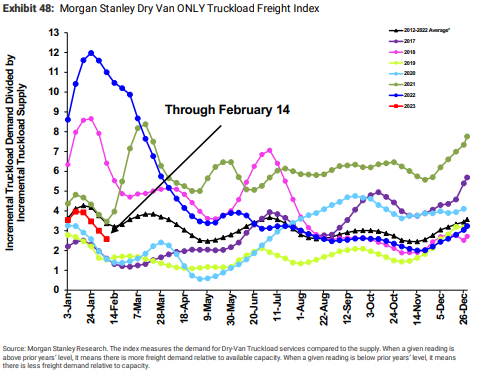
Summary
Current truckload capacity is abundant against the backdrop of softening demand. Rejection rates have hit record lows as brokers and carriers work to protect current awarded contract volumes. Following seasonal trends, Q1 is generally the softest time of the year in terms of demand. However, the already weakening demand component coming into the year is allowing shippers to enjoy competitive pricing and increased routing guide compliance. According to FTR, active truck utilization, which measures the percentage of active trucks required to move U.S. truck freight, registered a new low point in Q4 of 2022 at 87%. This is well below the 10-year average of 91%, according to FTR, and in line with the trough seen in the last industry recession in 2019. However, current market conditions are still showing signs of deterioration, so it is our consensus that we have yet to hit the bottom and will likely see utilization further weaken through Q2 of 2023.
Truckload Capacity Outlook
Key Points
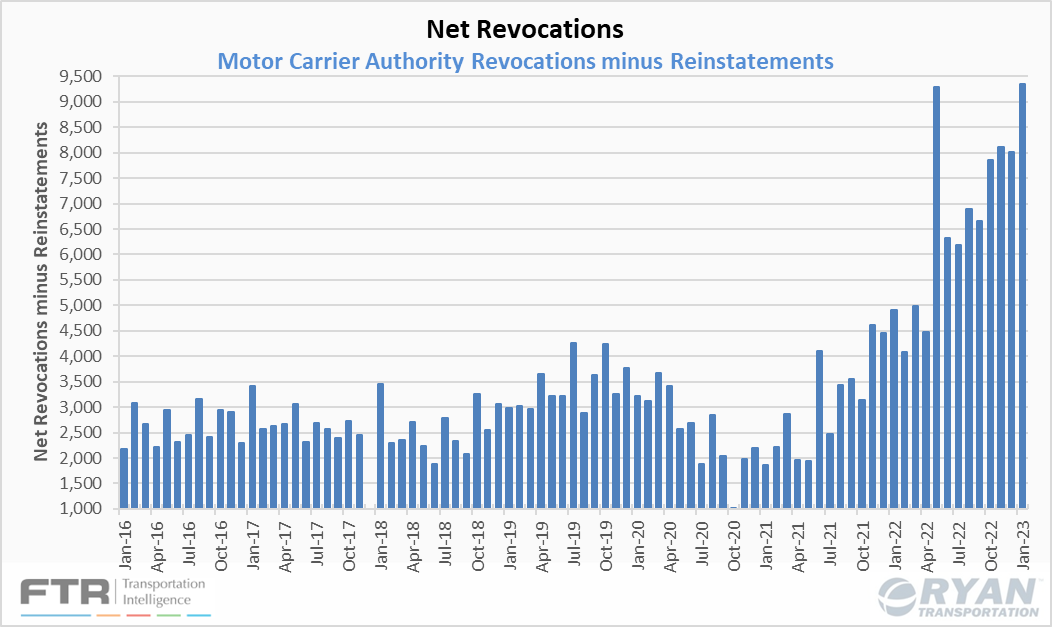
- FTR's preliminary analysis of the Federal Motor Carrier Safety Administration (FMCSA) data indicates net revocations, which are revocations of operating authority minus reinstatements, registered a record high of 9,350 carriers in January.
- New entrants, which are newly authorized for-hire trucking companies, continued to ease down in January, dropping 1.2% from December's reading to 5,886.
- Class 8 preliminary orders fell in January for the fourth consecutive month to 21,600 units, roughly a 21% decline MoM but up 2% YoY according to ACT Research.
Summary
The net drop in the for-hire trucking company population set a new record in January as Net Revocations exceeded new carriers by 3,464. The previous records were set in November (1,587) and December (2,062) of last year, indicating capacity is starting to leave the market at exponential rates and is likely to continue doing so until the next market correction. The last time there was a sequential decline in the for-hire trucking population was in 2019 from September through December as rates bottomed out. Since January of 2020, however, the net for-hire trucking population has increased by 235% with consecutive monthly increases, except in May of last year when there was a large shift of drivers moving under the umbrella of larger asset carriers.
Fuel Prices
Key Points
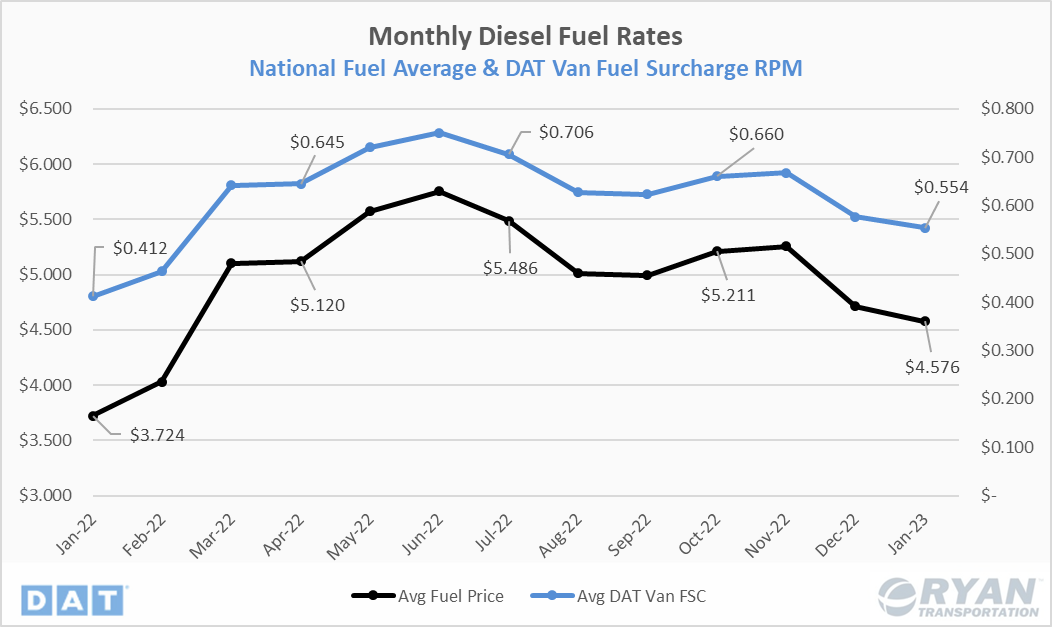
- Fuel prices in January saw a second consecutive month of declines, ending 2.9% below December's average.
- Prices are still elevated significantly from a year ago, registering 22.9% above YoY levels and 33.3% above the 5-year average.
- Current U.S. stockpiles are 8% above the 5-year average while the refinery utilization rate dropped 1.4% from December to 86.5%.
Summary
Despite a slight uptick in the first week of the year, fuel prices saw consistent weekly declines beginning in November through the second week of January before increasing $0.10/gallon the final two weeks of the month. The price declines can mostly be attributed to the increase in stockpiles and decrease of refinery utilization. Another major component factoring into the decline is the warmer-than-normal seasonal temperatures that have greatly reduced natural gas consumption, which is refined from the same distillate as diesel. While the near-term outlook reflects an easing in prices, there are still factors to consider that could significantly reduce the global supply. The reopening of China’s economy will be a major area of focus in the next few months for future gas prices. According to experts who analyzed the data, including international flight bookings, there has been a significant boom in Chinese travel demand that would account for 1.4 million barrels this year alone. Saudi Arabia has already increased its prices on fuel exports to China, signaling future increases are in store. OPEC+ cut its production schedule for 2023 and is currently producing one million barrels short of its target. They are not likely to make any revisions ahead of their next meeting in June this year.
Dry Van Overview
Spot Rates
Key Points
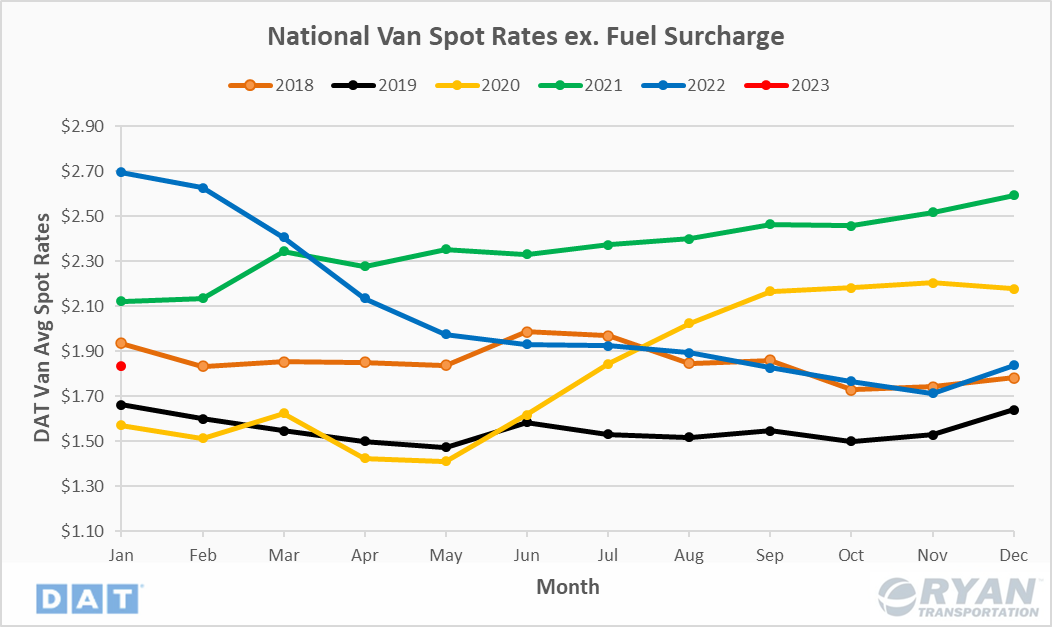
- Dry van spot rates excl. fuel surcharge declined 32% YoY in January and sit 4.8% below the 5-year average.
Load-to-Truck Ratio
Key Points
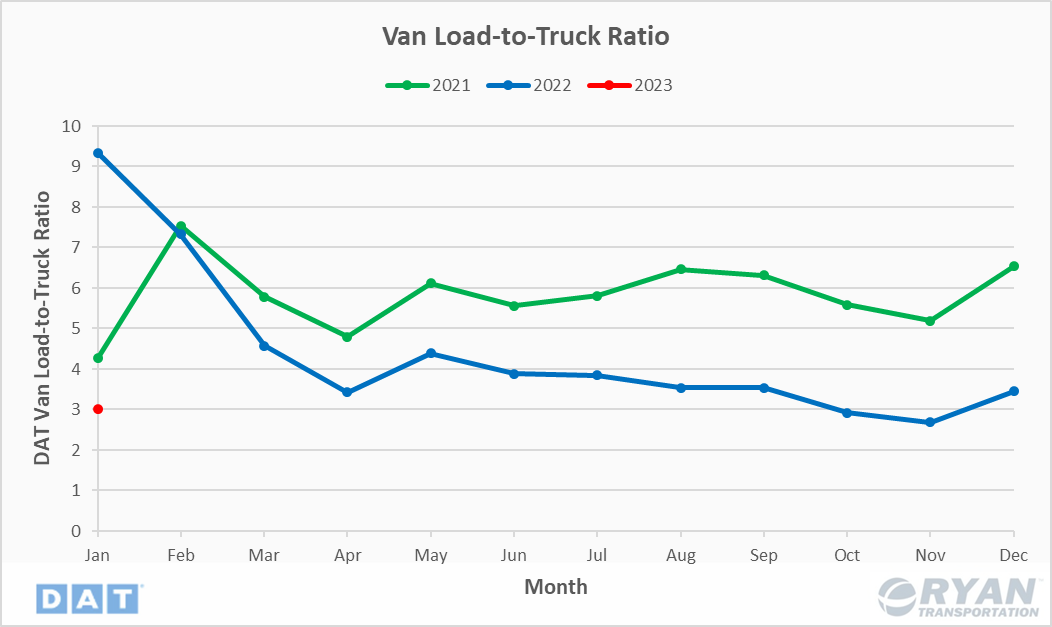
- The dry van load-to-truck ratio declined 68% YoY in January.
Market Conditions
Dry Van Summary
As mentioned previously, dry van spot rates excl. fuel performed the worst of all three modes in January on a 12-month basis. Van rates saw little MoM change, ending the month down just 0.12% from December.
Reefer Overview
Spot Rates
Key Points
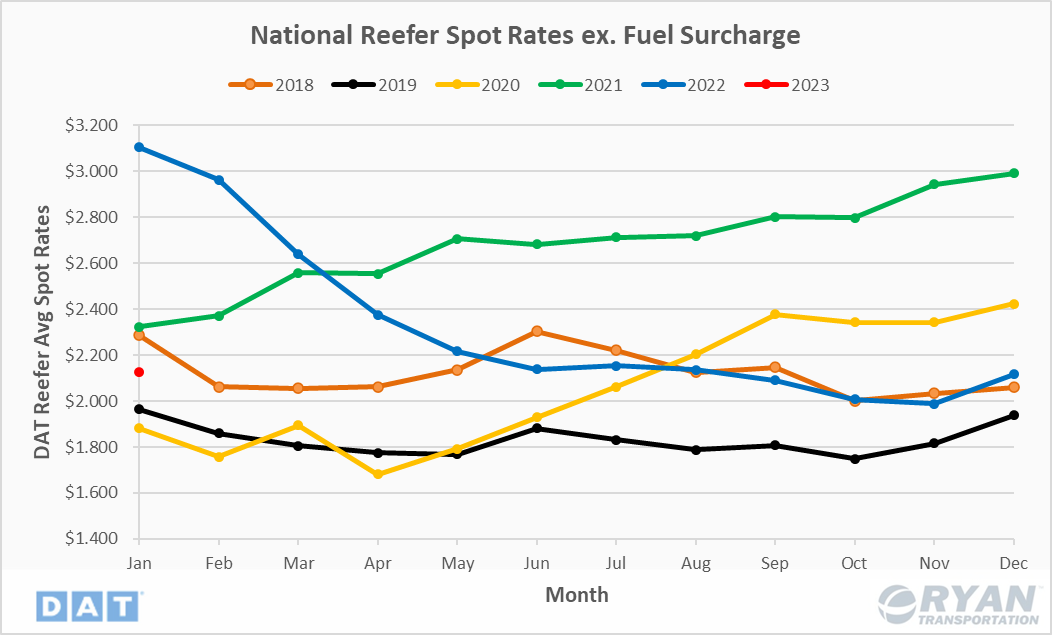
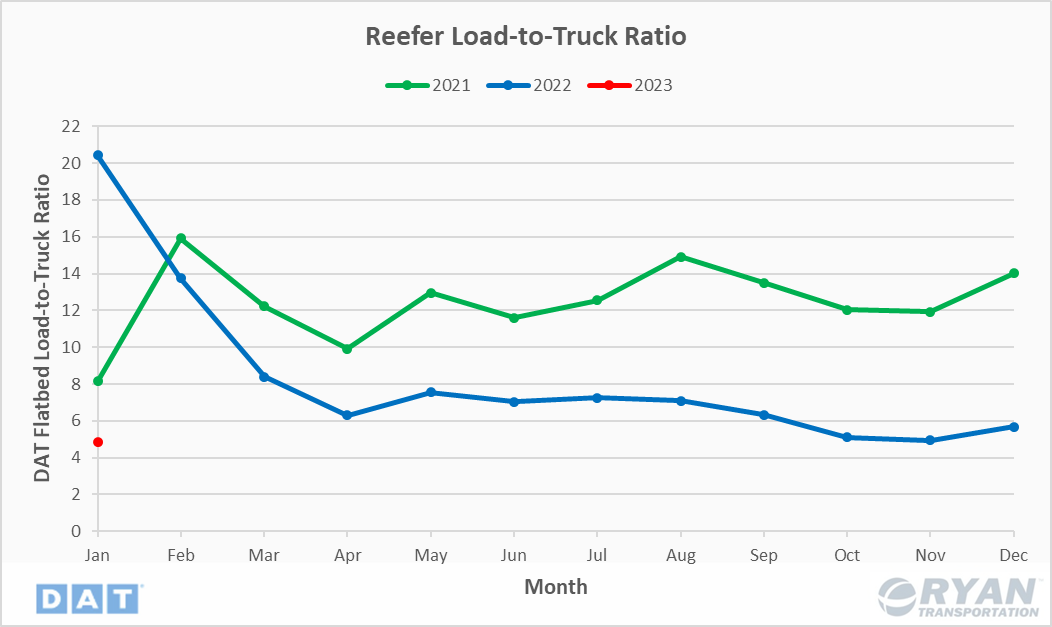
- Reefer spot rates excl. fuel surcharge decreased 31.6% in January, down 3.55% from the 5-year average.
Load-to-Truck Ratio
Key Points
- The reefer load-to-truck ratio fell 76.2% YoY in January.
Market Conditions
Reefer Summary
Reefer spot rates excl. fuel surcharge followed a similar trend as dry van rates and were in line with normal seasonality. The surge in refrigerated rates in the last two weeks of 2022 was a result of a transition by customers to protect their product, normally suited for a dry van, from the arctic temperatures. As temperatures have remained relatively warmer than seasonal averages, the need to utilize an insulated trailer has been non-existent, further pushing rates down.
Flatbed Overview
Spot Rates
Key Points
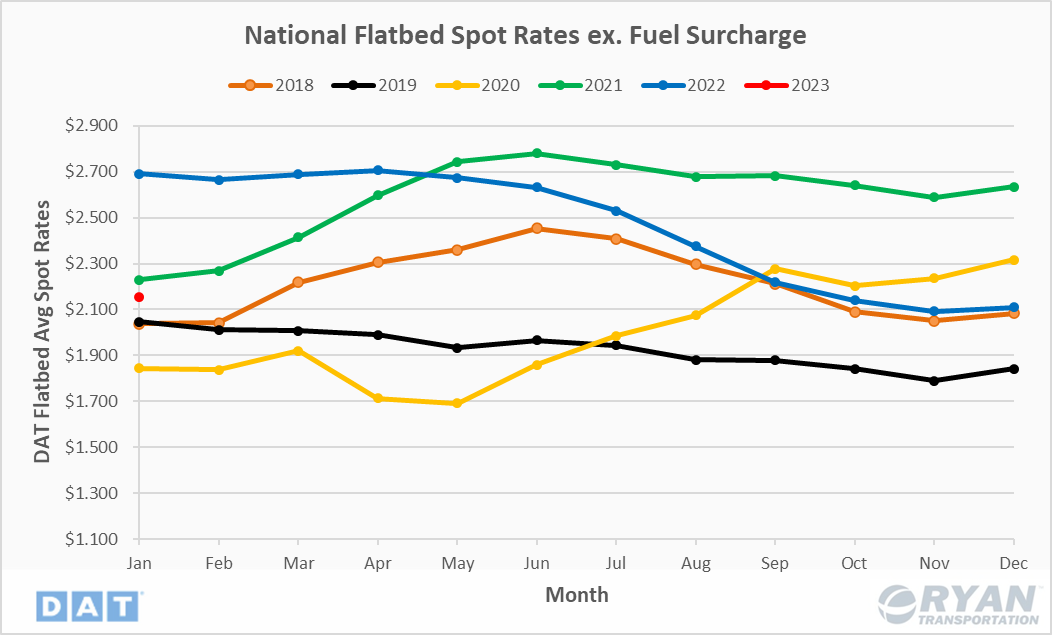
- Flatbed spot rates excl. fuel surcharge decreased 19.9% YoY in January and sit 3.57% below the 5-year average.
Load-to-Truck Ratio
Key Points
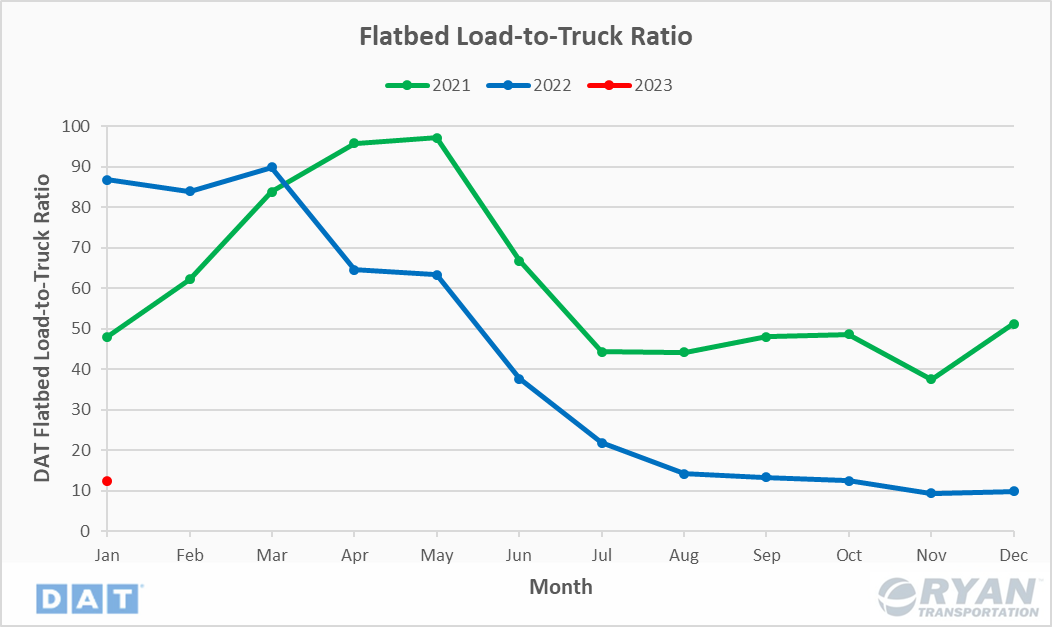
- The flatbed load-to-truck ratio declined 85.7% YoY in January.
Market Conditions
Flatbed Summary
Flatbed spot rates excl. fuel surcharge performed the best of the three major modes, which is to be expected as its typical peak season does not ramp up for another few months. However, on a YoY basis, flatbed volume has suffered the most despite prolonging its exposure to the weakening demand that started for van and refrigerated truckload in February of last year. The Infrastructure Bill that was passed last year by the administration should start to have some impacts on construction volume as states start to focus on building and repairing major highways, bridges and manufacturing facilities.
Further Reading
- Logistics Management: January retail sales data is solid to kick off 2023
- FreightWaves: American Shipper: January imports up from December, but February is looking weak
- FreightWaves: Class 8 truck orders take a timeout in January