
Executive Summary
As the first quarter came to a close, there was little change for better or worse in the transportation industry. The same cannot entirely be said for the overall economy, as much of the recent data appeared more positive than in months prior. Like the past several updates, signs of positive indicators continue to exist within the data, but none have yet manifested into truly impactful change.
News surrounding the economy appeared more positive at the end of the quarter. Payroll employment rose by 303,000 in March, including an additional 22,000 jobs in revisions from January and February labor data, while the unemployment rate decreased to 3.8%. Final estimates to Q4 2023 U.S. GDP were revised upward by 0.2% from initial estimates to 3.4%, topping the 3.2% consensus but falling short of the exceptionally high 4.9% registered in Q3 2023. The stronger growth came from upward revisions to consumer spending in services, business investment and government spending. Finally, manufacturing activity expanded in March after 16 months of contraction driven by an increase in new orders.
In the transportation industry, excess truckload capacity muted moderate demand improvements compared to seasonality, keeping the market bouncing along the bottom. While supply levels remain sticky, there are signs that contraction is underway and is slowly bringing the equation back into balance. In the intermodal sector, a positive trend in overall volumes continues to be undercut by declining rates in an attempt to remain competitive with the truckload industry.
The near-term outlook remains mostly unchanged as seasonality typically suggests a slower month in April before summer shipping kicks off and the first major capacity disrupting holiday takes place in May. The exceptions in the outlook revolve around volatility in the flatbed sector, due to construction activity ramping up and the reefer industry’s exposure to a potentially disruptive produce season.
Industry Overview
March Key Figures (YoY)
| Truck Data Points | YoY% Change |
| DAT Spot Rates (incl. FSC) | -7.2 q |
| Fuel Prices | -4.5 q |
| ACT Class 8 Preliminary Orders | 8.7 q |
| ATA NSA Truck Tonnage* | 2.3 p |
| Cass Freight Index | -4.7 q |
| Cass Freight Expenditures | -18.5 q |
| Cass Freight Shipments | -3.6 q |
*Report released 3/19/24
Main Takeaways
- Economy: Manufacturing activity returned to expansion driven by new orders and production and remains accommodating of future growth.
- Truckload Rates: Excess capacity continues to pull truckload rates down though upcoming busy seasons are offering a glimmer of hope.
- Truckload Demand: Contract demand was surprisingly strong in Q1, driven by surges in imports and inventory destocking while spot market deterioration continues to present challenges for smaller carriers.
- Truckload Supply: Truckload markets remain sluggish from persistent oversaturation of capacity, but there are signs that supply is finally starting to contract.
- Truckload Capacity Outlook: The number of trucking companies increased in March after several months of declines, but it might be a false dawn due to carriers misreading market signals.
- Fuel: Diesel prices took a breather in March, finding a balance after recent volatility, though some experts predict a rise due to refinery attacks and production cuts, the market remains stable for now.
OTR By Mode
- Dry Van: Despite a rise in van volumes, rates continued to fall across the sector.
- Reefer: With early produce volumes ramping up, both reefer volumes and rates ticked up slightly in March.
- Flatbed: The flatbed sector registered the most improvement in March across all major modes with construction related activity driving the sector.
- Intermodal: Rail freight was a mixed bag in March with intermodal volumes up due to strong consumer spending, but overall carloads down and intermodal rates struggling to compete with cheaper truckload market.
Economy
United States ISM Manufacturing PMI

Key Points
- The Institute for Supply Management’s (ISM) Manufacturing PMI® registered 50.3% in March, a 2.5% increase from February’s reading of 47.8%, and moved into expansion territory.
- The New Orders Index was 2.2% higher in March than in February, increasing from 49.2% to 51.4%.
- The Production Index registered 54.6% in March, 6.2% higher than February’s reading of 48.4%.
- The Employment Index was up 1.5% in March to 47.4% from 45.9% in February.
- The Customers’ Inventories Index continued to contract in March, dropping 1.8% from 45.8% in February to 44.0% as levels move further into ‘too low’ territory.
Summary
After 16 consecutive months of contraction, the ISM Manufacturing PMI® returned to expansion territory in March with its reading just above the 50.0% breakeven line. In terms of the overall economy, March marked the 47th month of expansion after one month of contraction recorded in April 2020. According to data from March’s PMI® reading, demand is in the early stages of recovery with clear signs of improvement while production execution surged, and inputs remain accommodating of future growth. Per ISM’s reporting, March’s reading corresponds to a positive change of 2.2% in real gross domestic product (GDP) based on the past relationship between the Manufacturing PMI® and the overall economy.
Improvements in the demand components of the manufacturing index were primarily reflected in the growth in new orders, as the New Orders Index returned to expansion territory. The expansion of New Orders in March is just the third time the subindex has registered in expansion in 22 months, as the number of survey panelists’ comments regarding ‘softening’ has fallen. Meanwhile, Customers’ Inventories contracted at a faster rate for the fourth consecutive month in March, moving further into ‘too low’ territory. According to the ISM report, panelists reported continued shortages of products in companies’ customer inventories, which is considered a positive for future new order and production growth.
The output components of the diffusion index, measured by the Production and Employment indices, surged in March, combining for a 7.7% upward impact on the Manufacturing PMI® calculation. The rally in outputs was primarily driven by a MoM increase in production levels that led to the Production Index recording its highest level since June 2022. Employment levels continued to contract but at a slower rate than February following the 1.5% increase registered by the Employment Index in March. Per ISM’s reporting, panelists’ comments in March were split between companies adding and reducing head counts. Much of the headcount reductions in March continue to come in the form of sizeable layoff activity.
The input components of the Manufacturing PMI®, primarily measured by the Prices and Supplier Deliveries, showed signs of tightening in March but continued to accommodate future demand growth. The Prices Index registered a 3.3% increase in March to 55.8% and remained in ‘increasing’ territory. The further expansion in prices recorded by the subindex is the third consecutive month of increases, and raw material costs remain unstable. The Supplier Deliveries Index dropped slightly, down 0.2% from February and moving further into ‘faster’ territory. Though suppliers continue to have capacity, panelists’ comments indicated signs of struggle due to issues in raw material supply chains.
Of the six biggest manufacturing industries; Chemical Products; Transportation Equipment; Food, Beverage & Tobacco Products; Computer & Electronic Products; Machinery and Fabricated Metal Products; four (Food, Beverage, & Tobacco Products; Fabricated Metal Products; Chemical Products; and Transportation Equipment) registered growth in March, which account for a combined 54% of manufacturing GDP.
Why it Matters
March’s Manufacturing PMI® reading provided much needed confirmation that the manufacturing sector was climbing out of the trough it fell into between August and December of last year. Timothy Fiore, Chair of the ISM’s Manufacturing Business Survey Committee, noted that the manufacturing sector is in a moderate growth cycle so the return to consistent overall expansion will be slow, but that the 2024 forecasts continue to look very bullish.
Much of the optimism about the future outlook for manufacturing activity stems from the growth in both new orders and production in March. According to Fiore, new orders in March were solid despite seasonality headwinds with much of the support coming from continued growth in new export orders, driven by strength from Europe and China. While the Production Index gave the PMI® its largest boost in March, much of the index’s resiliency is likely a result of the backlogs being worked off from the coronavirus pandemic-inspired over-ordering. However, continued expansion in new orders should give way for order backlogs to turn positive, influencing production levels down the road.
With new orders and production both registering growth, employment levels are likely to follow. According to Fiore, labor in the manufacturing sector has remained at a 1:5 hire-to-fire ratio over the last five months but appeared closer to a 1:1 ratio in March based on survey responses. Headcount reductions in March were primarily through layoffs, accounting for 75% of labor declines while attrition and freezes accounted for the other 25%. While layoffs remain elevated as companies continue to work towards right-sizing staff, the shift in the ratio between adding and reducing employment levels in March indicates those layoff numbers should subside in the coming months.
Although the most recent PMI® report was overall generally optimistic, there remain potential obstacles and anxiety looming that could hinder the recent positive momentum in the manufacturing sector. The main concern revolves around future Federal Reserve policy and persistent inflation in commodity prices. The continued rise in raw material costs is creating supply challenges for many suppliers, according to survey comments. March’s Prices Index reading represented the only negative number from the report, with the subindex reaching its highest level in 20 months at 55.8%. In terms of Fed policy, there are still expectations amongst futures traders of multiple rate cuts before the end of the year. However, if the Fed were to pivot and raise rates in June, when the first cut is expected, it would create significant headwinds across the sector.
Macro Economy
- Nonfarm payroll employment rose by 303,000 jobs in March on a seasonally adjusted basis, exceeding the +212,000 consensus and accelerating from the adjusted +270,000 in February following upward revisions to both January and February employment numbers, according to the most recent jobs report released by the Bureau of Labor Services (BLS).
- The employment rate eased down slightly from 3.9% in February to 3.8% in March.
- Total Transportation and Warehousing jobs rose slightly by just 1,200 jobs as the increase in Truck Transportation employment offset declines in Warehousing jobs.
- Truck Transportation added 5,100 jobs in March.
- Warehousing and Storage employment declined by 5,500 jobs.
- Both headline and core Personal Consumption Expenditures (PCE) Price Index, the Fed’s preferred gauge for measuring inflation, increased MoM in February by 0.3% on a seasonally adjusted basis, according to the most recent report from the Bureau of Economic Analysis (BEA).
- On an annual basis, headline PCE rose 2.5% in March on a seasonally adjusted basis, a 0.1% increase from January.
- Core PCE, which excludes both food and energy, rose 2.8% in February on a 12-month basis seasonally adjusted, 0.1% lower MoM after January’s reading was revised upward.
- Both the headline and core Consumer Price Index (CPI) rose 0.4% MoM in March on a seasonally adjusted basis and remain unchanged from February, according to the most recent report from the BLS.
- Headline CPI rose 3.5% in March on an annual basis, slightly higher than the 3.2% increase registered in February.
- Core CPI also registered a 3.5% increase for the 12 months ending in March, dropping 0.3% from February’s reading of 3.8%.
Truckload Rates
Spot Rates
Key Points
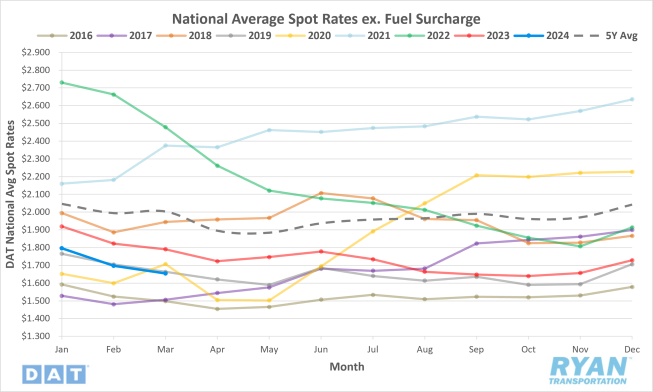
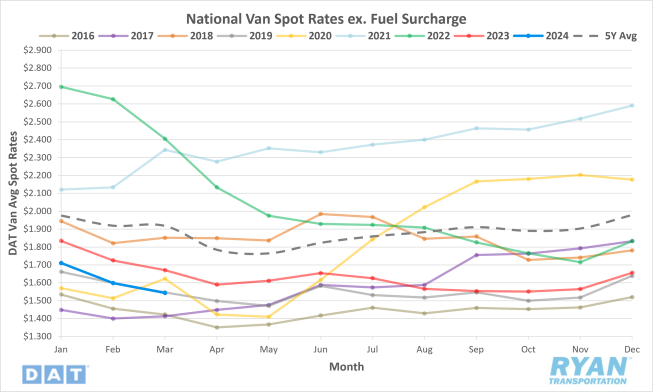
- The national average spot rate, excluding a fuel surcharge, declined further in March, dropping 2.5% MoM, or $0.042.
- The average spot linehaul rate in March was down 7.6%, or $0.136, compared to the same time in 2023 and sits 17.4% below the 5-year average.
Contract Rates
Key Points
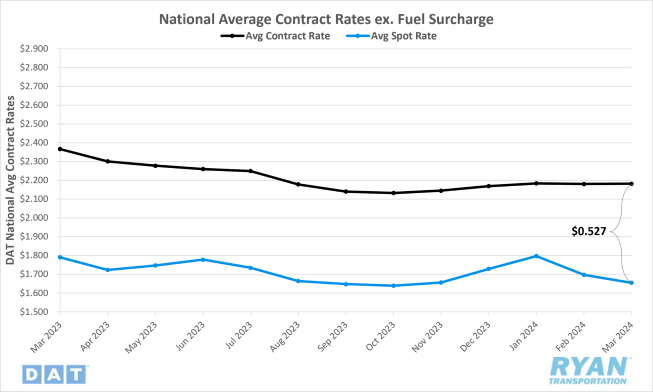
- Initially reported average contract rates not inclusive of fuel were essentially flat in March, increasing by just 0.001% MoM.
- Compared to March 2023, average contract linehaul rates this year were down 7.8%, or $0.185.
- The contract-to-spot spread widened further in March, increasing just over $0.044 MoM from $0.484 in February to $0.527.
Summary
Average linehaul rates declined further in March as the market continued to deal with excess capacity amidst soft first quarter demand. Similar to last year, average linehaul rates have continued to trend in line with the oversaturated market of 2019, with the exception of weather-related boost in January. The $0.042 drop in average spot linehaul rates in March underperformed typical seasonality and matched the decline recorded during the same time period in 2019. Compared to the pre-pandemic average, spot rates generally increased just under $0.02 between February and March, with that average moving just over $0.02 since 2020.
Following a strong correction in February, which saw average spot rates drop weekly to end the month roughly $0.13 below where they started, the DAT 7-day average linehaul spot rate index remained virtually unchanged throughout much of March. After dropping by just over a penny in the first week of the month from where they closed out February, the 7-day running average hovered around $1.65 through the first three weeks of the month. Driven by a slight bump across van and flatbed markets, the DAT 7-day average linehaul registered a $0.03 increase WoW heading into the final week of March.
Within the contract market, average rates excluding fuel have stayed relatively consistent throughout the first quarter. Since average contract linehaul rates increased by just over $0.01 in January, they have fluctuated by a fraction of a percent between February and March despite continued negative pressure from the spot market. With spot rates declining further and contract rates holding firm, the contract-to-spot spread widened in March, moving further away from the pre-pandemic average of $0.35-$0.45. The elevated spread against the pre-pandemic norm continues to imply that there is still room for contract rates to come down or for spot rates to come up.
Why It Matters
March is generally considered to be a transitionary month. Not just in terms of the weather, but within the truckload industry as well. Driven by construction materials and home and gardening supplies for big-box retailers, volumes start to pick up in early spring. Though the uptick in activity is nothing dramatic, capacity shows signs of tightening under normal conditions, adding pressure on rates. With demand levels trending above the previous year’s levels, the MoM decline in average spot rates in March continues to be a product of excess capacity in the market.
With the start of the produce season and peak construction shipping just around the corner, spot rates are likely to gain some positive momentum in the coming weeks. While it’s expected that the degree of impact to rates from this year’s produce season and construction shipping are to be more significant than the past few years, it will continue to be a muted version of the pre-pandemic norm as long as excess capacity remains.
Meanwhile, the consistency of contract market rates through the first quarter was anticipated as the previous annual contract cycle comes to an end. With the RFP bid season now in the past, the implementation of routing guides and new annual contract rates are set to start in April and May across much of the industry. As spot rates remain at historically low levels, shippers continued to hold much of the pricing power through the last round of contract negotiations. Once new contracts and routing guides go into effect in the coming months, average contract rates will probably resume their negative trend and potentially narrowing the gap between contract and spot rates.
Truckload Demand
Key Points
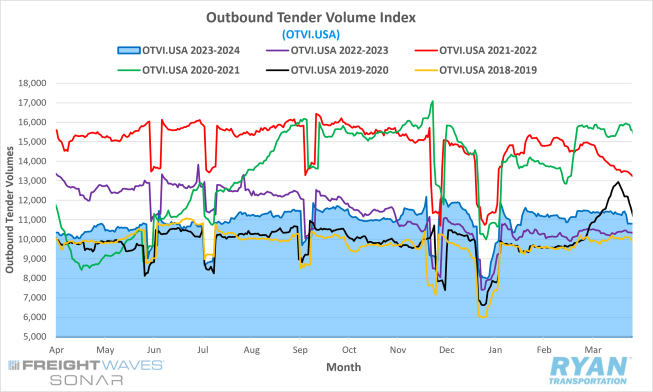
- The FreightWaves SONAR Outbound Tender Volume Index (OTVI.USA), a measure of contracted tender volumes across all modes, closed out March 6.0% below the levels 30 days prior at the start of the month.
- The 29-day monthly average of daily tender volumes recorded by the index in March was 1.6% higher than February’s average, increasing from 11,186.87 to 11,361.91.
- Compared to the same time last year, average daily tender volumes were up 9.0% but registered 8.4% below the 5-year average.
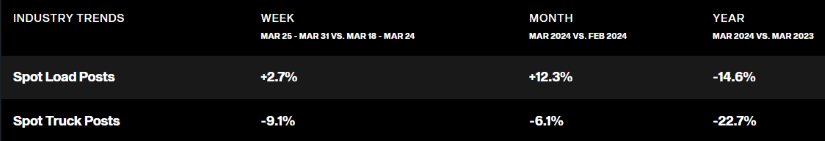
- After falling considerably MoM in February, spot volumes gained traction in March, increasing 12.3% MoM but remained well below 2023 levels.
- The Cass Freight Index Report, which analyzes the number of freight shipments in North America and the total dollar value spent on those shipments, decreased in March on a monthly basis for shipments by 0.2% and increased for expenditures by 0.1%. Both, however, remain below YoY levels by 3.6% and 18.5%, respectively.
Demand remained relatively stable in March as freight volumes posted a second consecutive month of growth to close out the first quarter. Since February 2023, MoM comparisons of tender volumes have steadily improved with average OTVI values rising just over 11% during that time frame. This growth has also made YoY comparisons more favorable, with volumes rising above the previous year’s levels in November of last year and have remained elevated through March. As we have noted in previous updates, a positive YoY comparison in freight volumes is one of the strongest signs of a market recovery.
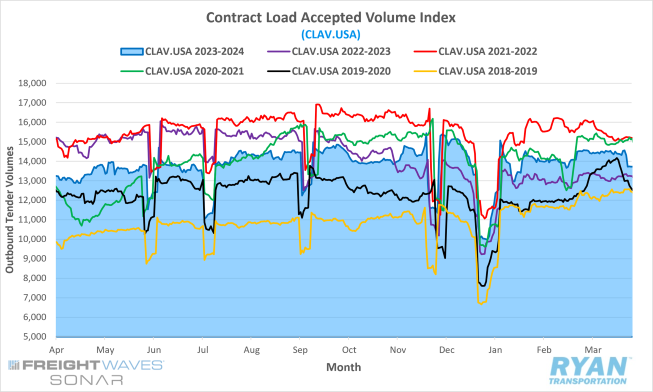
The FreightWaves SONAR Contract Load Accepted Volume Index (CLAV.USA), shown below, which is similar to the OTVI but removes tender rejections, registered a 2.3% increase MoM and is up 8.7% YoY, further highlighting the strength and stability of demand in March.
Although Q1 is typically the softest point of the year for demand, much of the resiliency in volumes observed through March can be linked to the end of the current destocking cycle and the drastic rise in imports in January and February. According to Descartes’ Global Shipping Report, U.S. imports registered a significant pull forward of demand ahead of the Chinese Lunar New Year not seen since the consumer-driven pandemic boom in 2021 and 2022. Per Descartes’ reporting, imports from China represented 39.8% and 37.8% of total U.S. imports in January and February, falling just shy of the 41.5% record high observed in February 2022.
Breaking down freight volumes by their average length of haul provides further context into the resiliency of Q1 demand. According to FreightWaves SONAR, both long-haul (greater than 800 miles) and local (less than 100 miles) load volumes have registered a considerable growth of 15% and 25% respectively, over the last few months. The significance in these two mileage bands correlates pretty closely with import activity and inventory management. Local deliveries tend to occur at either end of the supply chain, while long-haul deliveries are generally associated with replenishment.
Why It Matters
The growth in volumes in Q1 is a promising sign in terms of the timeline for a market recovery. It’s also further proof that demand alone cannot pull the market up from the bottom of the current cycle.
Given the current state of the industry, it’s important to note that the absolute value is not as important as the direction of the trend in freight volumes. This will be especially crucial heading into April with typical seasonality suggesting a relatively sharp decline in the front half of the month. as it has in five of the last six years. Should the stability in volumes hold through most of April and break the cycle, or at least outperform seasonality, it should set the stage for a strong summer.
Any positive momentum demand can hold heading into produce season and the uptick in beverage shipping should ultimately bode well for spot market participants. With contracted volumes still dominating the landscape, smaller carriers with elevated exposure to the spot market continue to face significant financial strain, especially as the price of fuel remains high. The MoM growth in March in spot market freight is a step in the right direction. However, annual comparisons are still down by double digits. Smaller fleets are likely to continue facing significant negative pressure until spot market volumes turn positive on a YoY basis.
Truckload Supply
Key Points
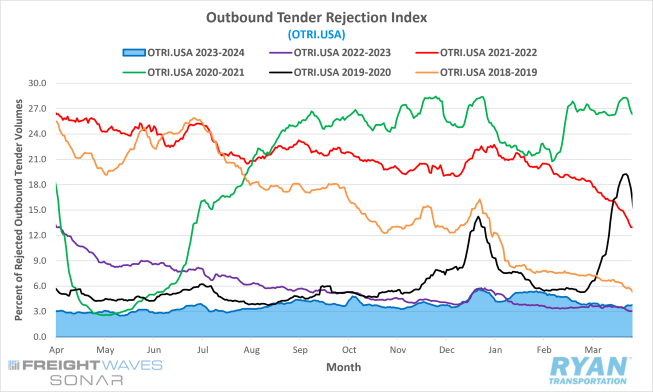
- The FreightWaves SONAR Outbound Tender Volume Index (OTRI.USA), a measure of relative capacity based on carriers’ willingness to accept freight volumes under contract reflected as a percentage, ended March at 3.7%, 13 basis points (bps) below where the index started the month.
- Tender rejections averaged 3.74% in March, almost a full percentage point below February’s average of 4.70%.
- Compared to the same month last year, average tender rejections were slightly higher by 0.2% but sit 9.4% below the 5-year average.
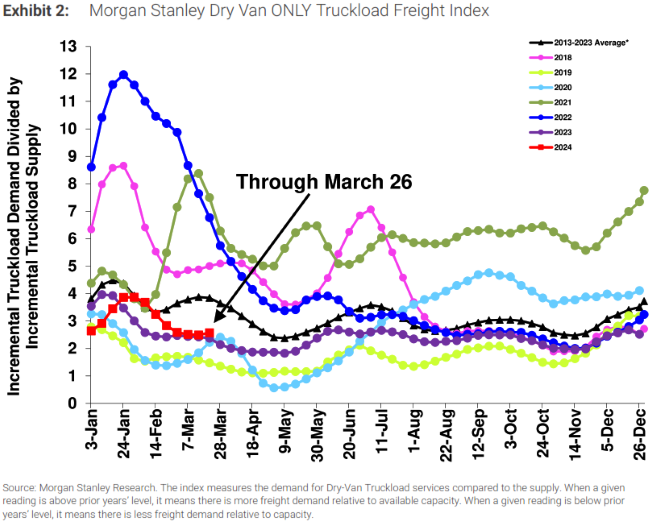
- The Morgan Stanley Truckload Freight Index (MSTLFI), which measures the demand for dry van truckload services compared to supply, continued its decline and underperformed seasonality in the front half of the month before reversing course in the back half of March, registering sequential increases and outperforming seasonality.
Summary
Excess supply continues to keep the market in a depressed state as conditions showed little change in March. The correction from January’s capacity crunch, which initially began in February and pulled rejection rates below 4% towards the end of the month, extended its negative trend well into March. According to the OTRI, rejection rates declined steadily through the first three weeks of the month, dropping 47 basis points to its lowest point of 3.39% by the start of the final week. With the help of end of month and end of quarter demand activity, tender rejections bounced back 0.34% to end the month at 3.78%.
March marks the third consecutive month that average tender rejections for the month have registered above the previous year’s levels. Though the YoY increase in rejection rates registered in March is only a few tenths of a percent, the direction of the index is what’s important, not the absolute value. Annual comparisons of OTRI values have steadily improved since January 2023. With those comparisons turning positive and remaining that way over the last three months, it indicates a floor has seemingly been reached as supply continues to correct.
The most recent report from Morgan Stanley provides additional support that the imbalance of supply compared to demand has likely found a floor. Following the sharp, sequential decline registered by the MSTLFI in February, the index flattened out in March due to a strong underperformance in the supply component. Although the freight index is still below the long-term average, it remains above the previous year’s levels indicating that supply levels are falling.
Why It Matters
Rejection rates remaining slightly above the previous year’s levels are a positive indicator that the index has likely found its floor. While signs of supply contracting continue to be reflected in the data each month, the impacts remain minimal, as the market has yet to experience any significant shifts. As we have noted in previous updates, the recovery stage in the current market cycle is posed to be a slow rebalance, as excess capacity remains stubbornly persistent.
Similar to the other indices, the direction of the OTRI in the coming months will be key more so than the absolute value. Like demand levels, rejection rates historically perform worse in April on a MoM basis, dropping an average of just over 3% from March’s levels. Tender rejections reached their lowest point last April, falling below the 3% threshold to bring the monthly average down to 2.9%. Any deviation from typical seasonality in April would surely indicate the market could return to equilibrium sooner than expected.
Truckload Capacity Outlook
Key Points
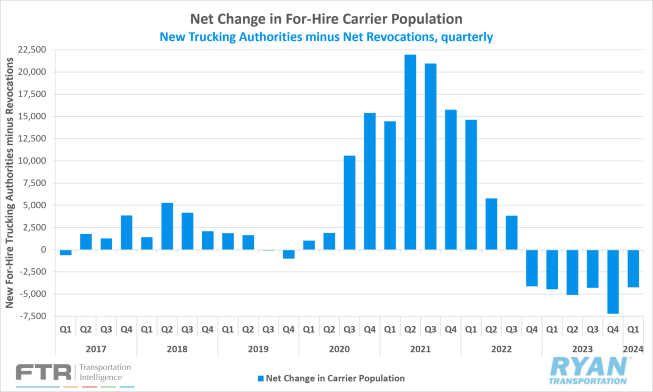
- Total net revocations, a measure of total authority revocations minus the number of reinstatements, fell significantly in February by 2,335 carriers, dropping from 7,631 carriers in January to 5,296 carriers in February, according to FTR’s preliminary analysis of the Federal Motor Carrier Safety Administration’s (FMCSA) data.
- Meanwhile, the number of newly authorized for-hire trucking companies registered their second MoM increase in February, with the FMCSA authorizing 4,497 new carriers compared to the 4,036 new authorities registered in January.
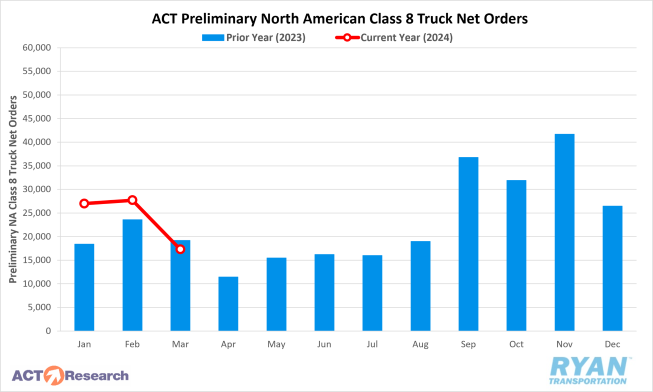
- Depending on the source, preliminary North American Class 8 Order estimates in February ranged from 25,700 units per FTR’s reporting and 27,700 units according to ACT Research’s analysis, with both estimates reflecting annual gains of 11% and 17.4%, respectively.
Summary
After 11 consecutive months of declines and the largest single month decline ever, recorded just two months prior, the net change in the carrier population turned positive in March and increased by 153 carriers. The increase in March marks just the second time the carrier population has grown in the last 17 months, with the only other time occurring in March 2023 when the population grew by 142 carriers. On a quarterly basis, the carrier population declined by 4,241 carriers in Q1, much lower than the record high 7,204 decline recorded in Q4 2023 and the lowest since Q4 2022.
The increase in the carrier population in March was largely driven by the rise in new authorities issued by the FMCSA. Since December, new authorizations have been trending positively MoM, increasing by just over 1,400 carriers in that time. Compared to Q4 last year, total new authorities registered in Q1 were up by roughly 750 carriers. Meanwhile, net revocations have been slowing over the last few months.
Total net revocations in Q1 were down 2,210 carriers to 17,961 from the 20,171 authorities that were revoked in Q4 2023. Despite the downward trend, revocations are still occurring at a historic rate, with Q1 total revoked authorities outpacing the pre-pandemic average by over 9,500 carriers. According to FreightWaves’ preliminary analysis of FMCSA data, 61% of net revocations since September 2023 were carriers with less than three years of operating authority while 26% had less than five years.
Preliminary North American Class 8 orders also dropped off in March, falling 34% and 40% compared to February, depending on the estimate. According to FTR’s reporting, the decline is in line with recent demand trends and typical seasonality for this time of the year. Current build levels continue to match replacement level demand, with build slots being filled at healthy levels. Per ACT Research, March’s minimal seasonal adjustment factor of 1.3% drops preliminary estimates from 17,300 units to 17,100 units, which is just an 8.6% MoM drop from February on a seasonally adjusted basis.
Why It Matters
The rise in new authorities in the first three months of the year is a somewhat concerning trend for both the market and carriers currently in the market. While authorities are not a true measure of capacity, it is an important indicator of capacity growth and deterioration. It’s also important to remember that monthly data can be volatile, and a delayed reaction to market events by a month or two. According to FTR’s analysis, the extent to which the data reflects market conditions could relate to participants misinterpreting the strength in spot rates in December and January as a turn in the market, instead of typical seasonality from holiday disruptions to capacity.
It is too early to assign that much significance to the rise in the carrier population in March due to it being a major outlier, and the increase in March 2023 did not indicate any major market shift. In any case, should the upward trend continue, it could potentially extend the timeline of softness across the market.
According to experts, the drop in Class 8 orders in March is not an indication of a sharp decline in demand, nor is it a sign that the market is performing significantly better than just replacement level demand. Per FTR’s reporting, despite weakness in the freight market, carriers are still showing a willingness to order new equipment. ACT Research continues to note that much of the new order growth continues to be driven by the expansion of private fleets. The financial strain of the deteriorating conditions continues to push drivers over to the private sector. Further speculation adds that much of the new order demand is being pulled forward, ahead of federal and some state emission laws set to go into effect in the next few years.
Fuel Prices
Key Points
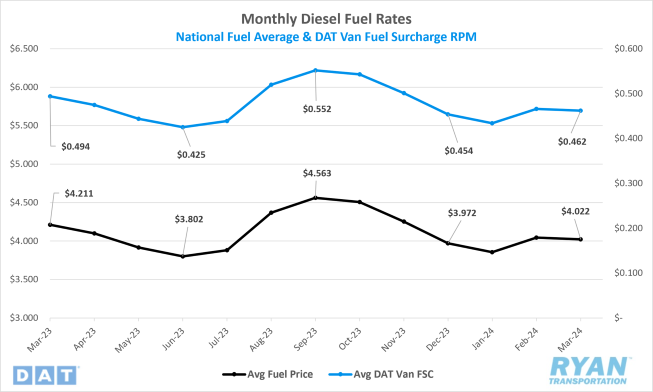
- The national average price of diesel fell 0.5% MoM, or $0.022, in March.
- At $4.022, the average price of fuel is down 4.5%, or $0.189, compared to March 2023.
- Builds on U.S. crude reserves outpaced draws in March, with the net change in commercial crude inventories increasing by 3.6M barrels (bbls) compared to the 681K consensus for the weeks ending March 1 and March 29.
Summary
The average price of fuel moderated in March, with weekly price changes registering little movement as the market appeared more “balanced” than previous months. After falling just over $0.05 in the final week of February, the benchmark price of diesel continued its negative trend through the front half of March, falling to just over $4.00 per gallon by the second week. The three-week decline trend would end there as fuel prices rebounded in the back half of the month but slightly, rising just $0.03 in the final two weeks to end the month just over $4.03.
The stability of retail prices through much of March reflected what was going on in the futures markets and wholesale markets. Compared to the volatility that’s been observed in the market since the pandemic, futures trading has remained in a relatively narrow range for both West Texas Intermediate (WTI) and Brent Crude. After closing above $80 per bbl for the first time since early November at $81.26 on March 14, WTI reached its monthly peak of $83.47 by March 19 and its highest level since late October, before fizzling out through the rest of the month but remaining above the $80 mark. Brent Crude prices followed a similar trajectory, reaching its monthly low on March 12 of $81.92 before climbing to $87.38 on March 19 and its highest level since early November.
Why It Matters
The balance in the oil market in March was a welcome relief for diesel consumers at the pump after the significant swings experienced over the past few months. The lack of any major news events in March kept markets from making any dramatic swings up or down, despite factors that generally influence those changes still existing, but appear stable. While any market reaction has yet to materialize, there is still a case for fuel prices to continue to firm in the coming months leading up to the summer travel months.
The primary factors driving the bullish argument for an increase in diesel prices in the coming months stems from continuing attacks by Ukraine on Russian oil refineries. The attacks, which have ramped up over the past few weeks, are set to take aim at Russia’s infrastructure and had removed about 375,000 bbls a day of refining capacity from the market by the end of March. This drop in throughput has also come around the same time news broke that the Russian government has told companies to reduce output in the second quarter to meet their previous pledge to OPEC+ to cut overall global supply. Another bullish outlook is tied to potential cuts to the central bank interest rate, which would ultimately boost demand and reduce borrowing costs, both a positive for the economy and commodities.
Dry Van Overview
Dry Van Spot Rates
Key Points
- The national average dry van spot rate excluding fuel declined by 3.5% MoM, or roughly $0.06, in March to $1.54.
- Compared to the same time last year, average dry van linehaul prices in March were down 7.7% YoY and sit 19.6% below the 5-year average.
- Initially reported average dry van contract rates exclusive of fuel registered a slight decline of 0.8% MoM and are 10.0% below March 2023 levels.
Dry Van Load-to-Truck Ratio
Key Points
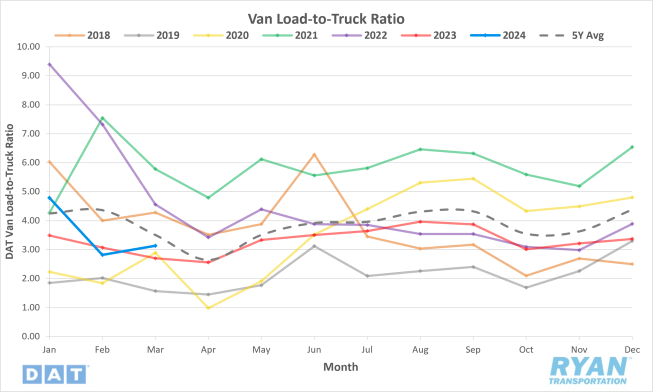
- The dry van load-to-truck ratio (LTR) increased 11.0% MoM from 2.82 in February to 3.13 in March.
- The March LTR for dry vans was up 15.9% compared to the same month last year and is 10.6% below the 5-year average.
Dry Van Market Conditions
Dry Van Summary
The contract freight market has continued to weaken, marked by a significant drop in the American Trucking Association’s (ATA) For-Hire Truck Tonnage Index. This decline, observed for 11 consecutive year-over-year periods, suggests ongoing challenges in the industry. Factors contributing to this downturn include adverse winter weather in January and decreases in retail sales, housing starts and manufacturing output. Data indicates that most of the freight movement occurs within the contract market, with only a small portion happening within the spot market.
In contrast, the Logistics Manager’s Index (LMI) showed growth, reaching its highest level in a year. This expansion is reflected across various sectors, including inventory levels, warehousing capacity, and transportation metrics. The LMI utilizes a diffusion index, where a reading above 50 indicates expansion, providing insights into the logistics industry’s overall health. However, the index suggests that, despite this growth, the freight market has not yet entered a sustained period of recovery.
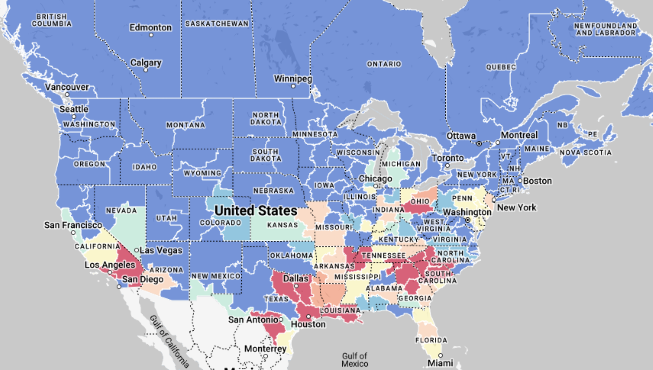
There are also regional trends in freight movement and rates. California experienced a spike in outbound loads ahead of a winter storm, while Texas saw a slight increase in linehaul rates. Despite fluctuations in volumes, rates have generally been increasing, especially in key markets like Los Angeles and Dallas-Fort Worth. These insights provide a snapshot of the current dynamics in the freight industry, reflecting both challenges and opportunities for stakeholders.
Reefer Overview
Reefer Spot Rates
Key Points
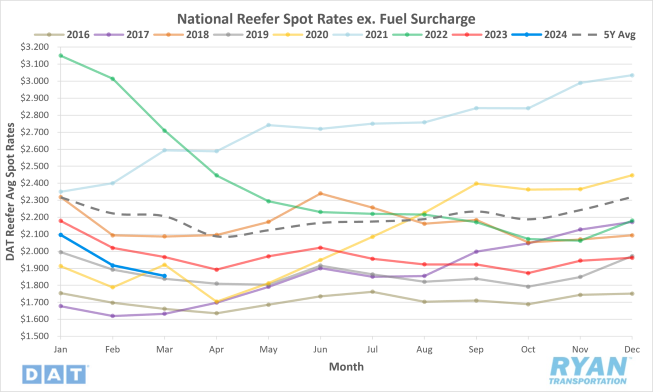
- The national average reefer spot rate excluding fuel fell 3.2% MoM, or $0.06, in March to $1.86.
- Average reefer linehaul spot rates were down 5.6% on an annual basis and sit 15.9% below the 5-year average.
- Initially reported average contract rates excluding a fuel surcharge for reefers fell 0.9% MoM and are down 6.2% compared to March 2023.
Load-to-Truck Ratio
Key Points
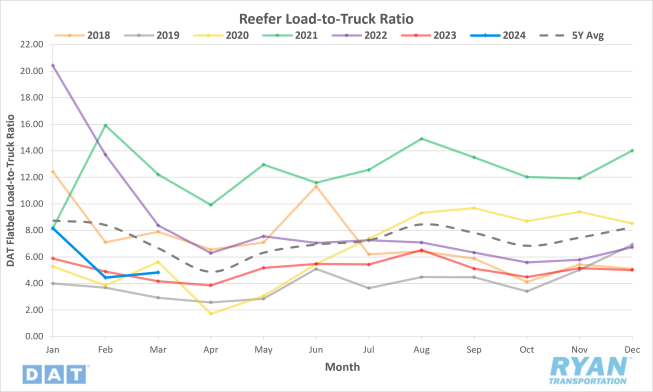
- The reefer LTR increased 8.5% MoM, up from 4.45 in February to 4.83 in March.
- The March LTR for reefers is up 15.8% YoY but remains 27.3% below the 5-year average.
Market Conditions
Reefer Summary
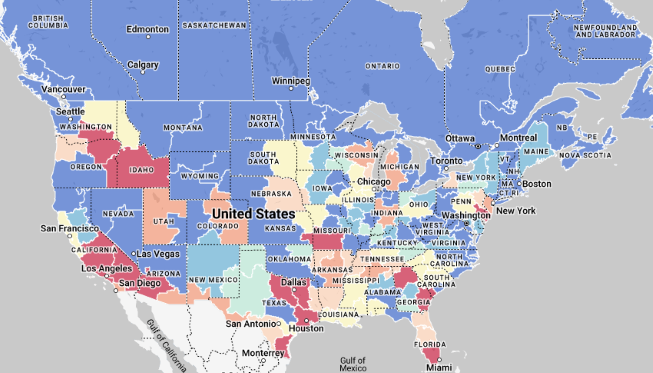
The U.S. Department of Agriculture reports a decline in reefer volumes of fresh and frozen beef due to a 2% decrease in cattle inventory, the lowest in 73 years. Reefer carriers have experienced a 14% drop in truckload volume since the recorded high in March 2022. This decline is attributed to factors such as droughts and high input costs, prompting ranchers to sell off their herds. Additionally, domestic beef production has decreased by 3% while imports have surged by nearly 10%, reaching a 30-year high.
Alabama's Port of Mobile has seen a significant increase in refrigerated import volumes, particularly of lithium-ion batteries, which account for 20% of import volume. Seafood imports from China, mainly tilapia, also contribute to the port's refrigerated imports. The state's status as a central import hub is complemented by its position as the second-largest producer of poultry in the U.S. and its extensive cold storage warehousing facilities.
Washington State's Mason Valley, particularly Yerington, is a major onion-growing region dubbed the "Onion Capital of the West." Recent expansions in cooling facilities have enhanced the region's capacity to ship leafy greens and organic vegetables. Meanwhile, in Othello, Washington, known as the French fry capital of the world, potato processing plants produce a significant portion of the nation's frozen potato products annually.
In the freight market, Chicago remains a significant hub for reefer loads, with outbound rates declining slightly. California's outbound linehaul rates reversed course in mid-March, increasing after a decline since the start of the year. Produce season in Florida has started but outbound volumes are lower than last year, impacting linehaul rates. Overall, regional trends in produce markets and reefer freight reflect fluctuations in volumes and rates across the U.S.
Flatbed Overview
Flatbed Spot Rates
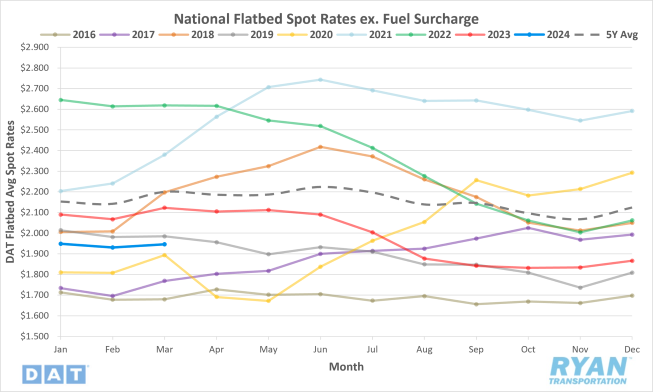
Key Points
- The national average flatbed spot rate excluding fuel increased slightly by 0.8% MoM, or $0.02, in March to $1.95.
- The average flatbed linehaul spot rates remain below YoY levels by 8.3% and sit 11.6% below the 5-year average.
- Initially reported flatbed contract rate averages exclusive of fuel were up 2.8% MoM but are down 2.4% on an annual basis.
Flatbed Load-to-Truck Ratio
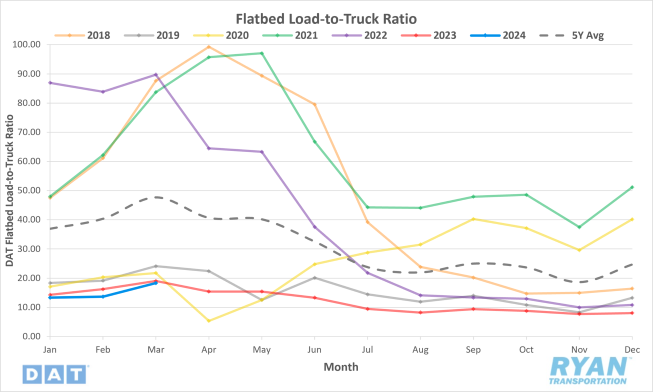
Key Points
- The flatbed LTR increased 34.5% MoM in March, from 13.64 in February to 18.35.
- The March LTR for flatbeds is down 3.5% YoY and sits 61.5% below the 5-year average.
Flatbed Market Conditions
Flatbed Summary
The manufacturing sector in the U.S. experienced a slight decline in January, with a 0.6% decrease in production compared to the previous month. Year-over-year, manufacturing output dropped by 1.3%. This trend is closely monitored as manufacturing plays a significant role in national output, influencing the freight demand for truckload carriers, particularly in the flatbed segment. Professor Jason Miller from Michigan State University indicates that an uptick in U.S. manufacturing output is essential for the truck transportation industry to emerge from the current freight recession.
However, the manufacturing industry continues to face challenges, as indicated by the Institute for Supply Management's Purchasing Managers Index (PMI), which dropped to 47.8 in February, signaling contraction for the 16th consecutive month. Of particular concern is the decline in the New Orders Index, reflecting a decrease in future demand. Despite some growth in specific manufacturing sectors, overall contraction persistsaffecting flatbed demand, especially in regions like Las Vegas, which are heavily reliant on construction projects for freight movement.
The construction boom in Las Vegas, fueled by significant projects like the new Las Vegas Raiders NFL Stadium and the Resort World Casino, drives demand for flatbed carriers. The upcoming construction of the Oaklands A's baseball stadium, following the demolition of the Tropicana Resort, is expected to generate substantial freight for flatbed carriers. Additionally, indicators such as the Fannie Mae Home Purchase Sentiment Index suggest optimism in the residential construction market, further influencing demand for flatbed transportation. Overall, despite fluctuations in manufacturing and construction sectors, flatbed volumes surged recently, driven by increased demand ahead of the planting season and construction activities in various regions.
Intermodal
Intermodal Spot Rates
Key Points
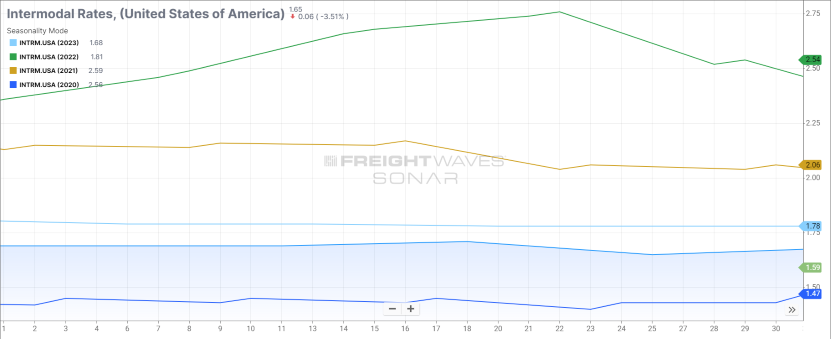
- The FreightWaves SONAR Intermodal Rates Index (INTRM.USA), which measures the average weekly all-in door-to-door intermodal spot rates for 53’ dry vans across a majority of origin-destination pairings, decreased by $0.03 MoM to $1.66 in March.
- Compared to March 2023, intermodal spot rates are down 6.7% and were 11.1% below the 5-year average.
Intermodal Volumes
Key Points
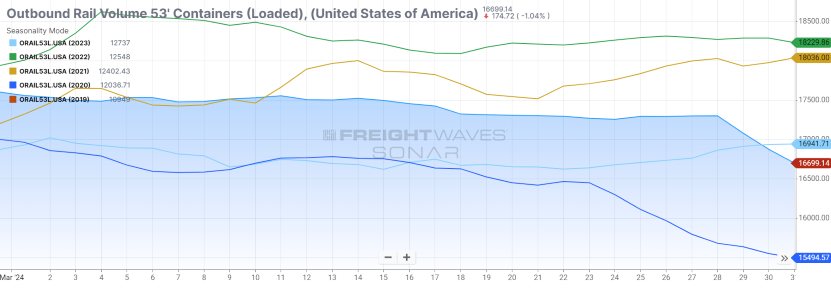
- Total loaded volumes for 53’ containers from all domestic markets, measured by the FreightWaves SONAR Loaded Outbound Rail Volume Index (ORAIL53L.USA), were down 4.9% at the end of March from where they started the month.
- Total loaded volumes at the end of March were 1.4% lower compared to the same time in 2023 and were virtually flat compared to the 5-year average, registering just 0.4% below.
Intermodal Summary
March brought mixed results for the rail industry, as overall carload traffic continues to run below YoY levels while intermodal volumes are moving well above the levels recorded in 2023. According to the March report released by the Association of American Railroads (AAR), overall rail carloads were down 3.5% in March but registered a 2.9% increase when excluding coal. Overall intermodal container and trailer volumes increased 11.7% in March, per AAR’s report, a reflection of stable consumer spending, increasing port activity and a reduction of inventory destocking. When combined, U.S. rail carload and intermodal volumes were up roughly 4.2%, or 75,800 carloads, compared to the same time in 2023.
While the growth in volumes continues to be a bright spot for the intermodal sector, the same cannot be said for rates, as truckload conditions continue to create an overly competitive atmosphere. According to FreightWaves SONAR, intermodal contract rates continue to reflect discounts on an annual basis but have improved as the year progresses. Compared to March 2023, initially reported contract rates are down 1.8% and sit 14.8% below the same month in 2022.
Looking at the FreightWaves SONAR Intermodal Contract Savings Index (IMCSI1.USA), which reflects the average percentage difference between all-in intermodal contract rates and all-in truckload contract rates in the same lane, the decline in intermodal rates in March propped up the index by 77 bps. This marked an increase from 8.02% at the beginning of the month to 8.99% at the end, indicating that intermodal pricing is attempting to become more competitive with the weaker truckload market. The savings are still well below the long-term average, however, creating further pricing pressure in the coming months.
Further Reading
- FreightWaves: Drop in Class 8 Truck Orders in March Looks Big But Analysts Aren't Worried
- Transport Topics: Automakers Face Workarounds Due to Port of Baltimore Closure
- Logistics Management: Descartes March Global Shipping Report Highlights Ongoing Steady Volume Momentum