
Executive Summary
Along with cold weather and a new year, January brought with it many of the mixed signals the economy and freight markets dealt with last year. Across the transportation industry, seasonal lulls in demand were met with increased rates and tight capacity. Meanwhile, broader economic data continued to reflect strength in labor and in the consumer, but hints at potential problems further down the road.
January labor data continued to reflect strength in the jobs market as employment rose by 353,000 after sharp upward revisions were made to December’s figures. Initial estimates reflect a growth of 3.3% in GDP for Q4 driven by household and government spending. The only caveat is the expansion of consumer spending in the second half of 2023 more than doubled the growth for real disposable income. This makes the resiliency of the consumer unsustainable in the long term.
On the transportation side, YoY increases in demand continue to indicate the early stages of recovery as the market works to shed excess capacity. Despite the slowdown in demand typical for January, winter storm disruptions kept carrier networks spread out for longer, driving up rates in turn. The intermodal sector volume outlook has improved, but only as a result of strength from the international segment. The ongoing competition against a weak truckload market continues to force a decline in rates and discounts within the industry.
In the maritime sector, U.S. containerized imports registered an increase of 7.9% MoM in January, the largest MoM growth for January in the last seven years. Much of the growth was driven by a 14.9% increase of imports from China to West Coast ports. Compared to January 2023, imports were up 9.9% YoY and 9.6% higher than January 2019. Despite the growth, ocean carriers have seen an increase in transit times due to conditions in the Panama and Suez Canal that will likely impact performance throughout 2024.
Main Takeaways
- Manufacturing activity contracted at a slower rate in January compared to December, driven by a rise in new orders and production.
- Increases in average spot market rates outpaced those in the contract market, narrowing the contract-to-spot spread further in January.
- Spot market activity registered significant gains as freight volumes shifted away from the contract market following the holidays.
- The market continues to work toward a rebalance in supply and demand as the carrier population registered its largest single-month decline on record.
- Average fuel prices fell for the fourth consecutive month amidst rising geopolitical tensions.
Economy | Spot Rates | Truckload Demand | Truckload Supply | Fuel Prices | Dry Van Overview | Reefer Overview | Flatbed Overview | Intermodal
Economy
United States ISM Manufacturing PMI
Key Points
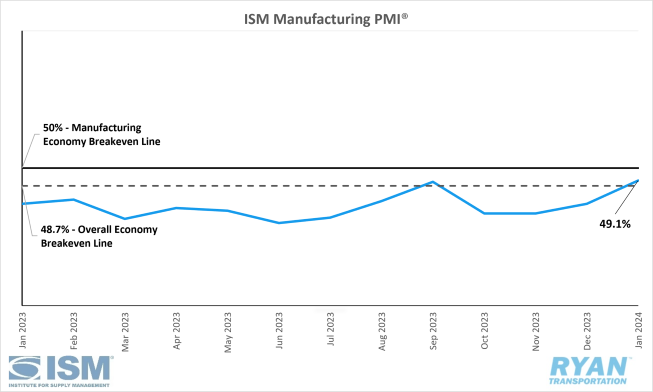
- The Institute for Supply Management’s (ISM) Manufacturing PMI® registered 49.1% in January, a 2.0% increase from December’s figure of 47.1%, and remained in contraction territory.
- The New Orders Index recorded a 5.5% increase in January from December to 52.5% and moved from contraction to expansion territory.
- The Production Index registered 50.4% in January, 0.5% higher than December’s reading of 49.9%, and returned the index to growth territory after two months of contraction.
- The Employment Index in January registered 0.4% lower than December’s reading of 47.5% to 47.1% and remained in contraction.
- The Customers’ Inventories Index registered 43.7% in January, down 4.4% from December, and moved further into ‘too low’ region.
Summary
Manufacturing activity in the U.S. contracted in January for the 15th consecutive month but at a slower rate compared to December. In terms of the overall economy, the 49.1% recorded by the ISM Manufacturing PMI® in January marks the first month above the overall economy breakeven line of 48.7% since September 2023. According to the ISM report, demand levels moderately improved while companies effectively managed outputs, and inputs continue to accommodate future growth.
The demand components of the Manufacturing PMI®, measured by the New Orders, Backlog of Orders and Customers’ Inventories indices, remained soft but showed signs of improvement. The New Orders Index saw a significant jump in January, increasing 5.5% from December’s figure and moving the index into expansion territory after 16 months in contraction. The Backlog of Orders Index fell 0.6% in January to 44.7% from December’s reading of 45.3% as the index remains in fairly strong contraction territory. Customers’ inventories contracted further in January to 43.7% and its lowest level since October 2022, when the index registered 41.6%, moving further into ‘too low’ territory.
The output/consumption components of the diffusion index, measured by the Production and Employment indices, registered moderate expansion in January. Both indices combined for a marginal positive impact (0.1%) on the Manufacturing PMI® calculation, according to ISM reporting. Companies maintained production levels to match demand and continued reducing head counts through significant layoff activity.
The Prices and Supplier Deliveries indices, primarily used to gauge input levels for the Manufacturing PMI®, continued to accommodate future growth, but began showing signs of tightening in January. The Prices Index registered a significant increase of 7.7% in January to 52.9% from December’s figure of 45.2% and moved from “decreasing” to “increasing” territory as new pricing levels for 2024 went into effect. The Supplier Deliveries Index registered 2.1% higher in January to 49.1% as the index indicated faster deliveries for the 16th consecutive month.
Why it Matters:
Although manufacturing activity remained in contraction in January, the most recent Manufacturing PMI® reading indicates that conditions appear to be stabilizing as the index outperformed both December’s figure and the general consensus of 47.4%. While demand levels remain soft compared to historical standards, the case for a rebound in 2024 has continued to get stronger over the past few months. One major point of evidence for a return to growth across the sector stems from the January Manufacturing PMI® reading, which registered above the overall economy breakeven line and into growth territory for the first time in four months. According to the ISM report, the 49.1% reading in January corresponds to a change of +1.9% in real GDP on an annualized basis.
Another strong point to back the case of conditions improving over the next year, the performance of the indices that factor into the demand side of the Manufacturing PMI® was strong in January relative to the past several months. Primarily, the notable increase in new orders in January compared to December, which snapped a 16-month streak of contraction recorded by the New Orders Index to return to growth territory, bodes well for future output levels. According to the ISM, January’s reading was the index’s best performance since May 2022 when it registered 55.3% and marked just the second time in the last 20 months that the index has expanded, with August 2022 (50.1%) being the last.
Customers’ inventories are also a strong indicator of which direction production levels will trend in the future. The drop in January into the ‘too low’ region indicates customer inventory levels are sagging as panelists reported significant product shortages during the month, per the ISM. This provides strong upward pressure on new orders and, in turn, creates positive momentum for future production. While new orders and customers’ inventories generally impact the mid- to long-term forecasts, the Backlog of Orders Index remaining in strong contraction territory adds negative pressure to the near-term outlook. Despite effectively managing output levels and significantly reducing head counts, companies are still able to work through existing backlogs relatively quicker than the build of new orders.
Of the six biggest manufacturing industries; Computer & Electronic Products; Chemical Products; Transportation Equipment; Food, Beverage & Tobacco Products; Machinery; and Petroleum & Coal Products; two (Transportation Equipment; and Chemical Products) registered growth in January compared to none in December.
Macro Impacts
- Nonfarm payroll employment rose by 353,000 jobs in January, exceeding the 170,000 consensus and topping December’s revised figure of 333,000 from 216,000 on a seasonally adjusted basis, according to the most recent jobs report released by the Bureau of Labor Statistics (BLS).
- The unemployment rate remained unchanged from November and December at 3.7%.
- Total Transportation and Warehousing employment rose by 15,500 jobs in January.
- Truck Transportation added 2,400 jobs in January.
- Warehousing and Storage rose by 5,500 jobs.
- Both the headline and core Personal Consumption Expenditures (PCE) Prices Index, the Fed’s preferred gauge for measuring inflation, increased 0.2% MoM in December on a seasonally adjusted basis, according to the most recent report from the Bureau of Economic Analysis (BEA).
- Headline PCE was unchanged from November, rising 2.6% in December on an annual, seasonally adjusted basis.
- Core PCE, which excludes food and energy, rose 2.9% over the last 12 months, a 0.3% drop from November’s reading of 3.2%.
- The headline Consumer Price Index (CPI) rose a seasonally adjusted 0.3% MoM in January, compared to the 0.2% increase registered in December, as core CPI rose 0.4% MoM compared to 0.3% in December, according to the BLS.
- On an annual basis, headline CPI was up 3.1% YoY in January seasonally adjusted.
- Core CPI, which excludes food and energy, rose 3.4% YoY on a seasonally adjusted basis in January.
Industry Overview
January Key Figures (YoY)
| Truck Data Points | YoY Change (%) |
|---|---|
| DAT Spot Rates (incl. FSC) | -9.8% q |
| Fuel Prices | -15.8% q |
| ACT Class 8 Preliminary Orders | 45.0% p |
| ATA NSA Truck Tonnage* | -2.2% p |
| Cass Freight Index | -5.9% q |
| Cass Freight Expenditures | -24.3% q |
| Cass Freight Shipments | -7.6% q |
*December report released 1/23/2024
Rates
Spot Rates
Key Points
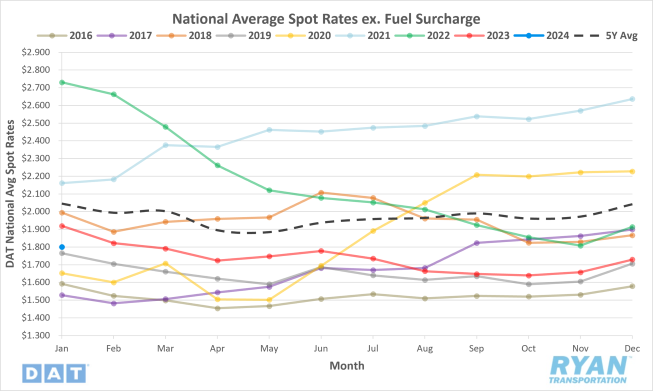
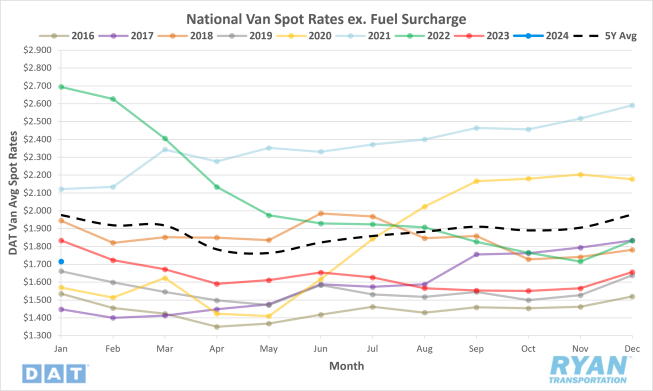
- The national average spot rate excl. fuel surcharge increased 4.2% MoM, or $0.072, in January.
- Compared to the same period last year, national average linehaul rates were down 6.2% YoY, or $0.119, and sit 12.0% below the 5-year average.
Contract Rates
Key Points
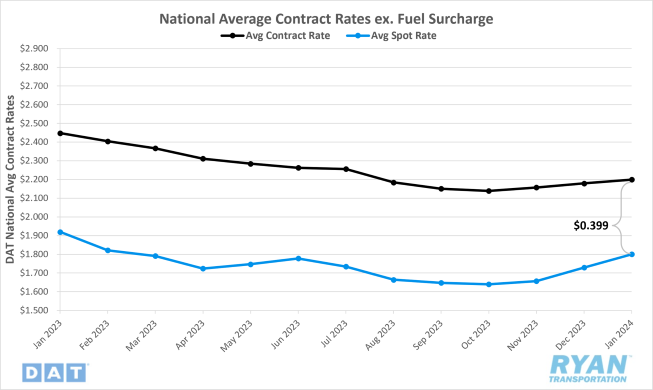
- The national average contract rate excl. fuel surcharge rose slightly by 0.9% MoM, or $0.020, in January.
- On an annual basis, contract linehaul rates were down 10.2% YoY, or $0.249.
- The contract-to-spot spread narrowed further in January, dropping from $0.450 in December to $0.399.
Summary
After trending in line with seasonality through the last three months of 2023, national average spot rates registered an unexpected boost in January and outperformed typical seasonality. January marked the third consecutive month of sequential gains in linehaul rates for the first time since the end of 2021 into January 2022 at the peak of the current market cycle. However, despite the monthly increases, average spot rates remain well below long-term averages. Compared to January 2020, when the industry was still struggling through the oversupplied market that began in 2019, linehaul rates were 8.9% higher in 2024.
Following two consecutive months of increases and a nearly $0.10 WoW spike in the final week of December, the DAT 7-day average linehaul rate started the year 4.5%, or roughly $0.08, higher than the 12-month average for 2023. Through the first two weeks of January, average spot rates continued to trend in line with typical seasonal patterns as the DAT 7-day average linehaul registered moderate declines of just under $0.04. However, by the third week of the month, the previous declines were all but erased with an unseasonal $0.03 WoW jump in the 7-day linehaul average.
The last time spot rates spiked in the back half of January came in 2022 at the peak of the current market cycle, when rates rose $0.02 WoW. Prior to that was a roughly $0.04 WoW increase in 2018 following the implementation of the ELD mandate. The increase observed this January was short-lived, however, as the DAT 7-day average spot rate remained virtually flat in the week immediately after, before dropping just under $0.02 WoW to close out the month.
Similar to the spot market, initially reported national average contract rates excl. fuel recorded a third consecutive month of gains following the 0.9% MoM increase in January. The last time average contract rates saw consecutive MoM gains was toward the end of 2021 and into early 2022, during the inflationary stage of the current market cycle. The moderate rise in contract rates in January was once again outpaced by the increases observed in spot market rates, narrowing the spread from $0.45 in December to just under $0.40 in January. The $0.05 MoM decline in the contract-to-spot rate spread is the most significant drop since June of last year and now sits within the pre-pandemic average range of $0.35-$0.45.
Why It Matters:
The increase in spot market rates in January came as a bit of a surprise for many in the industry. Much of the unexpectedness stems from the outperformance of typical seasonality, given the deflationary conditions the industry has become so accustomed to over the last two years. January is generally considered the start of the “quiet” months within the truckload market, as shippers recover from holiday operations and demand begins its descent toward its softest point of the year that extends through Q1. Traditional seasonal patterns anticipate moderate declines in elevated holiday rates through the first two weeks of January as drivers reposition themselves within normal routing guides and retail returns peak for the year. As capacity returns to the market, rate declines accelerate in the back half of January into early February.
This is not the first time linehaul averages have increased MoM in January. In fact, average linehaul rates have registered higher in January than in December for the last three years. However, unlike the gains in previous years, this is the first year that doesn’t have a definitive underlying cause to attach to it. In 2023, lower December averages from the lack of a peak season in 2022 paired with a two-week arctic cold front in January that caused dry van volumes to lose market share to the more expensive reefer sector. Prior to that, the market was still in the inflationary stage as a result of strong 2021 demand that ultimately peaked in January 2022.
Speculation as to the cause for the rise in rates in 2024 appears to be split between two main root causes. Some point to another round of arctic temperatures mixed with a series of winter storms delaying drivers from returning to their normal territories. Others believe capacity took a big step toward correcting at the turn of the new year and sharply reducing available truckload supply creating, further strain on routing guides.
Truckload Demand
Key Points
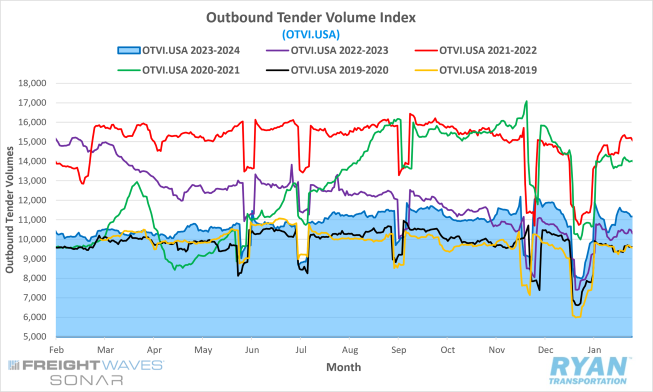
- The FreightWaves SONAR Outbound Tender Volume Index (OTVI.USA), a measure of contracted tender volumes across all modes, ended January up 37.2% from the levels recorded 30 days prior.
- The monthly average of daily tender volumes recorded by the index in January was 0.7% lower than December’s figure, dropping from 10,792.03 to 10,715.50.
- On an annual basis, January’s monthly average of daily tender volumes was up 8.0% but remained 3.5% below the 5-year average.
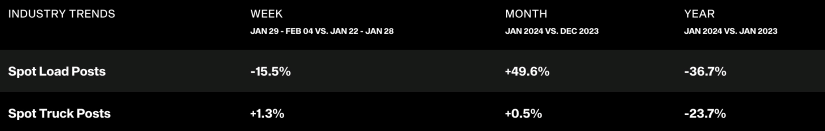
- Spot market activity registered a significant resurgence in January, increasing 49.6% MoM while remaining well below YoY levels by 36.7%.
Summary
Following a relatively strong December, demand levels were expectedly subdued in the final week of 2023 through the first week of 2024. As operations returned to normal, tender volumes recorded by the OTVI surged nearly 20% at the start of the second week, with the index hitting its highest level since early December. The resurgence of outbound tender volumes was short-lived as the index registered just over a 13% decline to the month’s low point in the middle of January. Demand levels settled into typical seasonality for January in the back half, with the OTVI registering moderate WoW gains to close out the month up just under 8% from the mid-month lows.
The end-of-month MoM comparisons were skewed in January as a result of facility closures due to the holidays. Looking at mid-month comparisons to eliminate the static from the holidays, tender volumes were down 8.6% midway through January from the previous 30 days. This is in line with expectations, as January is generally considered a “quiet” month in terms of annual demand. Compared to 2023, average tender volumes were up nearly 8% YoY and registered higher than averages for the same month in 2019 and 2020.
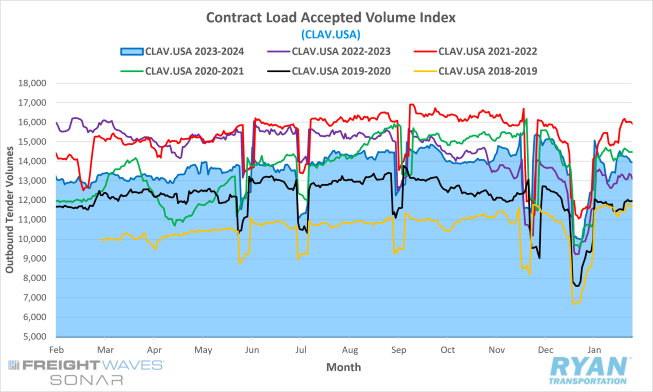
Although freight volumes continue to favor the contract market, holiday disruptions and cold-weather events saw a significant amount of market share shift over to the spot market in January. The MoM increase in spot load posts recorded by DAT was the most significant since January 2022, just the second time in the last 12 months that spot volumes have trended positively. The impact of the shift of demand from the contract to the spot market is further supported by the FreightWaves SONAR Contract Loads Accepted Volume Index (CLAV.USA), shown below, which is similar to the OTVI but removes rejected tenders. According to readings from the index, tender volumes accepted under contract were down 9.2% MoM at the midway point of the month and were 7.4% higher than January 2023 levels. The narrowing YoY differences indicate actual freight flow is recovering from the bottom of the cycle.
Why It Matters:
The resurgence of tender volumes following the two-week lull from holiday disruptions was a positive signal that the market is in the early stages of finding balance. The positive YoY differential in tender volumes remains one of the stronger indicators of freight market recovery. These gains, however, will be tested in the coming months as demand is generally at its softest in Q1. Further negative pressure will come from shippers’ continued efforts to shift back to “just in time” inventory management processes that were so heavily relied on prior to the pandemic-driven boom.
While the uptick in spot market activity was a welcomed surprise for carriers with increased exposure to it. However, it will likely be an outlier for the remainder of Q1 as demand levels remain soft. There remains the possibility of cold weather events creating disruptions that cause some volume activity over to the spot market. However, as capacity has now repositioned itself, the degree to which shippers are forced to look to the spot market for coverage will not be as severe.
Truckload Supply
Key Points
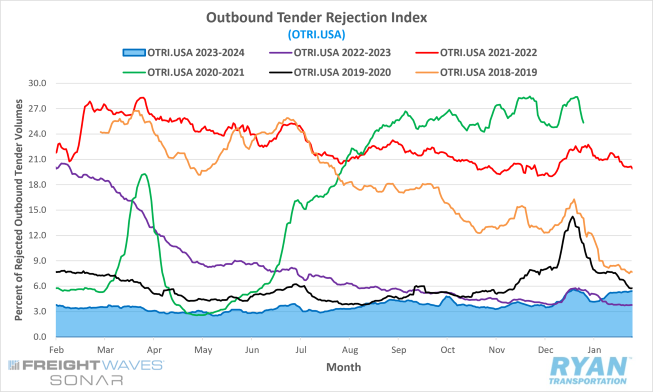
- The FreightWaves SONAR Outbound Tender Rejection Index (OTRI.USA), a measure of relative capacity based on carriers’ willingness to accept freight volumes under contract reflected as a percentage, closed out January at 5.40%, a 16-basis point (bps) increase from the end of December.
- Average daily tender rejections in January registered 4.88% by the index, which was 0.47% higher than December’s average of 4.41%.
- Compared to 2023 levels, average daily tender rejections in January were up 54 bps YoY and were 8.19% below the 5-year average.
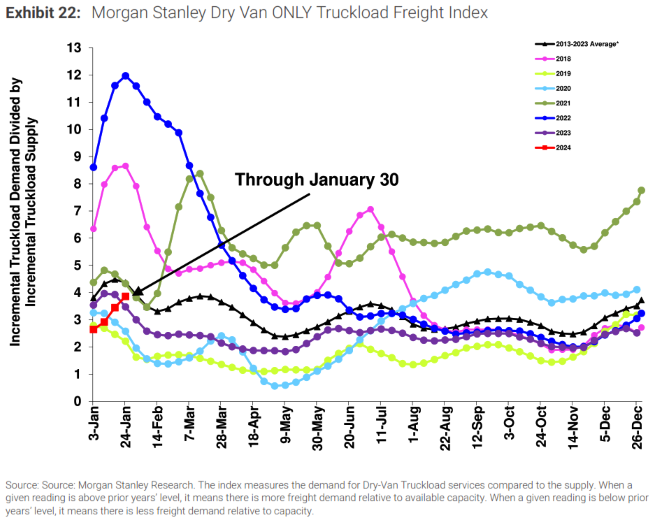
- Following sequential declines and underperforming seasonality throughout December, the Morgan Stanley Truckload Freight Index (MSTLFI) registered strong sequential increases throughout January and recorded its strongest outperformance of typical seasonality since early 2022.
Summary
Rejection rates in January continue to reflect an oversaturation of supply in the market, as the OTRI remained below 6% for the second year in a row despite holiday disruptions. After moving north of 5%, for the first time since early January 2023 in the days leading up to Christmas, the Outbound Tender Rejection Index fell 95 bps through the first week to its lowest point of 4.17% for the month. As cold-weather events delayed drivers returning to the road, rejection values gained momentum through the next two weeks, topping out around 5.35% at the start of the final week. Despite the cold-weather events that delayed carriers from repositioning themselves, tender rejection rates averaged just barely over 5% after the first week in January.
On an annual basis, rejection rates recorded by the OTRI in January were up 0.5% YoY compared to the same time in 2023. The YoY increase in January is the first time since July 2021 that the monthly average of daily tender rejections registered positive compared to the same month in the previous year. While the positive YoY gains are a move in the right direction, the monthly average of OTRI values this past month remains 2.7% below January 2020 levels, indicating the market is still facing a supply side imbalance. The Morgan Stanley Truckload Freight Index echoes a similar sentiment, as most of January’s reading remained below both long-term average and 2023 figures. One positive note from the MSTLFI readings came at the end of the month, when current readings moved above 2023 levels and narrowed in on long-term averages. According to Morgan Stanley, index readings above the previous year's level indicate there is more freight demand relative to capacity. Should the index remain above 2023 levels, it will likely be a result of the market continuing to shed off capacity.
Why It Matters:
National rejection rates ended 2023 with an annual average of 3.7%, making it the softest market on record. For comparison, the oversupplied market of 2019 that resulted in the industry’s last recession saw an annual average for national rejection rates that was just over 6%. It is worth noting that OTRI readings have been trending slightly upward since reaching their bottom recorded in May 2023. The sluggish recovery in tender rejections further supports the theory that the current market downturn is primarily supply driven.
The coming months will likely see rejection values dip back closer to the averages recorded in 2023. From a historical standpoint, tender rejections typically fall by 1% MoM, on average, between January and February, with 2021 being the only outlier when OTRI values increased by 1.5%. With demand weakening over the course of the next two months, that MoM decline could register much higher without further correction across supply levels.
Truckload Capacity Outlook
Key Points
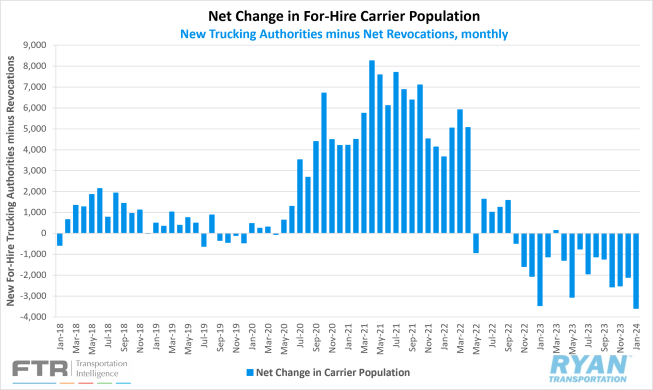
- Total net revocations, a measure of total authority revocations minus the number of reinstatements, surged in January, increasing from 5,852 carriers in December to 7,631 carriers in January, according to FTR’s preliminary analysis of the Federal Motor Carrier Safety Administration’s (FMCSA) data.
- Meanwhile, the number of newly authorized for-hire trucking companies registered a slight MoM increase in January, as the FMCSA authorized 4,036 new carriers compared to the 3,741 figure recorded in December.
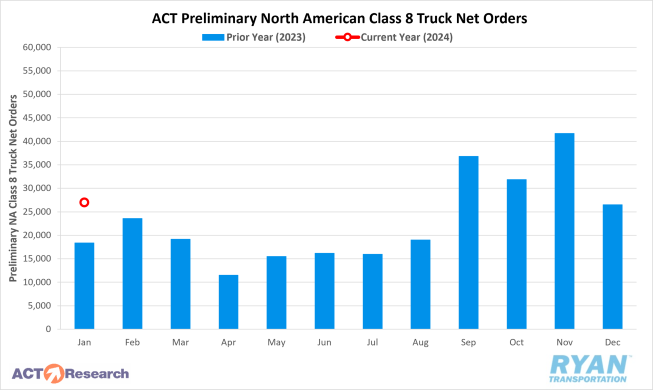
- Depending on the source, preliminary North American Class 8 Order estimates in January ranged from 26,400 units, per FTR’s reporting, to 27,000 units, according to ACT Research’s analysis, with both estimates reflecting annual increases of 35% and 45%, respectively.
Summary
The for-hire trucking population registered the largest single-month drop ever in January, with a net decrease of 3,595 carriers. The significant decline in the carrier population was primarily driven by net revocations, as January’s figure of 7,631 total authorities revoked was 1,779 carriers higher than December’s figure of 5,852. January’s net change in for-hire trucking companies was the highest figure since May 2023 and was roughly 130 more than the net decrease in January 2023.
Meanwhile, the number of new carriers entering the market remains low by historical standards as the FMCSA authorized 4,036 new for-hire trucking companies in January. Though January’s figure was roughly 300 carriers more than January, it was otherwise the lowest number of new entrants recorded by the FMCSA since June 2020. According to FTR’s reporting on FMCSA data, the record number of carriers leaving the market and those choosing to enter the market appear to be, primarily, smaller fleets operating with just one or two power units.
While smaller carriers are driven out of the market, larger fleets continue to focus on expansion and replacing older power units despite uncertainty in the future of the freight market. According to FTR, preliminary North American Class 8 order levels in January were above historical standards and remain above seasonal trends, indicating 2024 order activity will likely reflect replacement demand. Based on FTR’s analysis, total Class 8 orders over the last three months through January are running at an annualized rate of 327,000 units. For context, orders over the last 12 months through January totaled 259,000 units. ACT research echoed a similar sentiment, reporting a 45% annual increase in January and a 17% MoM increase after seasonal adjustment.
Why It Matters:
The net decrease in the carrier population continues to signal that the market is working to resolve the oversupply issue, which has plagued the industry over the last two years. The spike in net revocations between December and January mirrors a similar result compared to this time last year. As FTR explains in their reporting, most carriers that had their authorities revoked in January likely ceased operation in November or December, or possibly even earlier.
The revocation process takes 30 days once an insurer notifies the FMCSA that a carrier’s liability insurance policy has been canceled. According to FTR, timing plays a crucial role in revocation figures each month as the FMCSA issues far more authority revocations on Mondays than on any other day of the week. Similar to May 2023, when net revocations totaled 8,893 carriers, January 2024 had five Mondays. While not every month with five Mondays has an elevated number of net revocations per se, it is more common to see extraordinary figures during months that do compared to months that don’t.
Despite uncertainty surrounding the future of the freight market, truck orders remain strong in 2024. The January gains come as a surprise, as weak freight and carrier profitability fundamentals combined with larger carriers guiding to lower capital expenditures would imply some negative pressure to U.S. tractor orders, according to ACT Research. While the underlying data for January Class 8 orders is still being collected, the high levels at the start of the year suggest that OTR truckers in the U.S. are still purchasing new units. Per ACT’s forecasting, Class 8 orders are expected to slip through 2024 as further pressure is added via the weak freight market. However, long-term sales are expected to grow with a surge in 2026 ahead of the U.S. EPA’s 2027 low-NOx regulations going into effect.
Fuel Prices
Key Points
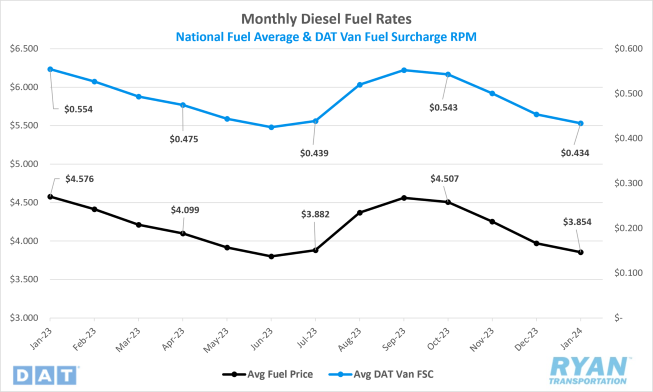
- The national average price of fuel declined for the fourth straight month, dropping 3.0% MoM, or $0.117, in January.
- At $3.854, the average price of diesel is down 15.8%, or $0.722, compared to prices in January 2023.
- Draws on U.S. crude reserves outpaced builds for the second consecutive month, with the net change in commercial crude inventories declining by 6.14M barrels (bbls) versus the consensus of draws totaling 5.31M bbls for the weeks ending January 5 and January 26, according to reports released by the Energy Information Administration (EIA).
Summary
The national average price of diesel continued its decline in January for the fourth consecutive month amidst rising geopolitical tensions in the Red Sea. Weekly fuel prices moderated in January, unlike the previous two months that registered seven consecutive weeks of declines, before rising slightly $0.02 WoW in the final week of the year. After opening the year with WoW declines totaling $0.09 through the first two weeks, the benchmark diesel price used for most fuel surcharges increased $0.035 for just the second time in 12 weeks. Average fuel prices would register another decline in the third week before ultimately ending the month of January up $0.029 WoW. Fuel prices in the final week of January had fallen just shy of $0.77 from their 2023 high, recorded on September 18 at $4.633 per gallon.
Meanwhile, the global oil market remains oversupplied, as the most recent OPEC report reduced the estimate of how much oil the market will need from the member nations in 2024 by 500,000 barrels. Other reports indicate the oil group’s output will likely be higher in 2024 than it was in 2023, as the member nations have a significant amount of capacity on the sidelines in case a surge in demand needs to be met. Drawdowns on U.S. crude reserves resumed their positive trend, following two months of strong builds during refinery maintenance season, as U.S. oil production continues to reach all-time highs, surpassing the likes of Russia and Saudia Arabia in January. Draws on U.S. commercial crude inventories hit their highest level since June of last year, with draws totaling 9.2M bbls in the third week of January, according to the EIA’s Weekly Petroleum status reports.
Why It Matters:
Much of the back and forth in fuel prices in January continued to stem from the conflict in the Red Sea and Suez Canal, as well as uncertainty surrounding the future health of China’s economy. The initial shock of the attacks by the Houthi Rebels out of Yemen has apparently run its course on impacting the oil market, as many analysts have muted concerns that the war will escalate to Iran. There is also less urgency due to the ability to divert shipping containers around Southern Africa to avoid the embattled region altogether. While China’s economic woes and reduced sensitivity to conflict in the Middle East added negative pressure to prices in January, oil markets were able to capitalize on the cold weather streaks in the U.S. and drive averages up, if just temporarily.
As the market remains oversupplied, very few exceptions stand in the way of further declines in fuel prices in the near-term outlook. One exception in the coming month is isolated cold-weather events that drive up demand of natural gas and heating oils. While those incidents are generally temporary and not enough to drive meaningful increases, the great cold front of February 2021 that blanketed the U.S. and ushered in arctic temperatures was enough to raise average prices by $0.25 over the course of four weeks. Another exception revolves around the escalation of the conflict in the Red Sea and which countries ultimately get involved. However, neither scenario reflects an impact on current futures trading for either Brent crude or West Texas Intermediate (WTI).
Dry Van Overview
Dry Van Spot Rates
Key Points
- The national average dry van spot rate excl. fuel surcharge increased for the third consecutive month in January, rising 3.6% MoM, or $0.060, to just under $1.72.
- Compared to the same time in 2023, dry van linehaul rates were down 6.4% YoY, or $0.118, and sit 13.2% below the 5-year average.
- Initially reported average dry van contract rates excl. fuel registered a 1.0% growth MoM in January to $2.06 but remained 11.8% below the January 2023 average.
Dry Van Load-to-Truck Ratio
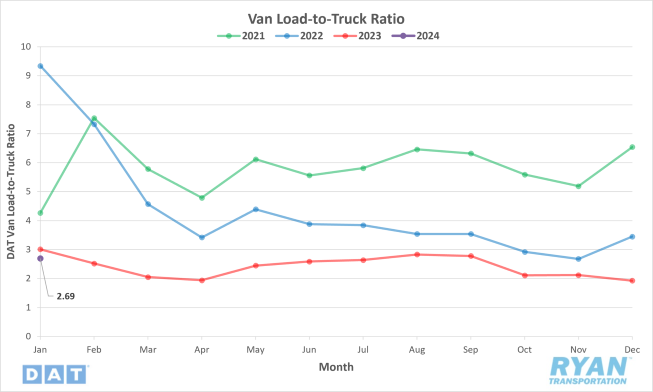
Key Points
- The dry van load-to-truck ratio (LTR) jumped 39.4% MoM in January but remains 10.6% below January 2023 levels.
Dry Van Market Conditions
Dry Van Summary
The first quarter, or “Quiet Season” in freight, is also impacted by a slowdown in Asian imports. However, dry van LTR showed a marked increase from December, jumping 39.4% MoM. January LTR started strong at 3.37, reflecting high demand relative to truck availability. Demand dropped drastically in the second week and LTR fell to 2.40. With the extreme cold during the third week of the month, reduced capacity caused a 25% jump in LTR to 2.91. The final week of the month saw freight volumes return to more normal levels and LTR finished the month at 2.69.
Looking ahead, February typically sees a decrease in import volumes due to Chinese New Year celebrations. February import volumes typically decrease around 20% compared to January. This year, CNY celebrations will last up to 16 days, but only the first seven are considered public holidays (February 10 – February 16). Imports from Asia following North America’s most prominent trade lane, the trans-Pacific lane, accounted for 68% of November 2023 total import volume. Chinese ports accounted for 54% to the United States. Los Angeles and Long Beach ports received 50% of twenty-foot equivalent (TEU) from Northeast Asia last month, so expect an impact on truckload demand in Southern California during the holiday.
As capacity continues to contract, carrier numbers are right around the level they were at the end of Q2 2020, when the pandemic upended the economy and demand crashed. To improve the national supply chain’s resiliency and strengthen America’s trucking workforce, the U.S. Department of Transportation’s (USDOT) Federal Moter Carrier Safety Administration (FMCSA) announced in late 2023 that it would award approximately $48 million in grant funding to increase CDL driver training opportunities and improve the training process. Some examples of projects funded include hiring state personnel to reduce CDL skills testing delays, improving CDL reporting, maintaining accurate driver records and training CDL examiners.
Linehaul rates remained relatively stable, aligning with forecasted projections and historical trends. January closed just under $1.72, marking the third consecutive monthly increase, up 3.6% MoM. Compared to last year, rates are down 6.4%, reflecting changes in market conditions and available capacity. Rates are currently sitting 13.2% below the 5-year average, showing how market conditions have evolved over time, but be on the lookout for trends and potential future developments.
Reefer Overview
Reefer Spot Rates
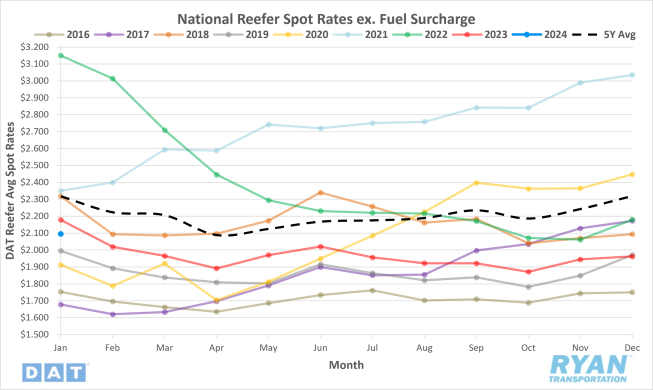
Key Points
- The national average reefer spot rate excl. fuel surcharge was up 6.8% MoM, or $0.134, in January to just under $2.10
- Average reefer linehaul rates were down 3.8% YoY, or $0.083, compared to the same time last year and were 9.5% below the 5-year average.
- Preliminary average contract rates excl. fuel fell 0.2% MoM, or $0.016, in January to $2.40 and are 7.1% below the January 2023 average.
Reefer Load-to-Truck Ratio
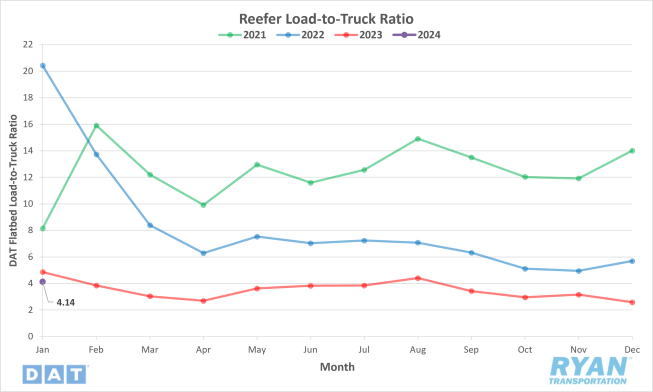
Key Points
- Similar to the dry van sector, the reefer LTR surged in January, increasing 60.5% MoM but remaining 14.8% below January 2023 levels.
Reefer Market Conditions
Reefer Summary
As the chart above shows, the reefer load-to-truck ratio (LTR) surged in January and is up 60.5% MoM but is also 14.8% below this time last year. The extreme cold weather that crossed the United States may have influenced the spike as shippers sought refrigerated equipment. Reefer spot rates were up 6.8% MoM, down 3.8% YoY, and 9.5% below the 5-year average. Rates fluctuated throughout the month, but there was a high demand for reefer capacity due to extreme temperatures. The PNW and four of the six produce regions in California showed slight shortages of trucks for loads of onions, potatoes and winter vegetables following heavy rains during the month.
Hurricanes Hillary and Otis hit the West Coast in late August and October, respectively. Both damaged regional onion crops that impacted volumes and prices four months later. The pack-out rate is the percentage of onions deemed acceptable for the fresh market. A possible outcome of these conditions was outbound reefer rates from Oregon and Pendelton reaching their highest level in nine years.
On the other side of the country, Philadelphia is home to the largest third-party reefer terminal in the U.S., the Packer Avenue Marine Terminal, with significant refrigerated cargo space and access to two class-one railroads. Philadelphia is the second largest reefer spot market in the DAT network, representing 3% of weekly volume, with nearby Wilmington, DE accounting for another 2%. Both markets are on the Delaware River and are key ports for refrigerated imports from South America. In 2022, 44% of South American produce imports arrived in Philadelphia-Camden with tropical fruits accounting for three-quarters of the volume. The top destinations for spot carriers include Boston, Toronto and Detroit, where load volume is up 19% YoY but rates are down 10% YoY.
Further south, Avocados From Mexico want to make a touchdown on Sunday, February 11, 2024. The Super Bowl is the biggest occasion of the year for Avocados From Mexico, with peak season coinciding with the event in Las Vegas. Reefer loads from Los Angeles to Las Vegas also saw significant increases in rates compared to the previous year. Over the course of the year, U.S. carriers will move around 95,000 truckloads of avocados with 97% crossing the Texas border, 55% crossing in Laredo, TX followed by 42% in Pharr, TX. According to the USDA, avocado imports are tracking 8% higher than last year. With the Super Bowl being held in the West, truckload volumes are shifting to Nogales, AZ in the Tucson market. According to Avocados From Mexico, the brand has almost doubled their import volume into the U.S. in seven years. Today, eight of every 10 avocados sold in the U.S. come from Mexico, with a record of nearly 2.5 billion pounds imported in 2023.
As winter continues, shippers will increasingly add freeze protection or protect-from-freeze (PFF) to bills of lading to keep traditional dry freight from freezing. For the FTL market, the refrigeration motor on the front of a reefer is ideal for maintaining a constant temperature. Cold season typically runs from October to March, with some of the coldest temperatures occurring in the Northeast, upper Midwest, Pacific Northwest and Canada, where reefer spot rates are rising. Certain commodities, including coffee, flour, chemicals, paints, wine, alcohol, perishable food and batteries, must maintain a temperature above-freezing throughout transit to maintain quality. The cost difference between a dry van and reefer can be substantial, and not all carriers have suitable cargo liability coverage. Our best advice is to communicate the requirements for the freight and make sure they are listed on the bill of lading.
Flatbed Overview
Flatbed Spot Rates
Key Points
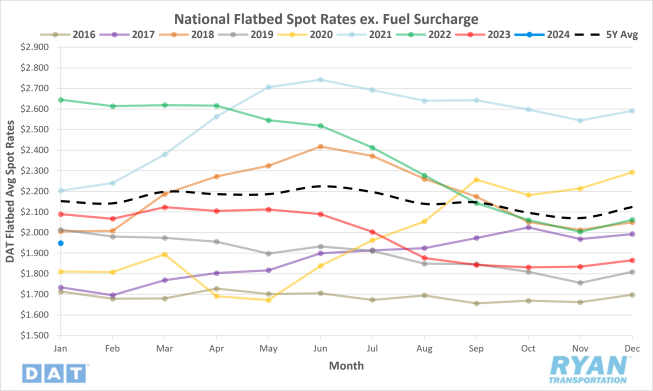
- The national average flatbed spot rate excl. fuel surcharge increased 4.5% MoM, or $0.083, in January to just under $1.95.
- Average flatbed linehaul spot rates were down 6.7% YoY, or $0.141, compared to January 2023 and remain 9.5% below the 5-year average.
- Initially reported average flatbed contract rates reflected a 0.9% increase MoM in January to $2.60 but remain 6.8% below the average flatbed contract rate in January 2023.
Flatbed Load-to-Truck Ratio
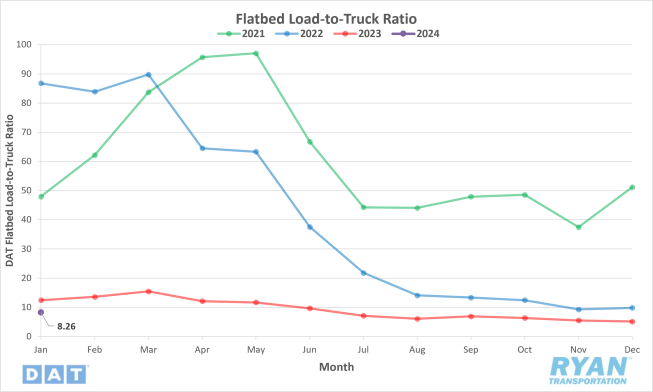
Key Points
- The flatbed LTR jumped 61.0% MoM in January but remains 33.8% below January 2023 levels.
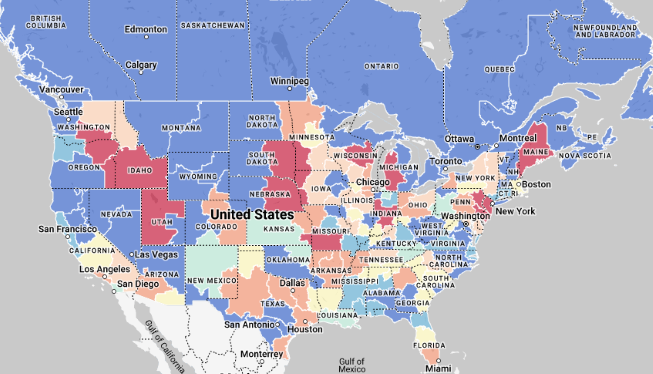
Flatbed Market Conditions
Flatbed Summary
Looking back to December 2023, flatbed demand remained soft. Cooling demand for oil and gas exploration and lower single-family housing construction were two factors. According to the U.S. Census Bureau, single-family starts plunged in December, dropping 8.6% compared to November. Flatbed demand for oil field freight, including drill pipe, casing and machinery, is being impacted by 20% fewer drilling rigs, according to data from Baker Hughes. Carriers are being paid around $0.50/mile less than last year on high-volume lanes to the west of Lubbock to the Permian oil basin, with volume down close to 8% YoY on the lane compared to this time last year. Even though U.S. oil production has been holding at or near record highs since last October, fewer drilling rigs have resulted in lower demand for flatbed loads to oil fields. About half of all drilling rigs are located in the Permian Basin, typically resulting in solid flatbed demand on the Houst-to-Lubbock lane. Volume on this lane is 2% lower YoY, but with ample capacity, rates have steadily declined about $0.40/mile over the last year.
The American Road & Transportation Builders Association (ARTBA) analyzed the 2023 DOT National Bridge Inventory (NBI) and found that 36% of all U.S. bridges require major repair work or replacement. Placed end-to-end, the 220,000 spans measure over 6,100 miles. As of the end of September 2023, states have committed $3.2 billion, or about 30% of available funds, to 2,060 different projects with $7.4 billion still to come. At the current rate of repair, it will take nearly 75 years to repair or replace them all, according to the ARTBA. The top five states with the most bridges in poor condition, as a percentage of total bridge inventory, are West Virginia (20%), Iowa (19%), South Dakota (17%), Rhode Island (15%) and Maine (15%). The states with the most bridges in poor condition are Iowa, Pennsylvania, Illinois, Missouri and Oklahoma. The bridge in most need of repair is in Los Angeles on I110 over Slauson Ave. With over 300,000 daily crossings, it more than doubles the California and national average daily crossing rate.
Gary Works is a major steel mill in Gary, IN and for many years was the world’s largest steel mill. This mill alone produces the equivalent of 250,000 flatbed steel loads annually. According to the American Iron and Steel Institute (AISI), Indiana accounts for around 25% of annual steel production, with Gary and South Bend markets accounting for 70% of outbound flatbed loads. Memphis, known as the “Supply Chain Capital of the World” and “America’s Distribution Center,” is a strategically centered transportation hub intersected by Interstates 40 and 55, the Mississippi River, and the convergence of east-west rail lines with north-south lines. Memphis has over 20% more outbound spot loads than inbound spot loads. According to Ted Townsend, President & CEO of the Greater Memphis Chamber, “Memphis is the global logistics leader because of our ‘Rs’: runway, river, road, and rail.” Memphis is expected to grow with the recent announcement of a new electrical steel line at U.S. Steel’s Big River Steel facility. For flatbed carriers, the 2,333-foot-long line is equivalent to almost 7,000 flatbeds annually.
Intermodal
Intermodal Spot Rates
Key Points
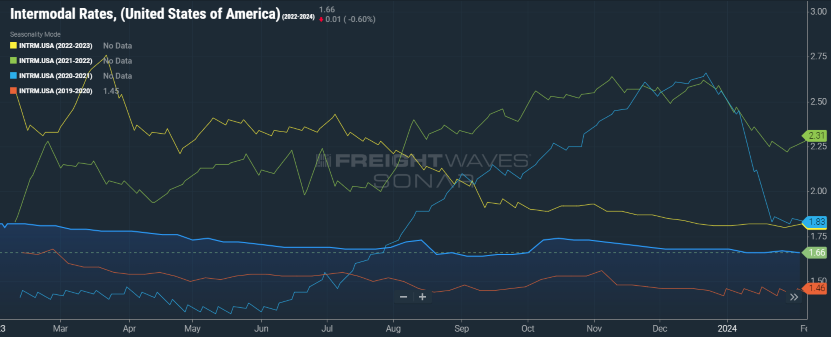
- The FreightWaves SONAR Intermodal Rates Index (INTRM.USA), which measures the average weekly all-in door-to-door intermodal spot rate for 53’ dry vans across a majority of origin-destination pairings, declined by $0.02 MoM to $1.66 in January.
- Compared to January 2023, intermodal spot rates were down 8.8% and sit 8.3% below the 5-year average.
Intermodal Volumes
Key Points
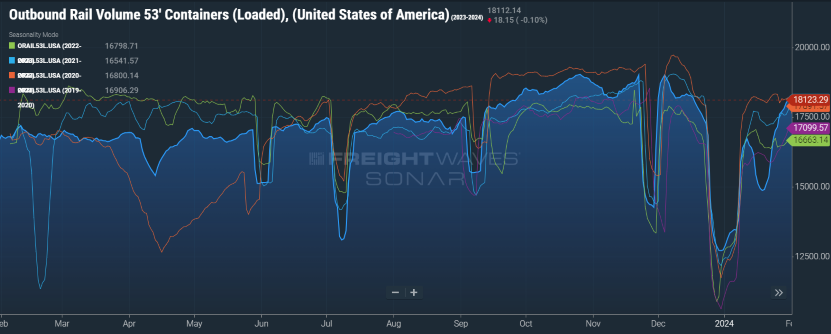
- Total loaded volumes for 53’ containers from all domestic markets, measured by the FreightWaves SONAR Loaded Outbound Rail Volume Index (ORAIL53L.USA), increased 42.3% MoM in January.
- Total loaded volumes in January were 8.8% higher compared to January 2023 and are 3.1% higher than the 5-year average.
Intermodal Summary
The first month of 2024 provided little relief to the intermodal sector from the difficult year faced by the industry in 2023. Volumes started the year off sluggish as they worked to recover from the dramatic drop-off that occurred as a result of the holidays. The rally to return to normal levels after the first week was cut short halfway through the month, as winter storms that swept the country impacted hubs and caused delays. Outbound volumes were able to recover in the final weeks of January to ultimately end the month above January 2023 levels but were unable to capitalize on the momentum that had been building in the final three months of last year.
Since MoM comparisons were skewed because of holiday disruptions, looking at mid-month comparisons to eliminate the holiday static reflects a drop in total volumes of 15.5% MoM in January. Compared to mid-month comparisons in January 2023 and December 2022, outbound volumes were down just 1.8% MoM in January, highlighting the negative impact that the inclement weather had on volume builds. Forecasts for volumes in 2024 look a little more promising, but are primarily driven by an uptick in international volumes as domestic forecasts alone are still projected to dip this year.
Intermodal rates also suffered in January as the competitive landscape within the truckload industry continues to rear its ugly head. Domestic spot rates dropped by another penny in January and a full $1.10 below their March 2022 peak of $2.76. Further deterioration in the truckload sector continues to apply negative pressure on rail rates, with the FreightWaves SONAR Intermodal Contract Savings Index (IMCSI1.USA), a measure of the discount that intermodal provides compared to dry vans, recordings its lowest ever point of 6.5% just after the first week in January. Savings via the rail hovered around this low mark for much of the month before jumping half of a point to end January just over 7%.
Further Reading
- Red Sea cargo diversions could affect 2024 holiday shipping - FreightWaves
- January Class 8 Truck Orders Start 2024 Strong - Transport Topics
- February Descartes Global Shipping Report highlights solid annual and sequential import growth - Logistics Management