
Executive Summary
The transportation industry’s conditions appear to be reflecting the broader economic trends as both sectors search for stability amidst positive signs of recovery and growth.
Economic indicators remain a mixed bag, as consumer and industrial activity registered gains in March but were overshadowed by a disappointing Q1 GDP figure. Output growth slowed to 1.6% last quarter, well below initial estimates and of the 3.4% growth recorded in Q4 2023. The drop-off came from a reduction in government spending and an increase in the trade deficit, with exports decreasing and imports increasing. A hotter-than-expected PCE report in March tempered any expectations of interest rate cuts at the next Federal Reserve meeting in June, as inflation appears stickier than anticipated. However, a softer increase in payroll employment and an uptick in unemployment in April calmed concerns of an overheated economy.
The truckload sector continues to grapple with excess capacity hampering recovery efforts, despite a resiliency in demand and a fairly stable rate environment. Although the supply glut has worked towards correction, it remains well above pre-pandemic levels as the market heads into peak summer shipping season. Meanwhile, the rail industry continues to see improvements in intermodal volumes and service, but deterioration in carload volumes and overall rates. Finally, import activity has remained strong for the maritime sector despite the closure of the Port of Baltimore. U.S. container imports continued its streak of YoY gains in April, registering 9.3% higher compared to April 2023 and 15.1% higher compared to the same month in 2019.
Main Takeaways
- Economy: Manufacturing activity returned to contraction territory in April, driven by a decline in new orders and production.
- Truckload Rates: Average rates remained relatively stable in April, suggesting a potential for adjustment in either direction in the coming months.
- Truckload Demand: Freight volumes were remarkably resilient despite April being known for its historically weak demand levels.
- Truckload Supply: Excess supply continued to plague the market in April, leading to ongoing rate pressure and a shift in shipper-carrier dynamics towards cost-saving strategies.
- Truckload Capacity Outlook: The carrier population resumed its decline in April, driven by a surge in net revocations, while equipment demand remains mixed.
- Fuel: Supply disruption fears in April failed to buoy fuel prices amidst weakening demand ahead of the summer driving season.
- OTR By Mode
- Dry Van: Despite moderate strength MoM in demand, dry van spot rates struggle to find footing amidst excess supply.
- Reefer: Conditions in the refrigerated sector continued to deteriorate ahead of peak produce shipping season ramping up.
- Flatbed: The flatbed sector continues to outperform the other major modes as construction activity ramps up but is still underperforming from a historical standpoint.
- Intermodal: Intermodal volumes continued to expand in April while rates declined to remain competitive with weak truckload conditions.
Industry Overview
April Key Figures (YoY)
| Truck Data Points | YoY% Change |
| DAT Spot Rates (incl. FSC) | -4.1% q |
| Fuel Prices | -2.4% q |
| ACT Class 8 Preliminary Orders | 34.7% p |
| ATA NSA Truck Tonnage* | -5.0% q |
| Cass Freight Index | -3.8% q |
| Cass Freight Expenditures | -16.8% q |
| Cass Freight Shipments | -4.0% q |
*Report released 4/23/24
Economy
United States ISM Manufacturing PMI
Key Points
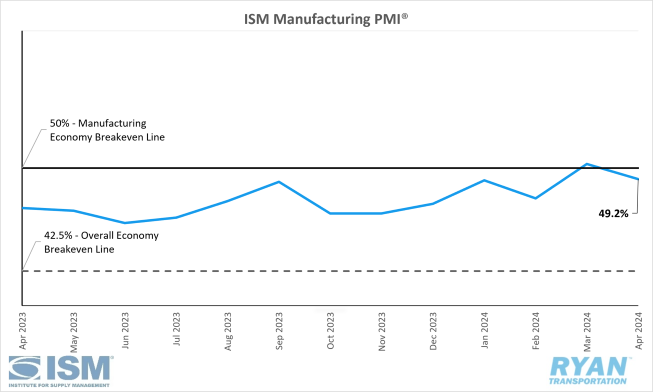
- The Institute of Supply Management (ISM) Manufacturing PMI® registered 49.2% in April, a 1.1% decrease from the 50.3% figure recorded in March
- The New Orders Index moved back into contraction territory after one month of expansion, dropping 2.3% from 51.4% in March to 49.1% in April.
- The Production Index dropped 3.3% in April to 51.3% but remains in expansion territory for the second consecutive month.
- The Prices Index registered 60.9% in April, a 5.1% increase from the 55.8% recorded in March.
- The Backlog of Orders Index registered a 0.9% decrease from 46.3% recorded in March to 45.4% in April and moved deeper into contraction territory.
Summary
Manufacturing activity in the U.S. moved back into contraction territory in April after expanding in March for the first time since September 2022. In terms of the overall economy, April’s Manufacturing PMI® reading marked the 48consecutive months of expansion after one month of contraction in April 2020. Based on the past relationship between the Manufacturing PMI® and the overall economy, April’s reading of 49.2% corresponds to a positive change of 1.9% in real GDP on an annualized basis, according to the ISM report.
The demand components reflected softening as the New Orders Index dropped back into contraction territory following two months of expansion. The decline in new orders came despite fewer comments from panelists regarding softening, according to the ISM report. Customers’ inventories moved back to “just right” levels after hovering in the low end of “too low” territory for the first three months of the year. Finally, the Backlog of Orders Index remained in moderate contraction, dropping from the levels recorded in March.
The Production and Employment indices, used to measure output activity from the survey, moderated in April compared to March. According to ISM’s reporting, both indices combined for a 2.1% negative impact on the Manufacturing PMI® calculation. Production continued to expand in April but dropped back slightly with survey panelists reporting marginally improved output levels compared to March. Meanwhile, employment levels improved in April as headcount reduction eased, with companies reporting layoff activity accounting for 50% of total reductions (compared to 76% in March) along with attrition and hiring freezes.
The input components of the Manufacturing PMI® continued to accommodate future demand growth, with supplier deliveries getting faster and inventories remaining flat. The largest setback to inputs came with further increases in the Prices Index, which recorded its highest reading since June 2022. According to Timothy Fiore, Chair of the Institute for Supply Management® Manufacturing Business Survey Committee, foundational commodities such as steel, aluminum and plastic resins continued to be nagging inflation drivers.
Why it Matters:
The drop in the Manufacturing PMI® in April was a mild contraction that’s likely a bump in the road towards a recovery in the manufacturing sector. According to Fiore, April’s figure is an example of the psychological difference between a number coming in slightly above or below a target or breakeven point. The difference between the March and April reading is slim and borders either side of the 50% breakeven point, but there’s an emotional impact to it.
Demand remains at the early stages of recovery and continues to show signs of improving conditions. Production execution continuing to expand while headcount reductions easing were encouraging signs for future growth in manufacturing activity in the U.S. Of the six biggest manufacturing industries; Chemical Products; Transportation Equipment; Food, Beverage & Tobacco Products; Computer & Electronic Products; Machinery and Fabricated Metal Products; two (Transportation Equipment and Chemical Products) registered growth in April.
The most disappointing aspect of the April report came from the 5.1% surge in the Prices Index as price figures continued to pick up. April marks the second consecutive month that the index has registered above 55% and is spread across many commodities. This could have an impact on the Federal Reserve’s future decisions towards interest rates, as any further increases would be a major setback to continued expansion in the sector.
Macro Economy
- Total nonfarm payroll employment rose by 175,000 jobs in April on a seasonally adjusted basis after downward revisions to February and March figures but fell short of the +243,000 consensus and +315,000 jobs added in March, according to the latest jobs report released by the Bureau of Labor Statistics (BLS).
- The unemployment rate ticked up to 3.9% in April, 0.1% higher than the 3.8% recorded in March.
- Total Transportation and Warehousing employment rose by 21,800 jobs in April.
- Truck Transportation declined slightly by 300 jobs after downward revisions to February and March estimates.
- Warehousing and Storage added 7,800 jobs in April.
- Both headline and core Personal Consumption Expenditures (PCE) Price Index, the Fed’s preferred gauge for measuring inflation, increased 0.3% MoM in March on a seasonally adjusted basis, according to the most recent report from the Bureau of Economic Analysis (BEA).
- On an annual basis, the all-items PCE Price Index rose 2.7% in March on a seasonally adjusted basis, a 0.2% increase from February’s reading of 2.5%.
- Excluding food and energy, the core PCE Price Index went unchanged in March from February, rising 2.8% on a 12-month seasonally adjusted basis.
Truckload Rates
Spot Rates
Key Points
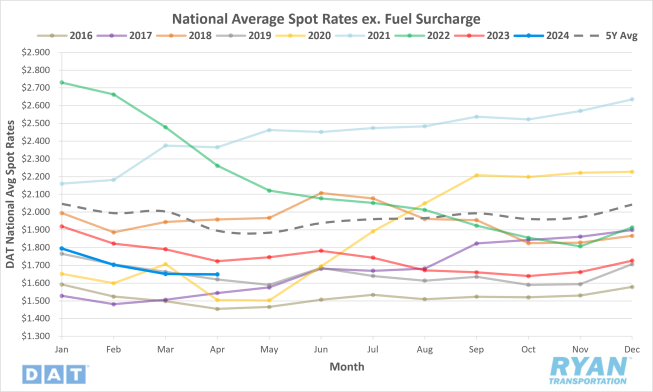
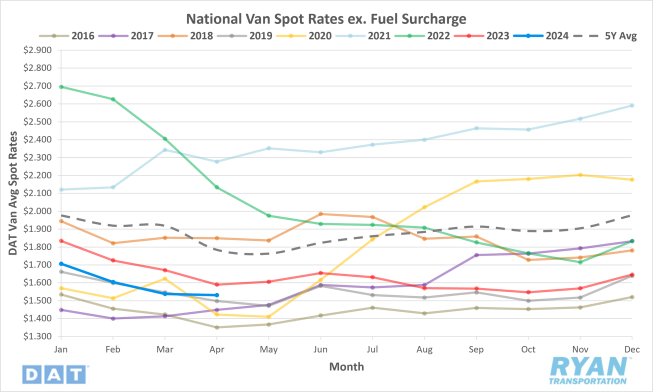
- The national average spot rate, excluding a fuel surcharge, was relatively flat MoM, dropping 0.1%, or $0.002, in April.
- Compared to the same time last year, national average spot linehaul rates were down 4.2% YoY, or $0.073, and remain 12.9% below the 5-year average.
Contract Rates
Key Points
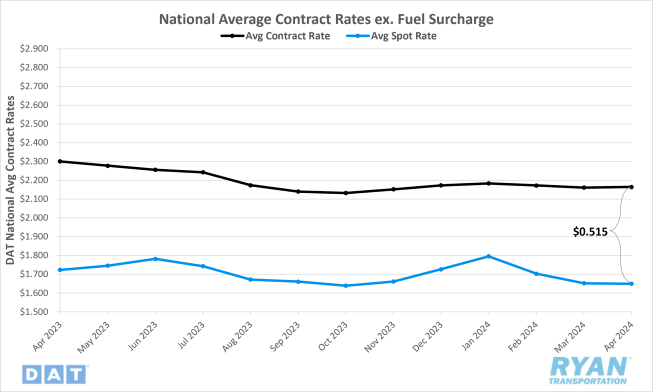
- Initially reported average contract rates not inclusive of fuel increased slightly by 0.2% MoM in April.
- On an annual basis, average contract linehaul rates were down 5.9% YoY in April.
- Following downward revisions to March’s initially reported contract rates, the contract-to-spot spread widened further slightly in April, increasing from $0.509 in March to $0.515.
Summary
Average linehaul spot rates were relatively stable in April, remaining virtually unchanged from March and outperforming typical seasonality for this time of the year. The 0.1% MoM decline in spot rates came in well below the 3% seasonal average decline between March and April, and narrowly beat out the 0.5% pre-pandemic average decline during the same time frame. Much of the stability reflected in April’s average spot rate stemmed from consecutive WoW gains in the final two weeks of the month, recorded by the DAT 7-day average linehaul spot rate index. Through the first three weeks of April, the 7-day running average registered moderate sequential declines totaling just over a penny per mile. The negative trend reversed course to close out the month, jumping nearly $0.03 in the final weeks to end April above where they started.
On the contract side, initially reported contract rates were also essentially flat MoM, registering an increase of just $0.004 in April. Since contract rates are generally reported on a two-week delay, the true impact of the most recent bid cycle has yet to be reflected in the data. Despite the slight increase and decrease in contract and spot rates, the contract-to-spot rate spread remains well above the normal range at $0.52. With contract rates sitting roughly 30% higher than spot rates, this indicates there is still room for either contract rates to come down or spot rates to increase.
Why It Matters:
Spot rates outperforming seasonality and remaining relatively flat in April, which was absent from any major disruptions, is a good indicator that the market remains in the early stages of recovery. Breaking down the monthly spot rate linehaul average by mode reflects the characteristics of somewhat normal market conditions. Dry van rates eased slightly while tightening in the flatbed markets offset larger declines recorded across the refrigerated sector. On an even more granular level, the drop in reefer rates on a weekly basis were nearly in line with expectations as well. WoW declines were isolated in the front half of the month before jumping $0.05 in the back half, coinciding with the traditional uptick in early produce shipping.
For the contract market, the implementation of new rates from the most recent RFP cycle, of which shippers held a significant amount of pricing power, has yet to show up in the data. With many shippers updating routing guides in April and May, average contract rates not inclusive of fuel will likely see some steep discounts in the coming months. With contract rates set to drop over the next few months while produce and beverage seasons ramp up, adding positive pressure to spot rates, we expect to see the spread between contract and spot rates to narrow closer to the pre-pandemic average range.
Truckload Demand
Key Points
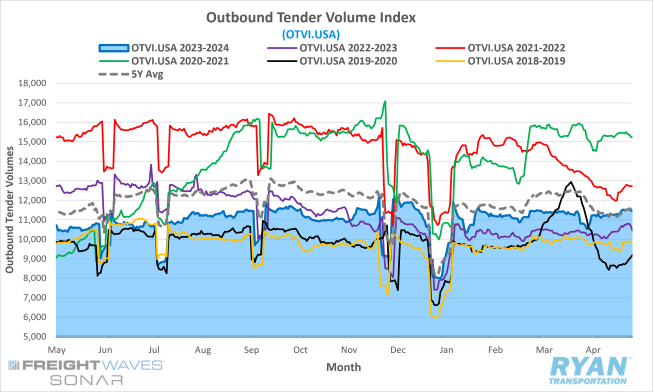
- The FreightWaves SONAR Outbound Tender Volume Index (OTVI.USA), a measure of contracted tender volumes across all modes, ended April 6.2% above the levels 30 days prior at the end of March.
- The monthly average of daily tender volumes was down 0.8% MoM in April, dropping from 11,326.14 in March to 11,229.98.
Average daily tender volumes in April were 8.5% above the same time last year and registered 1.7% below the 5-year average.
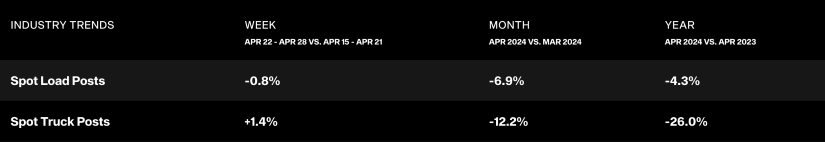
- Spot market volumes in April fell 6.9% MoM, while YoY comparisons appeared more favorable with volumes registering just 4.3% below 2023 levels.
- The Cass Freight Index Report, which analyzes the number of freight shipments in North America and the total dollar value spent on those shipments, decreased in April on a monthly basis for shipments by 1.3% and was unchanged for expenditures. Both, however, remain below YoY levels by 4.0% and 16.8%, respectively.
Summary
As it has since the start of the year, truckload demand remained relatively stable in April as the first quarter transitioned to the second. After opening the month slowly following the Easter weekend at the end of March, tender volumes recorded by the OTVI jumped just over 4% in the first week of April. Following the week one rebound, volumes moderated slightly through much of the month before ticking up another 2% in the final week. Despite demand remaining resilient through April, the lull in freight activity at the end of March due to Easter skews the true MoM growth in volumes. Looking at mid-month comparisons, April levels were down roughly 1.4% MoM and are more in line with the 0.8% decline in the monthly average of daily tender volumes. Meanwhile, tender volumes continue to reflect growth YoY, increasing by 8.5% and narrowing the gap between the long-term average, a strong sign of a market recovery being underway.
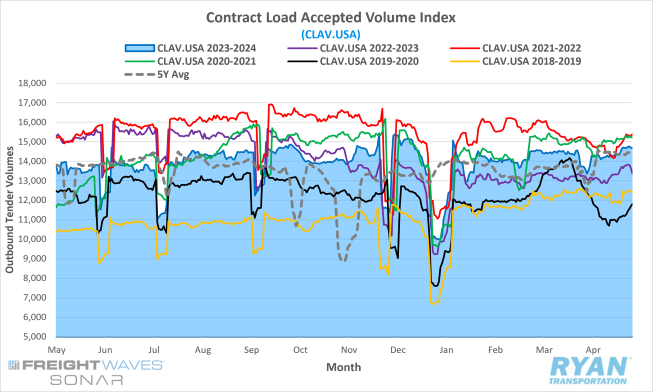
Though conditions are showing signs of slowly improving, overall volumes continue to funnel primarily through the contract market compared to the spot market. The FreightWaves SONAR Contract Load Accepted Volume Index (CLAV.USA), shown below, which is similar to the OTVI but removes tender rejections, was down 0.8% MoM but was 7.5% higher YoY, further highlighting the strength and stability of demand in April.
Spot market activity dropped off in April after surging just over 12% in March. While MoM comparisons remain volatile, annual comps have become more favorable as the market continues treading along the bottom. The 4.3% YoY decline in spot market volumes recorded in April is the second lowest YoY comparison, behind February of this year, since the initial downturn of the current cycle. According to the Cass Freight Index Report from March, which saw a 0.2% MoM decline in shipments, for-hire demand remains broadly consistent but continues to be overshadowed by excess capacity.
Why It Matters:
April is generally not the pinnacle of freight activity during the year, with Chinese imports tailing off following the Lunar New Year and produce season not quite at its tipping point. Although typical seasonality suggests softening, the continued stability in demand made April 2024 a relatively solid month for shippers. Tender volumes through the first four months of the year have consistently outpaced the same period in 2023. This suggests that the worst of the freight recession is in the rearview.
The timing of the resiliency in freight demand will be important, for a number of reasons, for the timeline of the market returning to balance. For starters, at their present levels, the additional volumes brought on by peak produce shipping season could result in a degree of tightening across the market and create upward pressure on rates. By this logic, the timeframe could extend by prolonging excess capacity from leaving the market. Should the additional volumes be absorbed without disruption or impact on rates, as it has over the last two years, it could be the final straw for many carriers anticipating the first scenario to play out. Any sort of mass exodus prior to Q3, ahead of peak import and retail season, could tilt the scales sooner rather than later.
Truckload Supply
Key Points
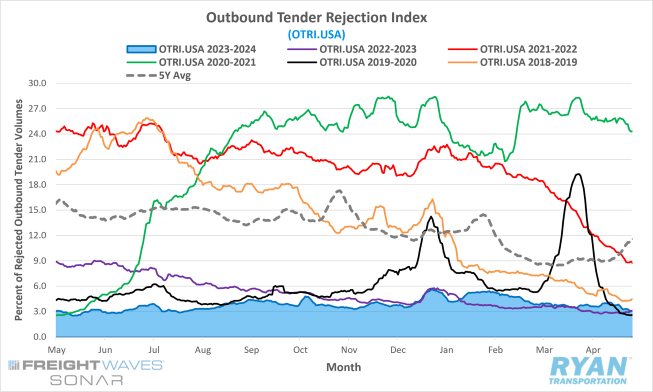
- The FreightWaves SONAR Outbound Tender Rejection Index (OTRI.USA), a measure of relative capacity based on carriers’ willingness to accept freight volumes under contract reflected as a percentage, ended April at 3.08%, which is 65 basis points (bps) lower than the 30 days prior at the end of March.
- The monthly average of daily tender rejections registered 3.66% in April, 0.08% below the 3.74% recorded in March.
- Compared to April 2023, the monthly average of tender rejections was 0.8% higher last month and sit 6.42% below the 5-year average.
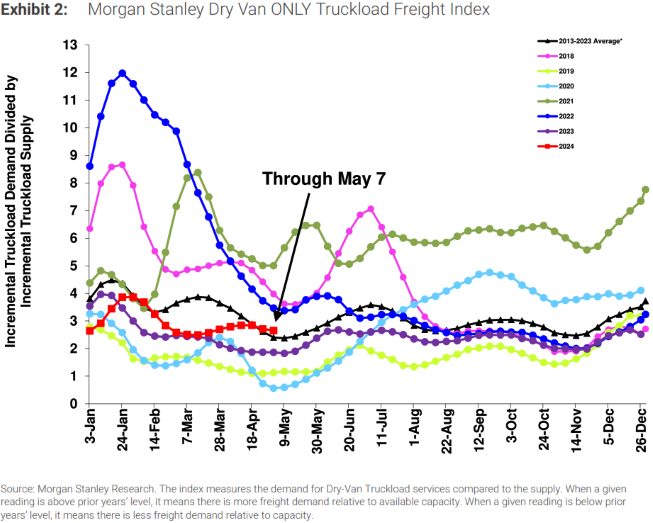
- Despite decreasing sequentially throughout much of April, the Morgan Stanley Truckload Freight Index (MSTLFI) continued to outperform seasonality, driven primarily by demand, for the second month in a row and has moved above the long-term average.
Summary
Coming off Easter weekend, rejection rates recorded by the Outbound Tender Rejection Index jumped 40 bps from the week prior to open the month at 3.78%. Tender rejections moderated in the front half of the month, dropping off through the first week before jumping roughly 50 bps in the second week to reach their peak of just over 4% halfway through the month. The back half of the month carried a different tune, however, as tender rejections registered steady declines, with the rejection index closing out April almost a full percentage point lower than its mid-month peak.
Despite briefly eclipsing the 4% mark for the first time since the end of February, average rejection rates in April fell MoM for the third consecutive month. Through the first four months of the year, average OTRI values have fallen 1.22% from the average levels recorded in January. Though monthly tender rejections have been steadily declining since January, YoY comparisons remain elevated. Compared to the same month last year, when the rejection index ultimately found its floor at 2.9%, average tender rejections in April were 0.8% higher and barely outpaced the 2023 average of 3.62%.
Why It Matters:
April’s data continued to reflect a market being constrained by an oversaturation of truckload supply amidst strengthening demand levels. While there are some signs that supply has contracted to some extent, there remains an abundant supply of carriers that is further depressing market conditions. As excess capacity lingers, shippers continue to force rates down to maximize cost savings through mini-bids and shorter-term bid cycles. According to the recent Morgan Stanley truckload sentiment survey, the ongoing supply glut is beginning to squeeze larger carriers, forcing some to draw a line on further rate concessions. This has led to a higher percentage change in carrier partnerships amongst shippers, with many seeking out second tier sources for further discounts.
Despite the further deterioration of truckload rates, carriers continue to focus on protecting market share of awarded contract freight, as evident by the steady decline in tender rejections. As new routing guides from the most recent RFP process go into effect in May, average rejection rates have likely not found their floor yet for 2024. From a historical standpoint, with the exception of last year, tender rejections typically fall another 1.35% on average between April and May. This indicates the potential for further rate discounts in the coming months, as long as rejection rates continue to average below 5%.
Truckload Capacity Outlook
Key Points
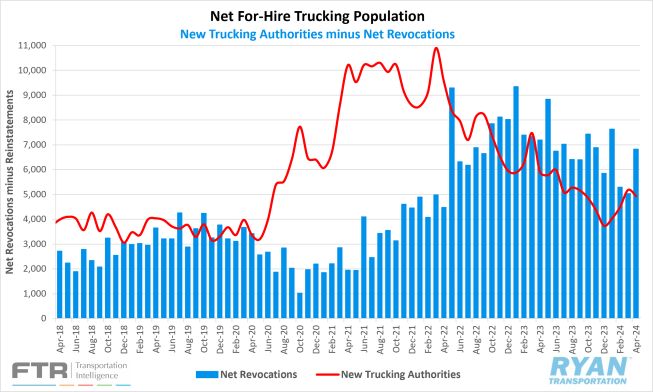
- Total net revocations, a measure of total authority revocations minus the number of reinstatements, increased significantly in April by just under 1,800 carriers, jumping from 5,034 revocations in March to 6,830.
- The number of newly authorized for-hire trucking companies dropped in April by 251 carriers, falling from 5,187 new authorizations in March to 4,936 in April.
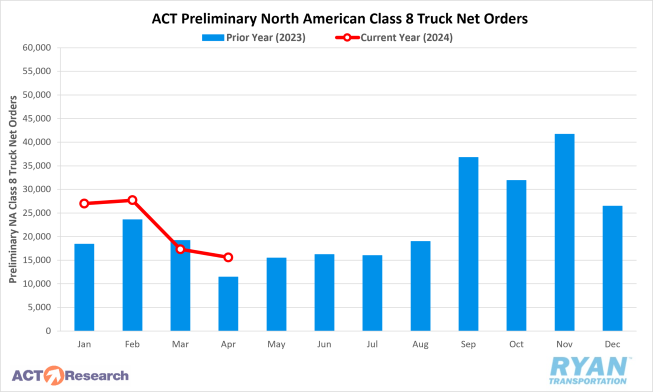
- Depending on the source, preliminary North American Class 8 Order estimates in April ranged from 14,000 units reported by FTR and 15,600 units according to ACT Research’s analysis, with both estimates reflecting annual gains of 12.5% and 34.5%, respectively.
Summary
After a slight increase in March broke an 11-month streak of consecutive declines, the net change in the for-hire carrier population resumed its negative trend in April, falling by 1,894 carriers. The change was primarily driven by a surge in net revocations recorded by the Federal Motor Carrier Safety Administration, according to preliminary analysis by FTR. The increase in net revocations of nearly 1,800 carriers in April marked the single highest MoM increase since May 2022, near the beginning of the current market downturn, when net revocations rose by just over 4,800 carriers.
According to FTR’s analysis of the FMCSA data, the for-hire carrier population has now declined in 17 of the last 19 months. This is still well short of the streak set during the Great Recession when the population declined in 28 out of 30 months between October 2007 and March 2010. However, despite the steady declines recorded over the last year and a half, it pales in comparison to the influx of new authorities that entered the market between July 2020 and April 2022. According to FTR, the industry still has about 92,000 more active for-hire trucking firms than it did before July 2020.
Meanwhile, equipment demand has been a mixed bag of projections, with some sources noting relatively healthy ordering levels and others indicating signs of weakness. According to ACT Research, despite preliminary class 8 orders registering roughly 34% higher YoY in April, current demand levels are in line with expectations of historical weakness in Q2 and a truckload market at the bottom of its profitability cycle. FTR’s analysis, however, noted a market still performing at a solid level with YoY orders increasing over 12% in April and still performing slightly above replacement demand level. Both outlets reported order demand continues to stem from private fleet expansion and certain vocational segments, such as construction and agriculture, while for-hire carriers continue to lack confidence and certainty around future market health.
Why It Matters:
Following April’s significant decline in the for-hire carrier population, the slight increase in March, similar to March 2023, appeared to just be an outlier and not an indication of a market shift. The high number of net revocations in April continued to primarily affect smaller, one- and two-truck carriers, though news of larger fleets shutting their doors has become increasingly common. FTR noted that one factor for the higher number of revocations in April resulted from the month having five Mondays. Based on FTR’s analysis, the FMCSA processes far more revocations on Mondays than it does any other day of the week.
While the changes in active for-hire trucking authorities reported by the FMCSA help provide some insight into current capacity levels, it does not paint the entire picture of the oversaturation of supply. Payroll employment for general freight truckload carriers remains elevated compared to pre-pandemic driven surge in 2020. According to FTR’s analysis of BLS data, payroll employment peaked between October 2022 and May 2023 and has only dropped by roughly 1.5% in the last year and a half. Compared to March 2020, total driver capacity for U.S. for-hire carriers of property, excluding parcel and private fleets, is up 14.7%. The closure of Yellow last year dropped that figure significantly and sits at 15.8% when excluded from data.
The overcapacity situation continues to keep FTR’s Active Utilization Index below the 10-year average of 92% with the index currently sitting just below 90%. Based on FTR’s forecast, active utilization is projected to surpass 92% by the end of 2024 and rise steadily throughout 2025. According to FTR’s reporting, active utilization adds upward pressure on spot rates around 94-95%, which the index is projected to reach by the middle of 2025.
Fuel Prices
Key Points
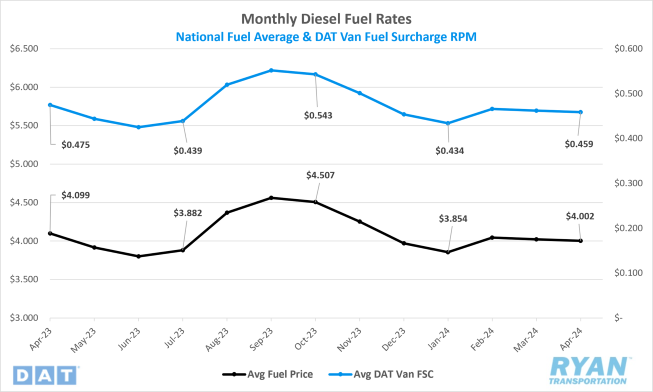
- The national average price of diesel fell 0.5%, or $0.020, in April.
- At $4.002, the average price of fuel is down 2.4%, or $0.097, compared to April 2023.
- Builds on U.S. crude reserves outpaced draws in April for the third month in a row, with the net change in commercial crude inventories increasing by 12.1M barrels (bbls) compared to the 3.3M bbls consensus for the weeks ending April 5 and April 26.
Summary
Average diesel prices moderated in April but have ultimately remained relatively stable since February, hovering just above $4.00 for the last three months. After falling roughly $0.04 WoW to open the month, average diesel prices dipped just below $4.00 to $3.996 for the first time since February 5. The sub-$4.00 levels were short-lived, however, as the benchmark price of diesel jumped $0.07 WoW in the second week to just over $4.06 per gallon. The second week’s increase would be the last in April, as prices registered steady declines through the remainder of the month to end up just under $0.05 lower than where they started and just over $0.07 lower than the same week last year.
In somewhat surprising fashion, builds on crude inventories outpaced draws in April when the opposite typically holds true during this time of year, according to U.S. Energy Information Administration’s (EIA) weekly reports. Concerns about supply disruptions early in the month from a potential conflict between Israel and Iran saw commercial crude stockpiles increase through the first two weeks of the month. Oil futures reacted similarly, as the settlement price for Brent Crude climbed from $87 per bbl to over $91 at the start of the month, remaining there for several days. As tensions eased and an immediate war was ultimately subverted, crude inventories decreased by 6.4M bbls and Brent Crude futures settled back to $87 at the start of the third week.
Why It Matters:
The continuous news cycle out of the Middle East that threatens to shock global oil supply levels has remained ineffective in the long term against further weakening demand levels. Initial concerns of a war between Israel and Iran renewed talks of barrel prices reaching $100 early in April, but those talks were quickly extinguished as violence in the Middle East continue to have no impact on supplies from the region. OPEC+ is also expected to extend its voluntary production cuts through June, according to many analysts. However, there is mounting speculation that the June meeting of the oil cartel could expose cracks in the alliance following the recent announcement by the United Arab Emirates that it had raised its production capacity by 200,000 bbls per day.
Further concerns surrounding oil demand stem from U.S. gasoline demand, with recent data showing domestic gasoline stocks have been growing by 915K bbls. According to data released by the EIA, U.S. gasoline and diesel demand are at their weakest level since the pandemic. The erosion in demand has allowed inventories to build to the point that there is more than ample supply heading into the travel-heavy summer driving months. This is especially concerning as the spring refinery maintenance season nears an end and more supply becomes available in the market.
Dry Van Overview
Dry Van Spot Rates
Key Points
- The national average dry van spot rate excluding fuel declined 0.5% MoM, or $0.01, in April to $1.531.
- Compared to the same time last year, average dry van spot linehaul rates in April were 3.7% lower and remain 14.2% below the 5-year average.
- Initially reported average dry van contract rates exclusive of fuel registered a slight decline of 0.3% MoM in April and was 7.6% below April 2023 levels
Dry Van Load-to-Truck Ratio
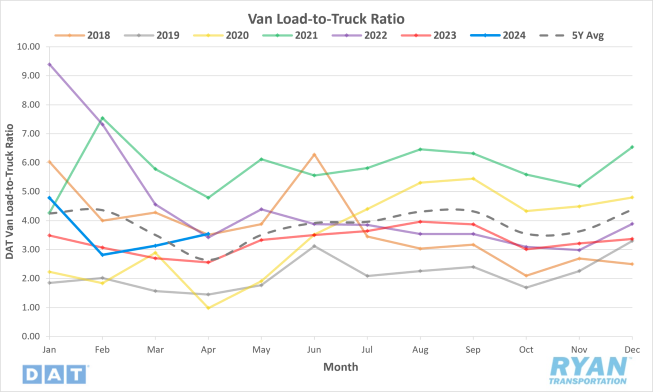
Key Points
- The dry van load-to-truck ratio (LTR) registered 3.54 in April, a 13.1% MoM increase from March and 38.3% higher than April 2023.
Dry Van Market Conditions
Dry Van Summary
The dry van sector experienced a mixed performance in April, as the moderate gains in demand continue to be easily absorbed by the oversaturation of carriers still in the market. The 13% MoM gain in the load-to-truck ratio was buoyed by resilient consumer spending and relatively stable retail inventories. However, while the lingering capacity glut continued to exert downward pressure on spot rates, the declines outperformed typical seasonality for this time of year. As April is traditionally considered a weaker month in the freight industry, the modest drop in rates is a positive indication that supply levels are continuing to correct towards rebalance.
In the broader freight industry, there's been a notable slowdown in the rate of interstate carrier exits in the first quarter, accompanied by an increase in new entrants. This trend suggests a mix of challenges and opportunities within the industry, with some carriers unable to sustain higher operating costs while others capitalize on lower-cost bases. Importantly, there's a nuanced shift in the long-haul sector, where despite losing a significant number of carriers, the influx of new and reactivated authorities almost equals deactivations, signaling a nearing equilibrium in the market post-pandemic.
Additionally, there's a focus on import dynamics, particularly with China, where U.S. Treasury Secretary Janet Yellen warned against industries being decimated by Chinese imports. Despite increased import volumes, particularly from China, there's a notable impact on domestic manufacturing, which traditionally drives demand for trucking services. According to Professor Jason Miller, a supply chain expert at Michigan State University, despite the solid YoY gains in imports and retail trade sales, most for-hire trucking demand is driven by domestic manufacturing. Miller stated, “For the dry van truckload market to turn from bear to bull, we either need a much larger loss of capacity or for demand to improve substantially, neither of which is to happen quickly.”
Reefer Overview
Reefer Spot Rates
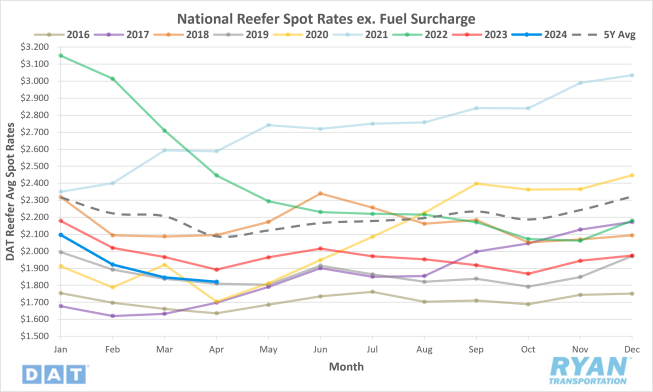
Key Points
- The national average reefer spot rate excluding fuel dropped 1.4% MoM, or $0.026, in April to $1.820.
- Average reefer spot linehaul rates were down 3.8% on an annual basis and sit 12.8% below the 5-year average.
- Initially reported average contract rates excluding a fuel surcharge for reefers fell 0.3% MoM in April and are 5.5% lower than April 2023 levels.
Reefer Load-to-Truck Ratio
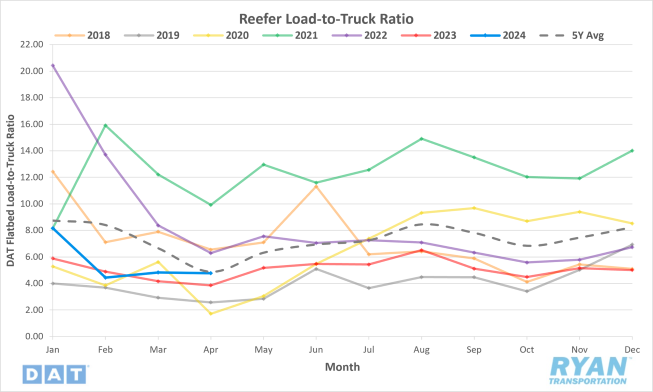
Key Points
- The reefer LTR registered 4.78 in April, down 1% MoM from March but 23.8% higher than the same time last year.
Reefer Market Conditions
Reefer Summary
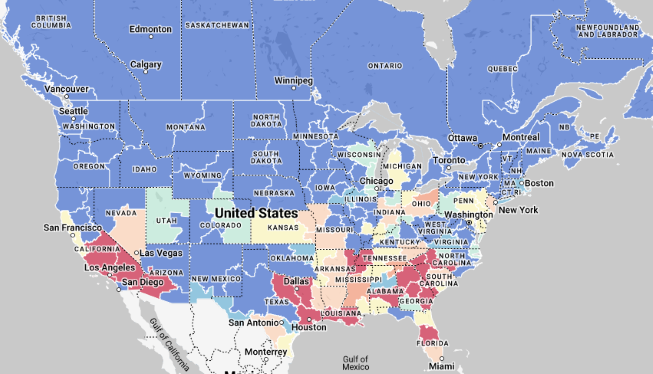
The produce season is gearing up, with peach trees blossoming and strawberries ready for picking, indicating the start of the 2024 produce season. Growers in regions like Georgia's heartland have a rich history, with advancements like hydro-cooling systems enhancing produce quality. Leafy green production in Yuma, AZ, is transitioning back to the Salinas Valley in California, impacting shipping patterns and reefer carrier operations.
The Pacific Northwest (PNW) recently reported a slight surplus of trucks due to a 1% increase in produce volume, with significant growth seen in apple, pear, potato and onion volumes compared to last year. However, south and central Florida experienced a shortage of trucks for loading produce in late April due to the 26th Annual 75 Chrome Shop truck show, though it's expected to catch up as the peak season typically occurs in mid to late May. Tomatoes, strawberries and cabbage are the primary commodities being shipped, with strawberries seeing a significant increase in shipments while tomato volumes are slightly lower than last year.
California's cherry season is returning to historical norms after a slower start last year, with early varieties expected to debut around April 25. The Mexican produce season is peaking, albeit with signs of an early peak due to weaker consumer demand in the U.S. Reefer carriers are adjusting to shifting volumes and prices, with McAllen, TX and Nogales, AZ serving as major ports of entry for produce. Additionally, Florida and Texas markets are experiencing fluctuations in rates and volumes as the produce season progresses.
Flatbed Overview
Flatbed Spot Rates
Key Points
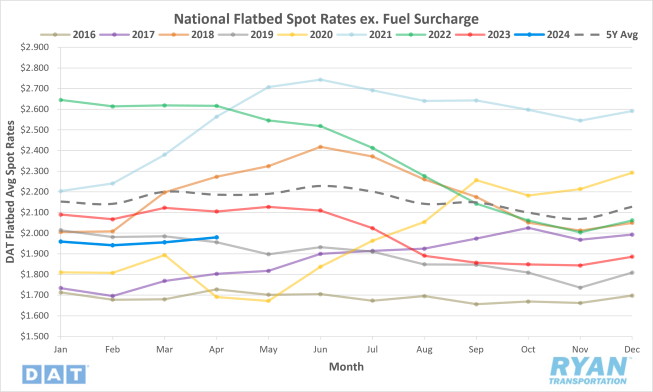
- The national average flatbed spot rate excluding fuel increased 1.2% MoM, or $0.04, in April to $1.98.
- On an annual basis, average flatbed spot linehaul rates were 5.9% lower compared to April 2023 and 9.4% lower than the 5-year average.
- Initially reported average flatbed contract rates not inclusive of fuel were up 1.7% MoM but remain 1.5% lower than April 2023 levels.
Flatbed Load-to-Truck Ratio
Key Points
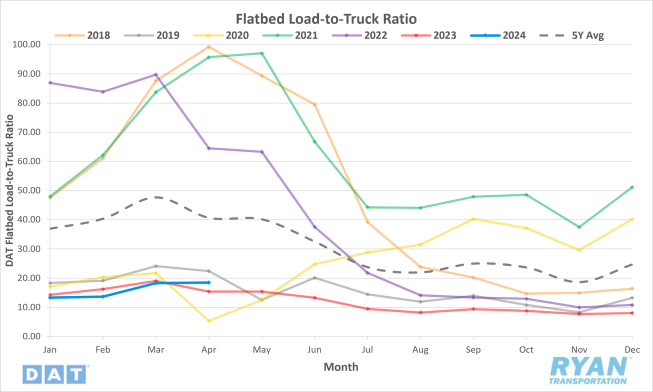
- The Flatbed LTR registered 18.51 in April, 0.9% higher MoM compared to March and 20% higher on an annual basis.
Flatbed Market Conditions
Flatbed Summary
The Port of Baltimore plays a crucial role in importing farming machinery and construction equipment, receiving over 12% of the annual volume in March. Major manufacturers like Case New Holland Agriculture, Caterpillar and John Deere rely on this port for shipping goods to their assembly plants. However, a recent bridge collapse has disrupted operations, leading to a surge in flatbed loads moved as alternative routes are sought. Efforts are underway to restore operations, with expectations of a limited access channel opening by the end of April.
In the agricultural sector, sales of farm tractors and combine harvesters continue to lag the 5-year average, affecting demand for flatbed carriers. Despite an increase in unit sales of 100+ horsepower tractors, total farm tractor sales were down in March. The situation is similar in Canada, where tractor sales are also struggling to meet expectations. The housing market is also facing challenges, with single-family homebuilding tumbling in March due to rising mortgage rates. This has led to hesitancy among potential buyers, impacting demand for construction equipment.
Meanwhile, in the energy sector, U.S. energy firms have reduced the number of natural gas rigs operating, impacting demand for products used in drilling and impacting flatbed carriers as well. Despite this, the U.S. manufacturing sector is showing signs of strength, with the March Manufacturing PMI indicating expansion for the first time since September 2022.
Intermodal
Intermodal Spot Rates
Key Points
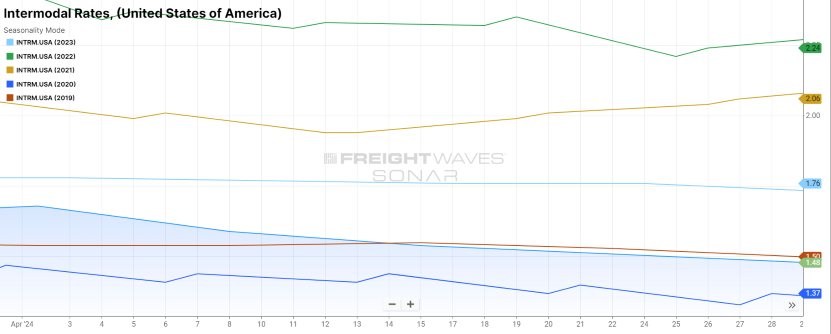
- The FreightWaves SONAR Intermodal Rates Index (INTRM.USA), which measures the average weekly all-in door-to-door intermodal spot rates for 53’ dry vans across a majority of origin-destination pairings, dropped significantly in April, falling 10.8% MoM, or $0.18, to $1.48.
- Compared to April 2023, intermodal spot rates are down 15.9% and remain 17.1% below the 5-year average.
Intermodal Volumes
Key Points
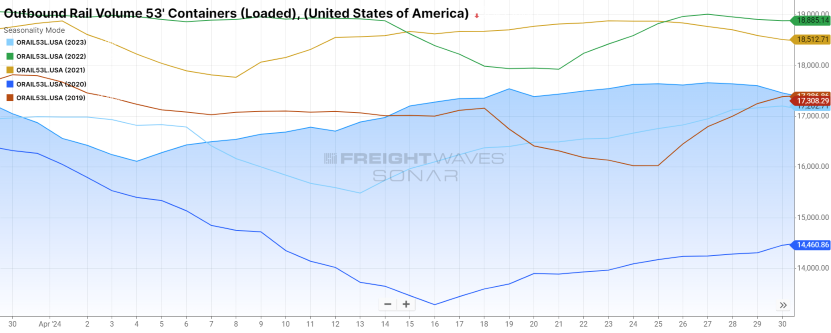
- Total loaded volumes for 53’ containers from all domestic markets, measured by the FreightWaves SONAR Loaded Outbound Rail Volume Index (ORAIL53L.USA), were up 2.4% at the end of April from where they closed out March.
- Total loaded volumes at the end of April were 1.5% higher compared to the same time in 2023 and were 1% higher than the 5-year average.
Intermodal Summary
The rail industry continued to be a tale of two segments in April, as the gains observed in the intermodal sector were nearly offset by the poor performance in the carload sector. On the positive side of the industry, intermodal volumes have reflected steady growth since the second half of 2023, with April levels registering 8.4% higher YoY for both international and domestic traffic. While the consistent increases are a positive sign within the industry, the only caveat for the annual increase is that 2023 was a very bad year within the industry, making the YoY comparisons much more favorable. On the negative side, carload volumes continued to struggle in April, with total carload traffic down 6.5% YoY. Much of the declines in carload volumes come at the hands of the particularly poor performance in coal. After accounting for roughly 30% of total carload volumes in 2023, coal is down 16.9% YTD with no rebound in sight in the near term.
Despite the rise in volumes, the further deterioration in the truckload market continues to drive intermodal rates down in an effort to remain competitive. While the holiday disruptions from Easter at the end of March can skew the MoM comparisons, the mid-month comparisons aren’t much better. Based on readings from the FreightWaves SONAR INTRM.USA index, domestic intermodal spot rates were down 9.9% MoM at the midway point of April, compared to the 10.8% decline registered at the end of the month. According to the SONAR Intermodal Contract Savings Index (IMCSI1.USA), which reflects the average percentage difference between all-in intermodal contract rates and all-in truckload contract rates in the same lane, the index peaked at 9.42% after the first week before declining rapidly through the end of the month, dropping 103 bps to close the month out at 8.39%.
While the rail industry has made significant strides over the past several months, despite a number of headwinds, it is not completely out of the clear just yet. Recent headlines have noted of a potential strike by rail workers for both Canadian Class I carriers, Canadian National (CN) and Canadian Pacific Kansas City (CPKC), that could start as soon as May 22nd. Union members voted at the beginning of April to authorize a strike by May 22nd in an effort to secure higher wages, better benefits and address safety concerns. Should the strike go into effect, the impact would be significant and would be felt across all of North America. According to FTR, both Canadian Class I carriers account for hauling 28% of total carload volumes and 20% of all intermodal volumes in North America.
Further Reading
- April Class 8 Truck Orders Increase Year-Over-Year – Transport Topics
- Impending Canadian Rail Strike Could Paralyze Country’s Economy – SupplyChain247
- Port Roundup: Strong Annual Growth Across the Board - FreightWaves: American Shipper