
Executive Summary
April’s freight-related indicators were an extension of the first quarter as the market remained in a deflationary state. While overall declines have been consistent thus far, they have begun to flatten out as we approach the bottom pointing toward the market nearing a trough as we head into the warmer seasonal freight months. The carrier supply remains oversaturated as demand levels have yet to find any momentum to create any semblance of balance. Falling fuel prices have helped extend the operating window for many carriers but will likely not be enough in the near-term to keep companies above the break-even point. The deterioration of the truckload sector has created negative pressure on intermodal volumes, who are already struggling against import disruptions. Rates between the two modes have become more competitive, making rail less attractive to shippers. Concerns over the near-term health of the economy remain elevated, despite the continued strength in the labor market and inflation showing signs of decelerating, as further turmoil in the banking sector and brinkmanship over raising the debt ceiling continue.
Main Takeaways
- Manufacturing activity improved slightly from March to April as employment grew, but overall, the index remains in contraction territory.
- Linehaul spot rate declines continue outpacing linehaul contract rate declines, with the contract-to-spot spread widening further in April, from $0.58 to $0.62.
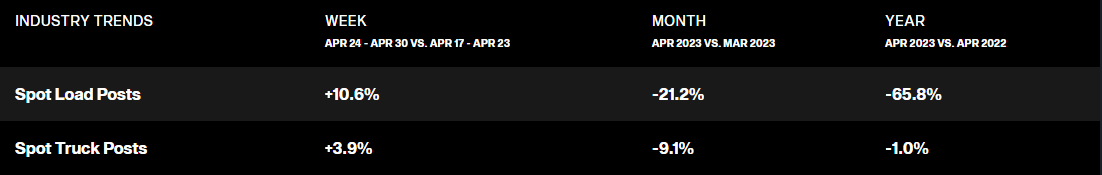
- Contract load volumes and acceptances saw slight MoM growth in April, up 4.1% and 4.3% respectively, while spot market activity further deteriorated, down 21.2% MoM.
- The total trucking population moved back to contraction in April, with net authority revocations exceeding new entrants by 1,294.
- Following an increase in both volume and rates in March, the flatbed market cooled off in April with contract rates remaining relatively unchanged.
Economy
United States ISM Manufacturing PMI
Key Points
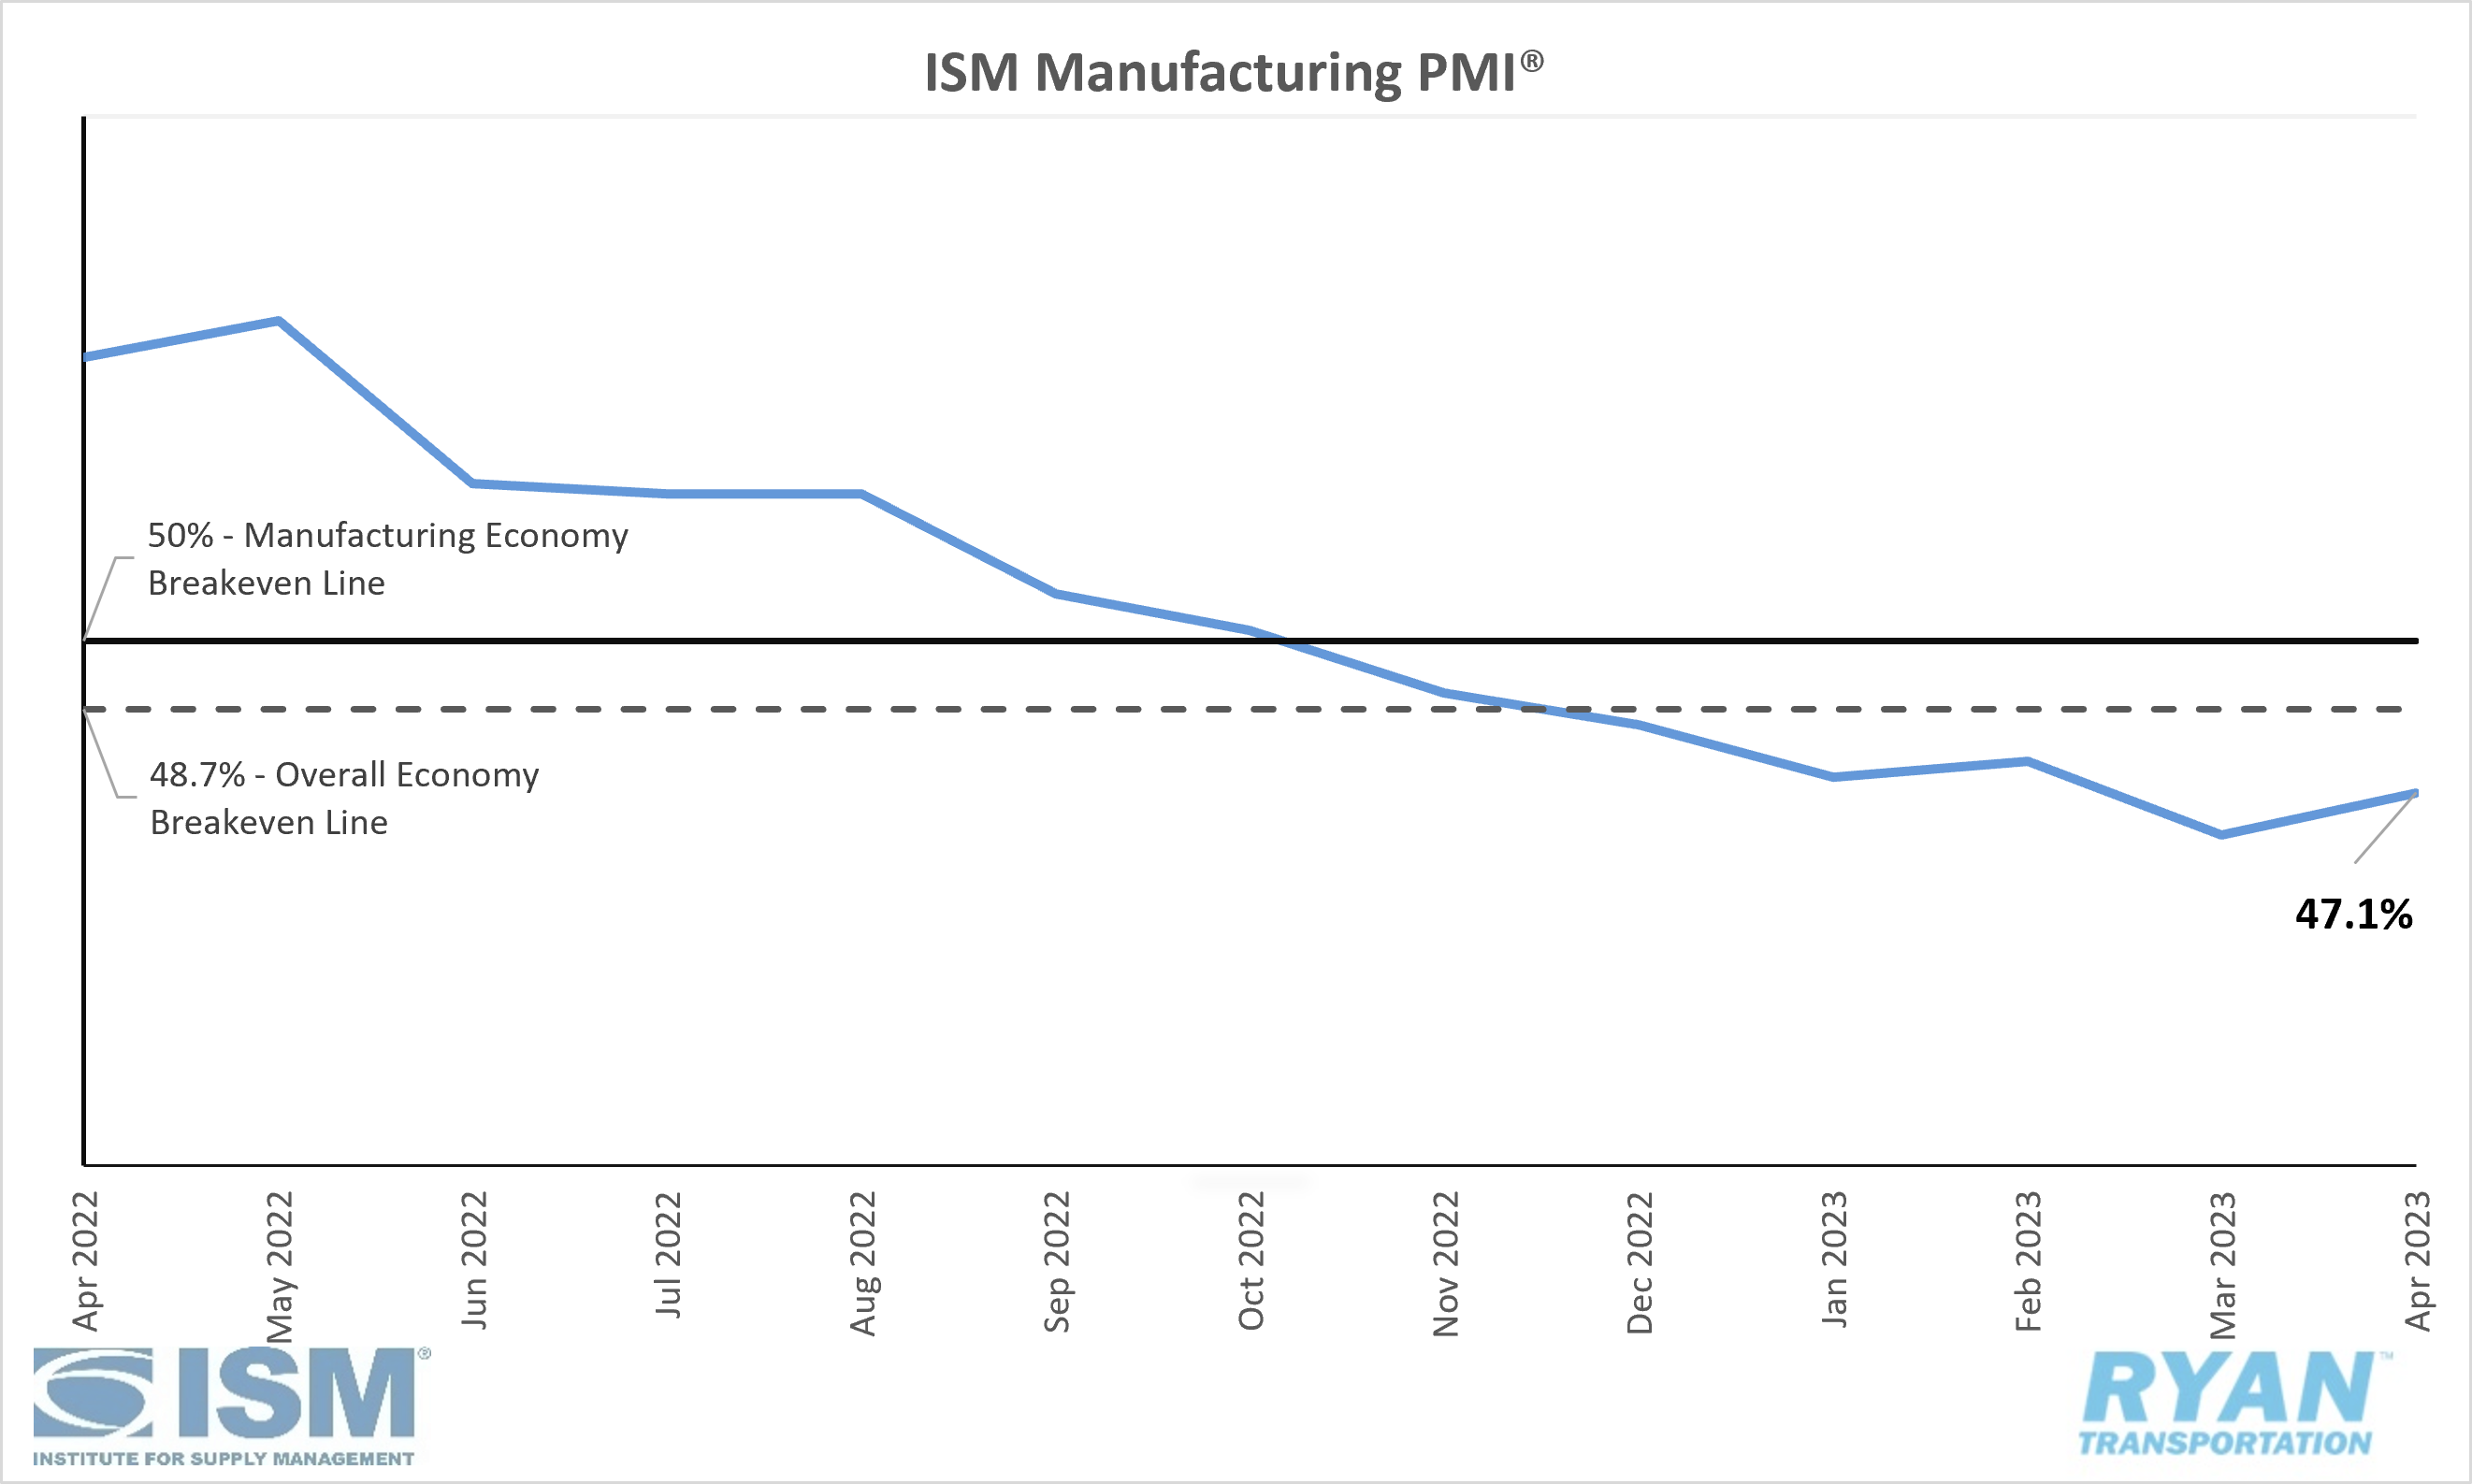
- The ISM Manufacturing PMI® contracted for the sixth consecutive month in April, registering 47.1%, 0.8 percentage points higher than March’s reading of 46.3%. Regarding the overall economy, April’s reading indicates the fifth consecutive month of contraction following 30 months of expansion.
- Of the five subindexes that directly factor into the Manufacturing PMI® (New Orders, Production, Employment, Supplier Deliveries and Inventories), Employment was the only one to register in growth territory in April.
- After two months in contraction territory, the Employment Index expanded in April, registering at 50.2%, 3.3 percentage points higher than the 46.9% reading in March.
- The New Orders Index remained in contraction at 45.7%, 1.4 percentage points higher than the March figure of 44.3%.
- The Production Index saw a 1.1 percentage point increase over March’s reading, registering 48.9% and remaining in contraction territory.
- The Supplier Deliveries Index fell further in April at 44.6%, 0.2 percentage points lower than the 44.8% recorded in March and remains the index’s lowest reading since March 2009 when it registered 43.2%.
Summary
The ISM Manufacturing PMI® showed signs of improvement in April over the figures recorded in March but ultimately remains in contraction territory as companies continue to match the weak demand environment by slowing outputs through the first half of the year. The index indicates there is still hope for a return to growth in the second half of the year starting in late summer/early fall. Economic uncertainties are still prevalent, though, based on the mixed reactions reflected in head counts across PMI® panelists, according to the Institute for Supply Management (ISM). The demand components of the index eased further in April, with customer inventory levels entering the low end of ‘too high’ as companies work through current backlogs of orders and new orders continue to contract at a slower rate. Despite the weak demand levels, the output and consumption components saw positive momentum in April, primarily driven by the growth in the Employment Index and the slowing contraction in production per the ISM. After spending only a month in contraction in March, prices registered 4.0 percentage points higher in April at 53.2%, returning to expansion territory.
Why it Matters: The weak near-term outlook for manufacturing activity remains unchanged for at least the first half of 2023. Looking past Q2’23, there continues to be mixed expectations for the future return of growth from PMI® panelists, with a 1:1 ratio of optimism to pessimism according to the ISM. Customer inventory levels and price instabilities indicate bottlenecks remain downstream in the supply chain and continue putting downward pressure on new orders and future production levels. This is allowing suppliers upstream to work down backlogs and overdue deliveries, which could ultimately bleed into employment levels if contractions continue at their current pace.
Macro Impacts
- The Federal Reserve increased the federal funds rate by another 25 basis points to 5.00 - 5.25% as expected during its meeting on May 3. This marks the 10th straight meeting over the last 15 months the Fed has increased its target rate.
- Similar to the Fed meeting in April, the recent increase came only a week after yet another bank was taken into receivership by the FDIC after reporting losses north of $100B in Q1, casting further doubt on the stability of the banking industry.
- This is the first time since 2007 the federal funds rate has surpassed 5%, putting the federal funds rate at the FOMC at its previously projected target and implying a pause on future hikes by default.
- The chance for future rate increases will be data-driven based on economic activity expansion, CPI core inflation and the labor market.
- At the time of this writing, analysts are expecting a pause in rate hikes, with a 89.3% probability of the federal funds rate remaining at the current 5.00 - 5.25%, up from 63.8% last week, according to the CME FedWatch Tool.
- Nonfarm payroll employment rose by 253,000 in April, according to the Jobs Report released by the Bureau of Labor Statistics (BLS).
- The unemployment rate saw little change, falling 0.1% for the second month in a row to 3.4% and matching January of this year for the lowest level since May 1969.
- Total Transportation and Warehousing jobs saw slight growth, adding just over 10,000 jobs with Truck Transportation accounting for 3,000 new jobs and Warehousing and Storage adding 4,000 jobs.
- The headline Consumer Price Index (CPI) rose 4.9% in April on an annual basis while Core CPI, which measures all items less food and energy, rose 5.5%, according to the April CPI report released from the BLS.
- After increasing 0.1% in March, headline inflation increased 0.4% in April on a seasonally-adjusted basis while core inflation rose 0.4% for the second month in a row.
- Similar to the past several months, shelter continues to be the largest contributor to the monthly increases in the all items index, followed by used cars and trucks and the gasoline index.
- The energy index has fallen 5.1% over the past 12 months while the gasoline index has fallen 12.2%. The gasoline index increased 3.0% following the 4.6% decrease in March.
Industry Overview
April Key Figures (YoY)
| Truck Data Points | YoY Change (%) |
|---|---|
| DAT Spot Rates (incl. FSC) | -24.4 |
| Fuel Prices | -19.9 |
| ACT Class 8 Preliminary Orders | -27.7 |
| ATA NSA Truck Tonnage | -4.9 |
| Cass Freight Index | -9.6 |
| Cass Freight Expenditures | -14.0 |
| Cass Freight Shipments | -2.4 |
Rates
Spot Rates
Key Points
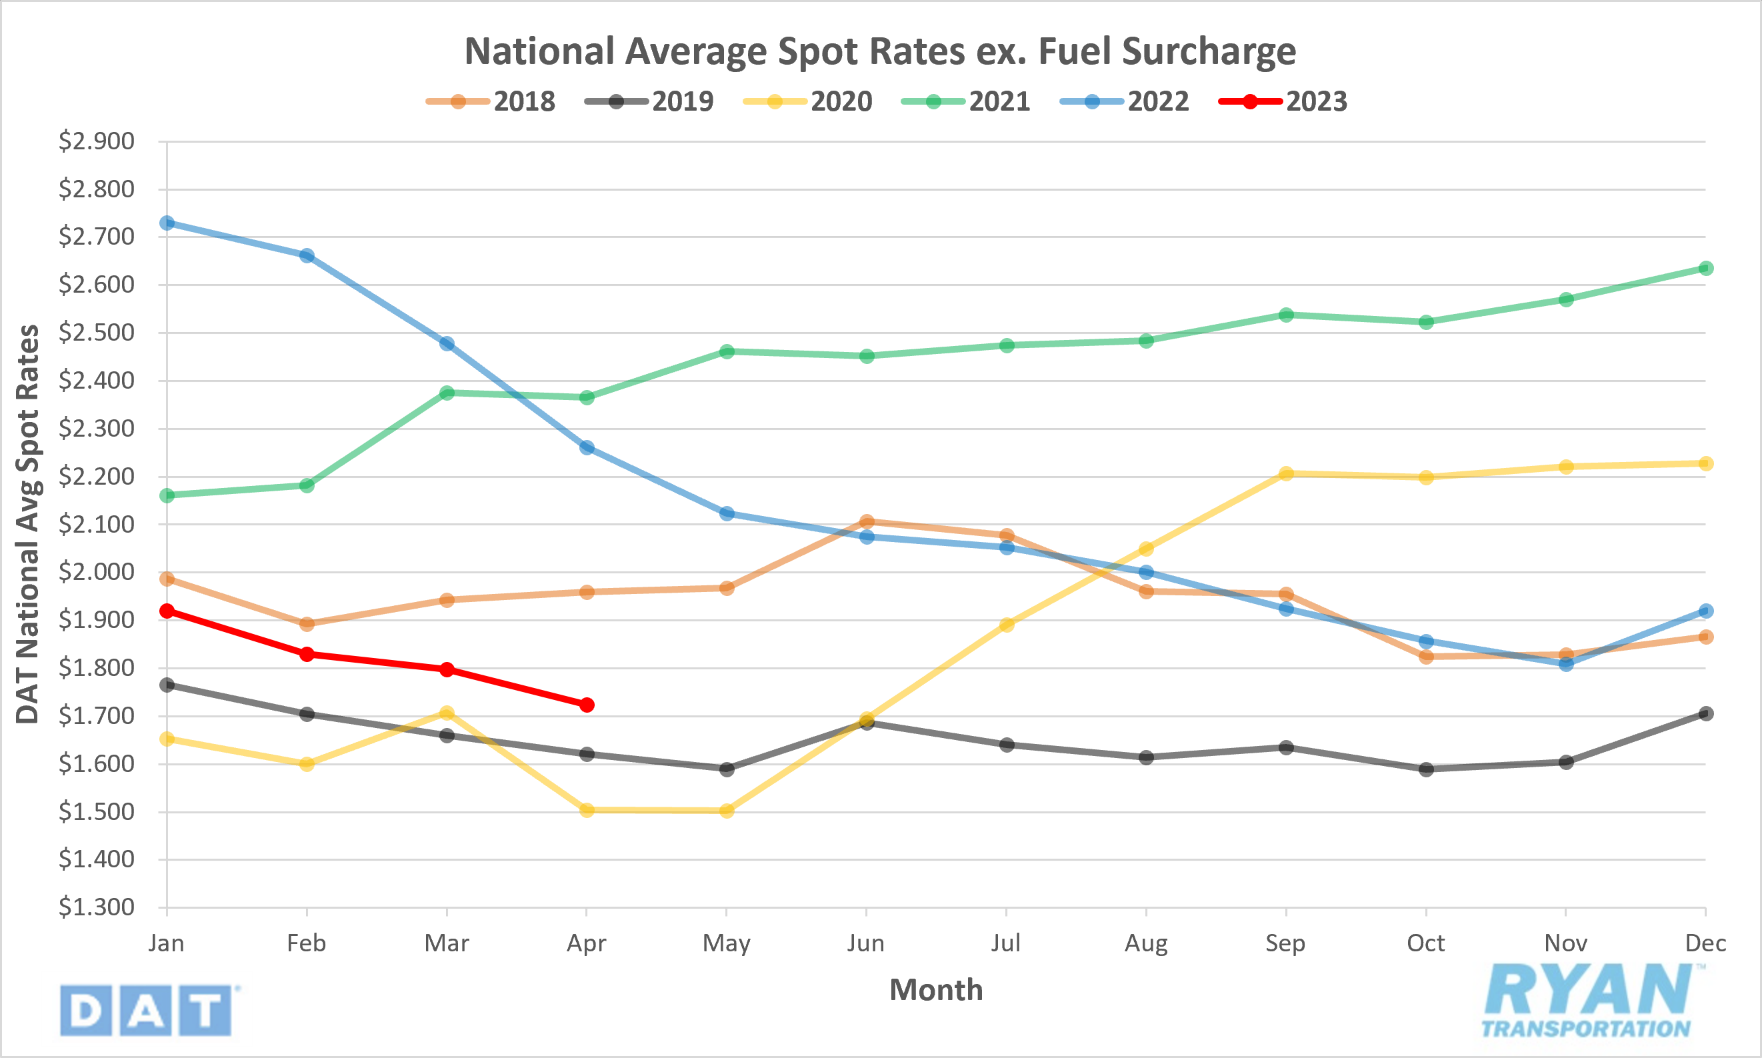
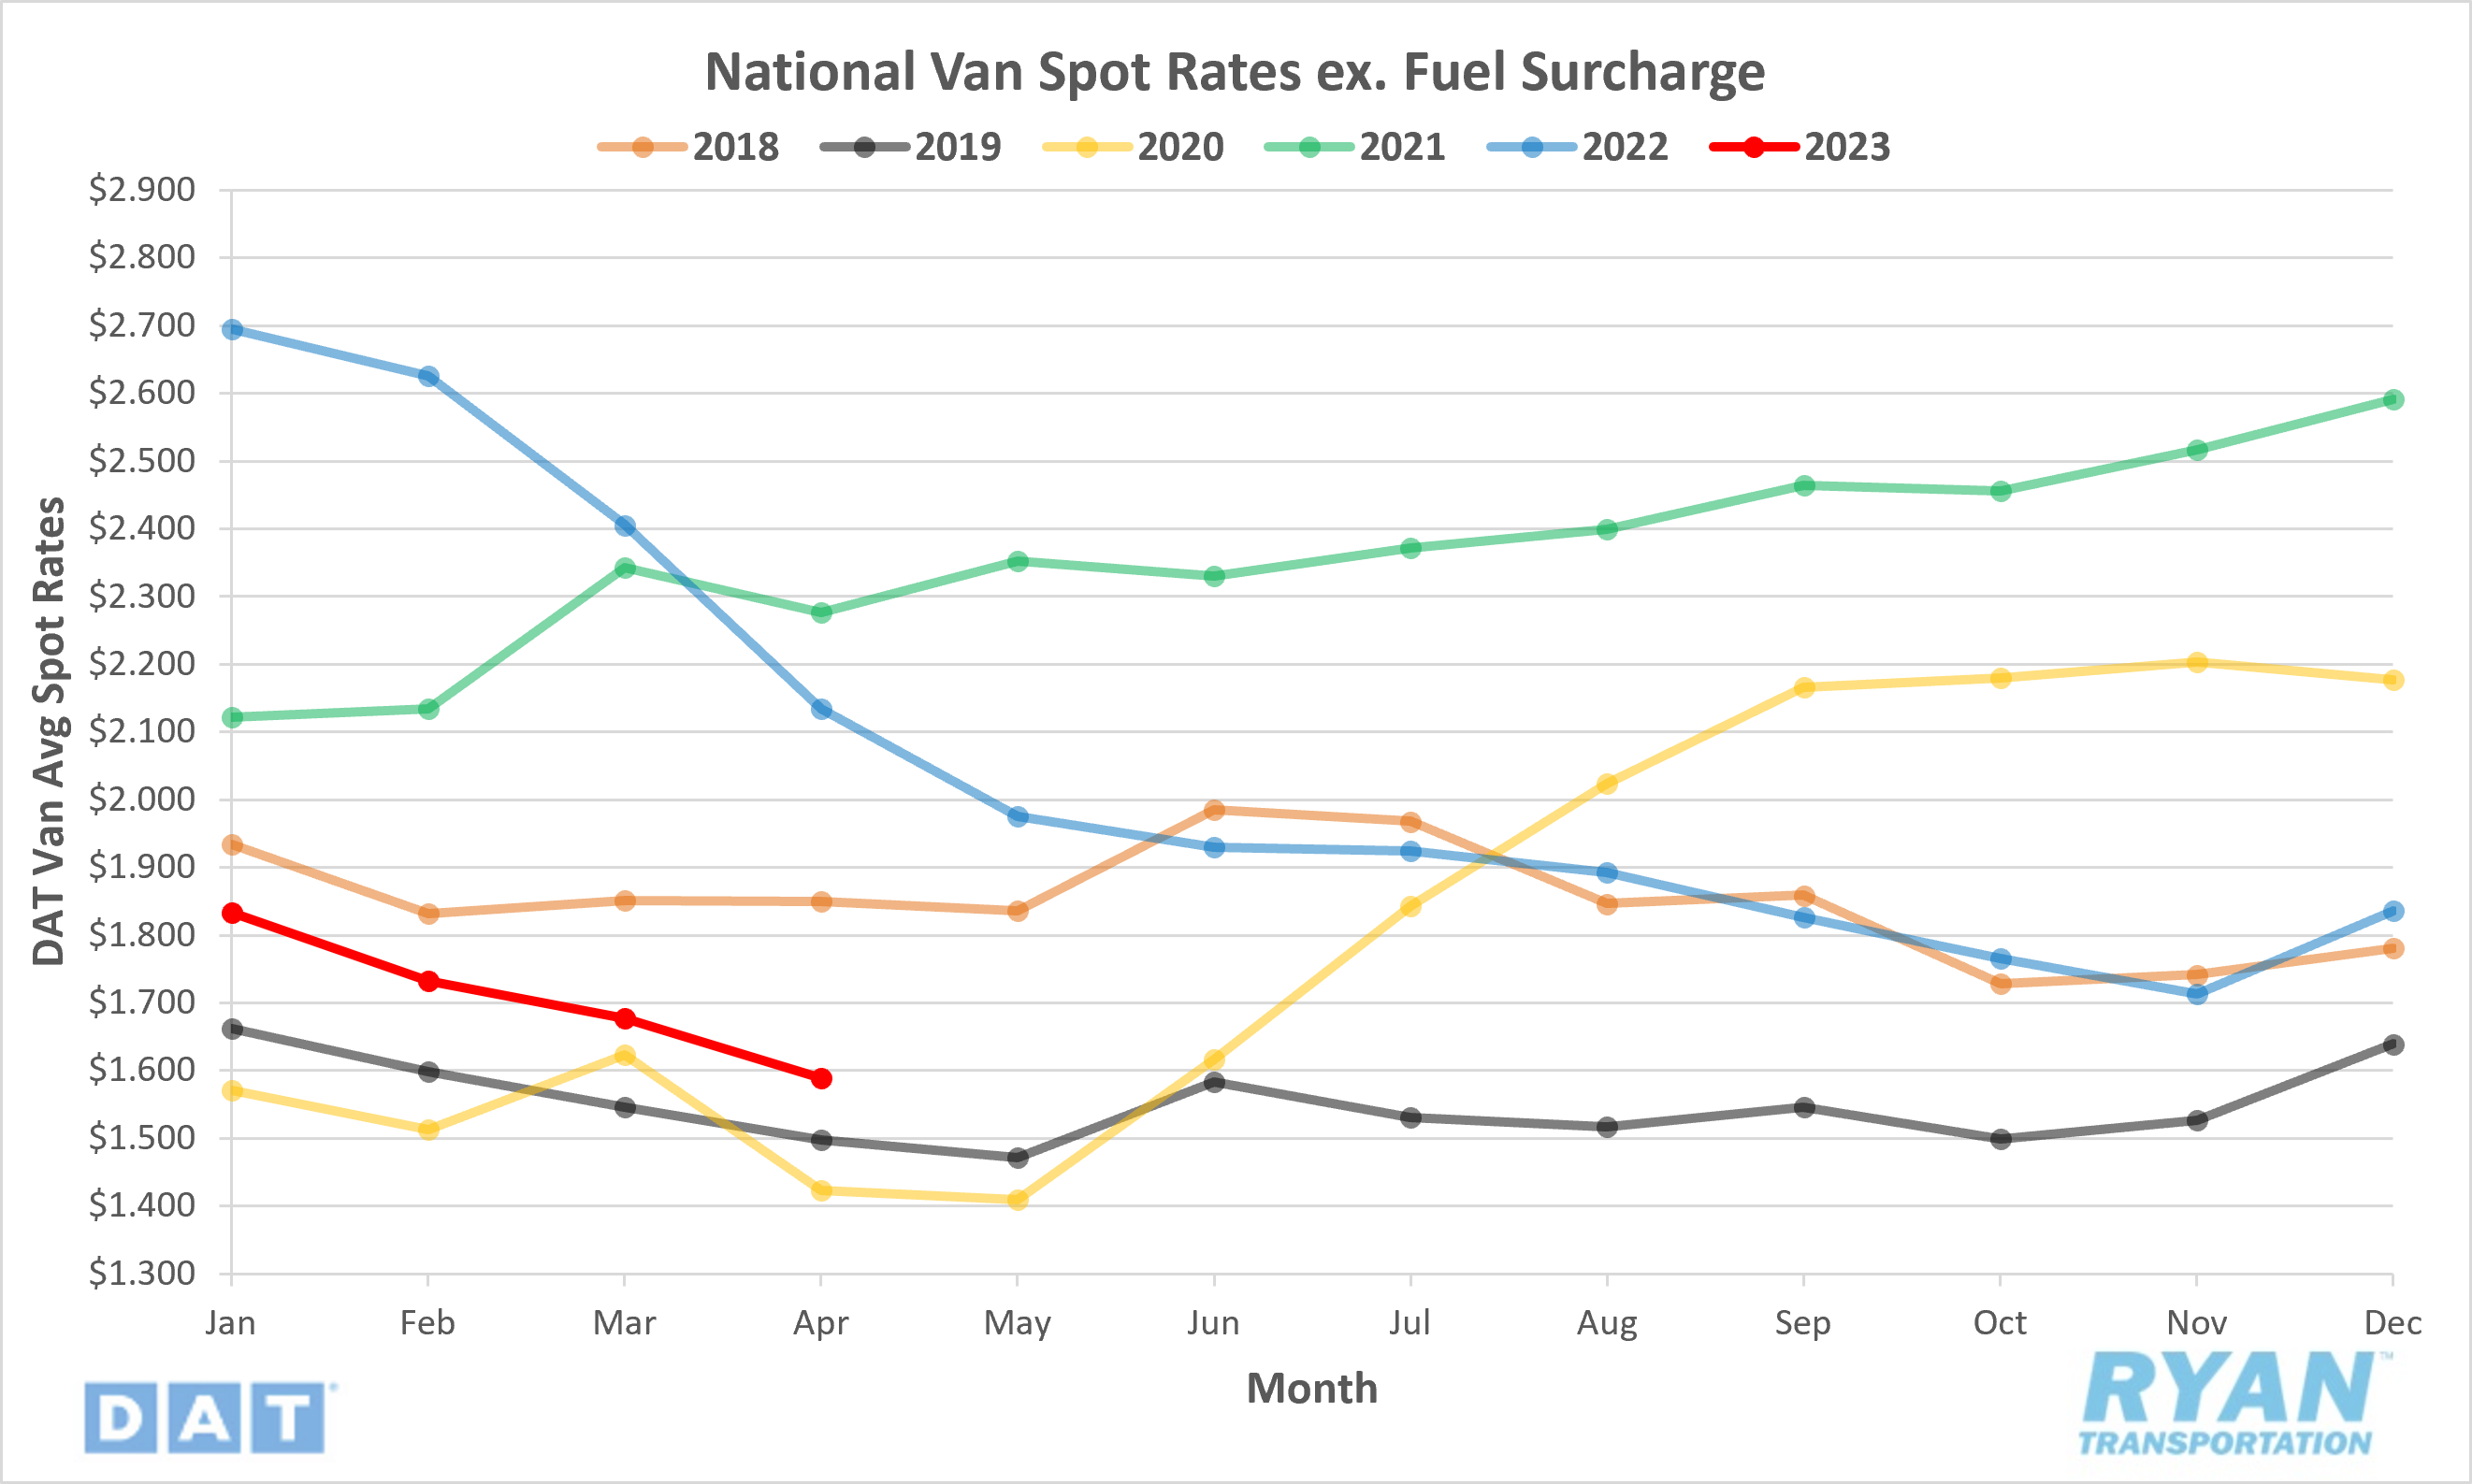
- National spot rates excl. fuel surcharge declined 4.1% MoM in April, ending the month 23.8% below the same time last year.
- Spot rates excl. fuel have now spent seven consecutive months below the 5-year average, registering 14.3% below in April.
Contract Rates
Key Points
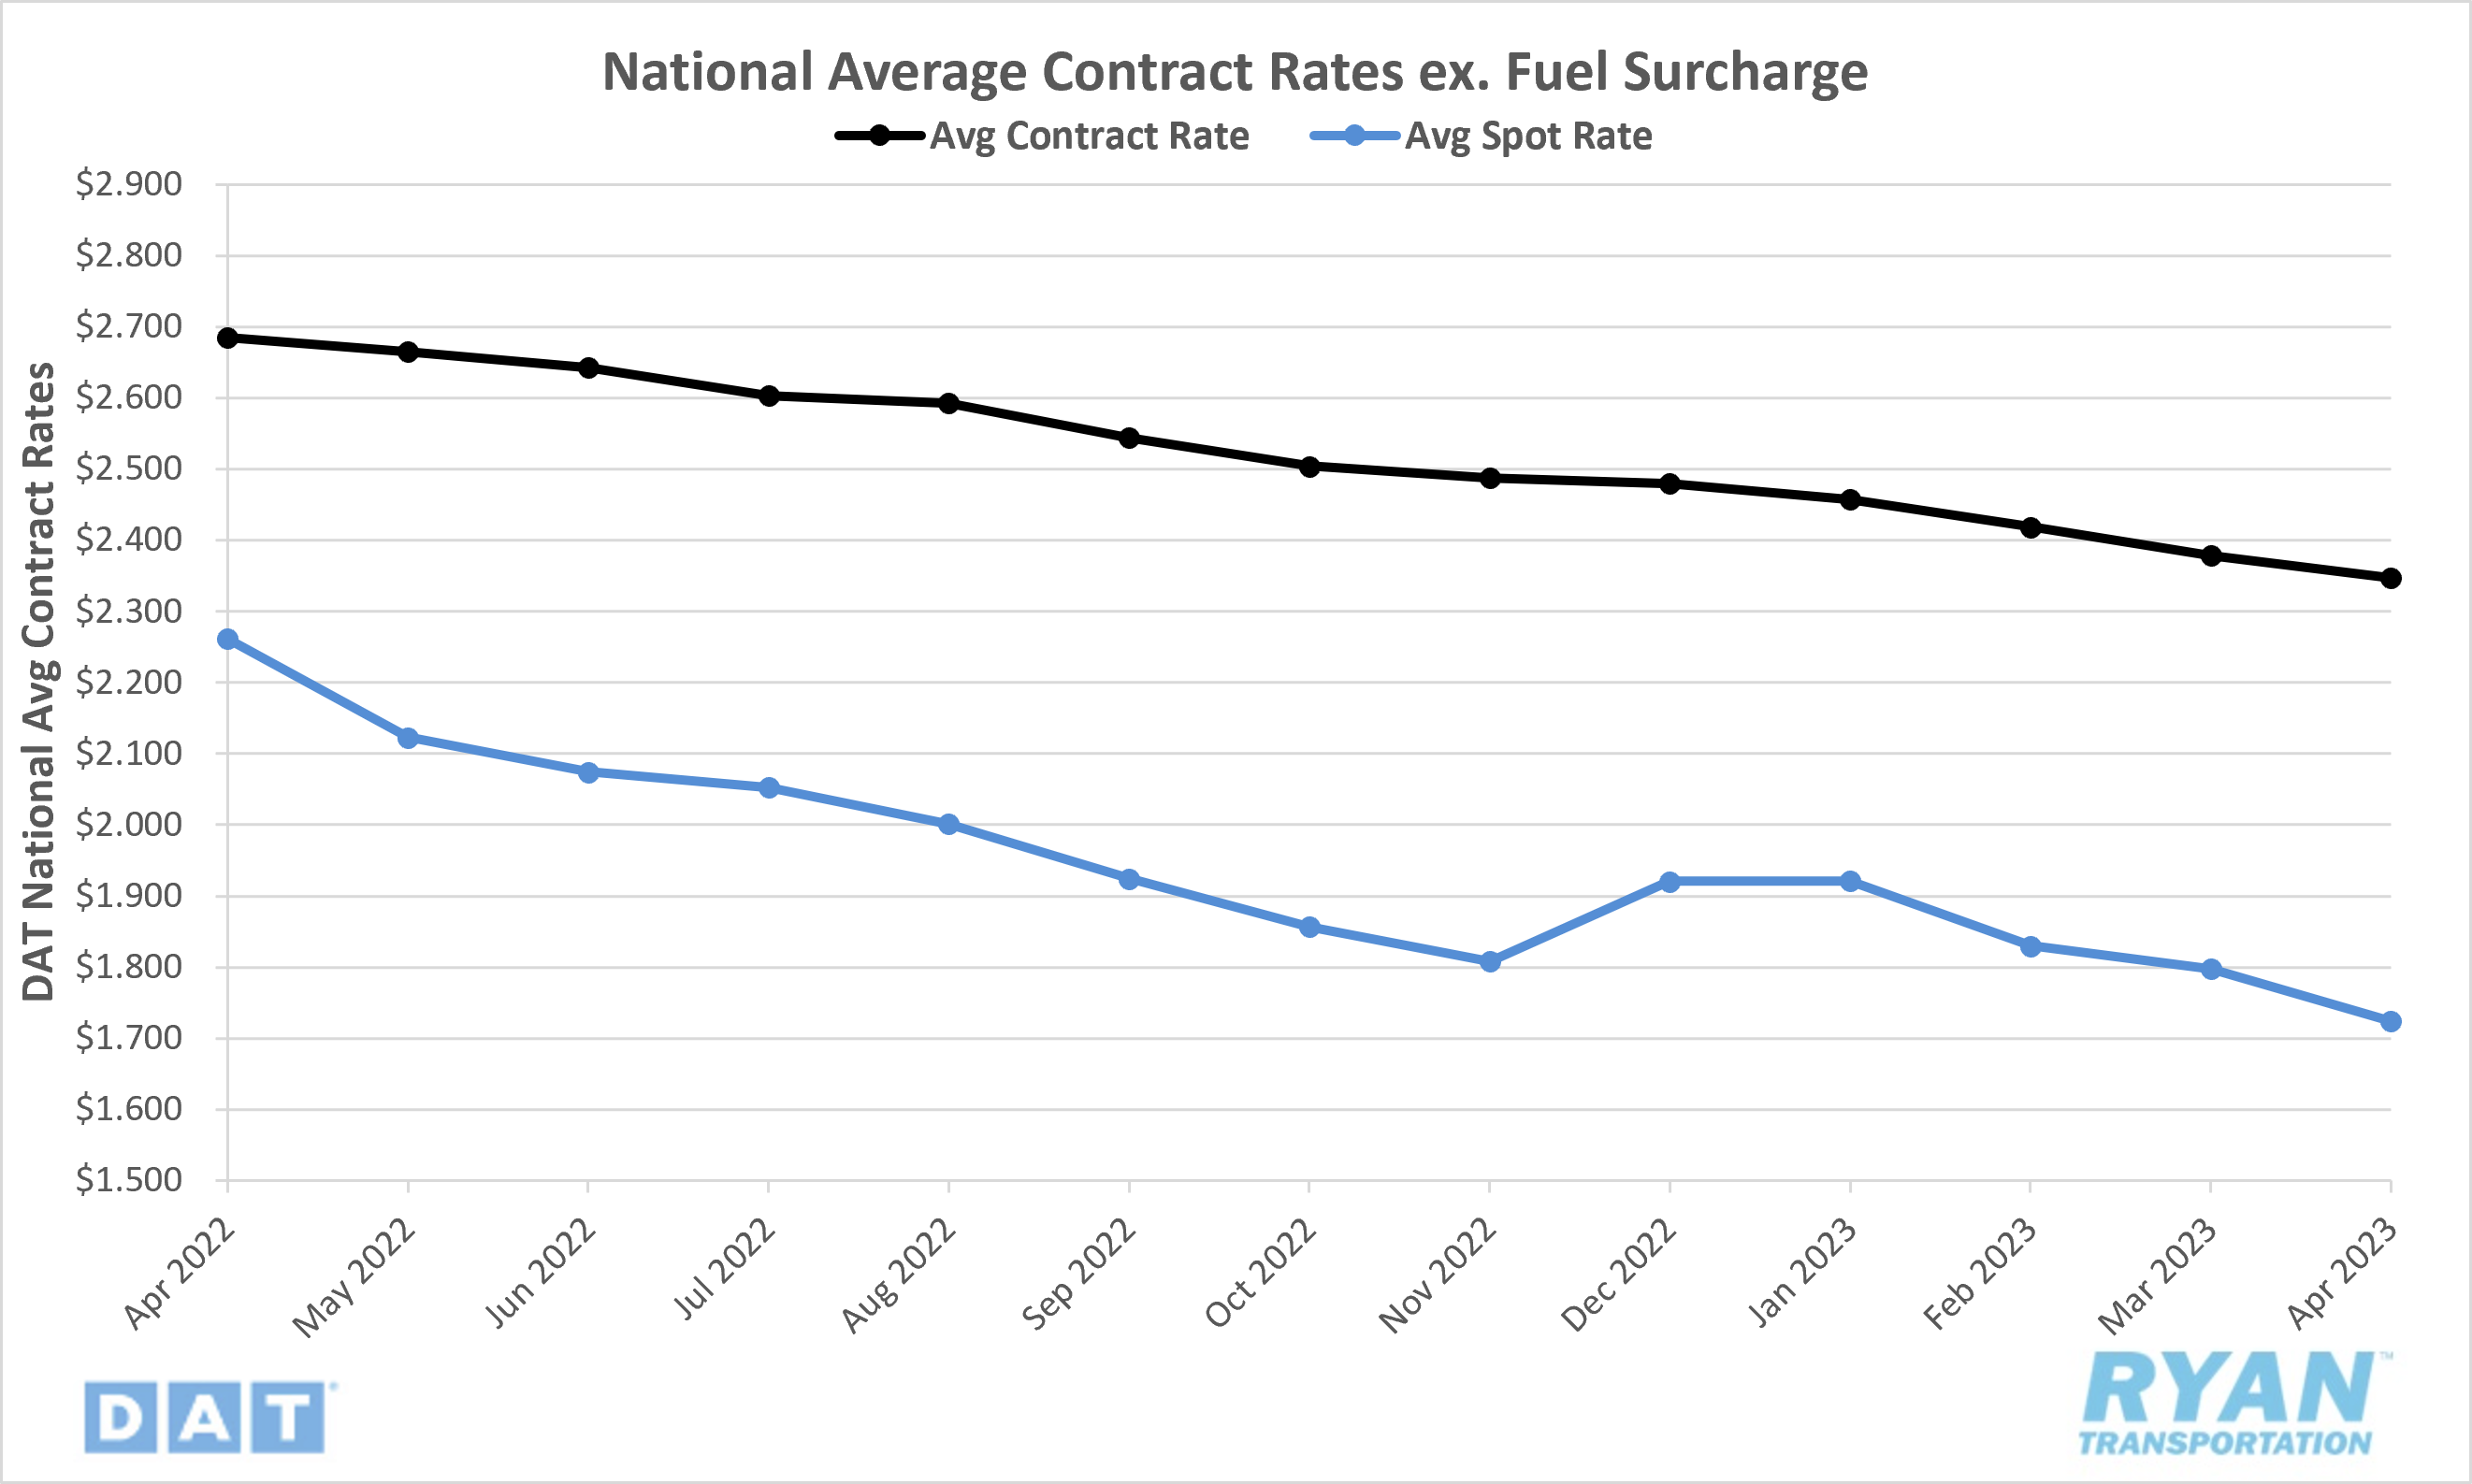
- National contract rates excl. fuel fell 1.3% MoM in April and was down 12.6% on an annual basis.
- The contract-to-spot-rate spread in April was up 7.3% or $0.04 from March, registering $0.62.
Summary
April marked the third consecutive month of the average spot rate linehaul declines outpacing the MoM declines in the average contract rate linehaul by an average of just over 2% per month. Dating back to pre-pandemic years, the standard average spread between contract and spot rates was generally in the range of $0.35 - $0.45 during non-seasonal impacted rate surges. The last time the contract-to-spot-rate spread was within this range was April 2022 when the deterioration of the spot market started to gain momentum. Since then, the spread has remained elevated above that range from as low as $0.54 in January of this year to the high end of $0.68 seen in November of last year. According to a recent DAT report, the average per mile cost for operating a long-haul truck sits around $1.78, down from $2.01 in September of last year when the price of diesel hovered around $5.00 per gallon. At the time, the average all-in dry van spot rate was $2.45, and gross profit margins were around $0.16 per mile, according to DAT. Fuel generally accounts for roughly 30 - 40% of operating costs for trucking companies and owner-operators, so the steady decline in diesel prices has helped bring those total costs down and limited smaller fleet exposure to the decline spot market thus far. The extent that lower fuel prices can provide relief to carriers’ bottom line appears to be nearing its end, though, as the current all-in dry van spot rate sits just over $2.06, and total gross profits have fallen to just $0.03 per mile, per the DAT.
Why It Matters: Q1 was expected to be softer than ever before following the downturn in the market that began early last year, making a rebound in demand from produce and construction in Q2 even more crucial. Smaller carriers and owner-operators that were able to survive through the first three months of 2023 have likely burned through savings accrued during the bull market from September of 2020 to March of 2022. This is especially the case for any new entrants in 2021 who purchased new/used equipment and liability insurance at significantly elevated prices. While the current estimated average total gross profit of $0.03 per mile doesn’t apply to every carrier due to differing circumstances between fleets, it is still a good barometer for gauging how much longer the market remains oversaturated with capacity and when we will likely see spot rates reach the floor. Any further extension of negative pressure on spot rates caused by muted demand in Q2 will ultimately put many carriers below their operating margins, resulting in a large-scale exit of capacity from the market, leaving spot rates nowhere to go but up.
Truckload Demand
Key Points
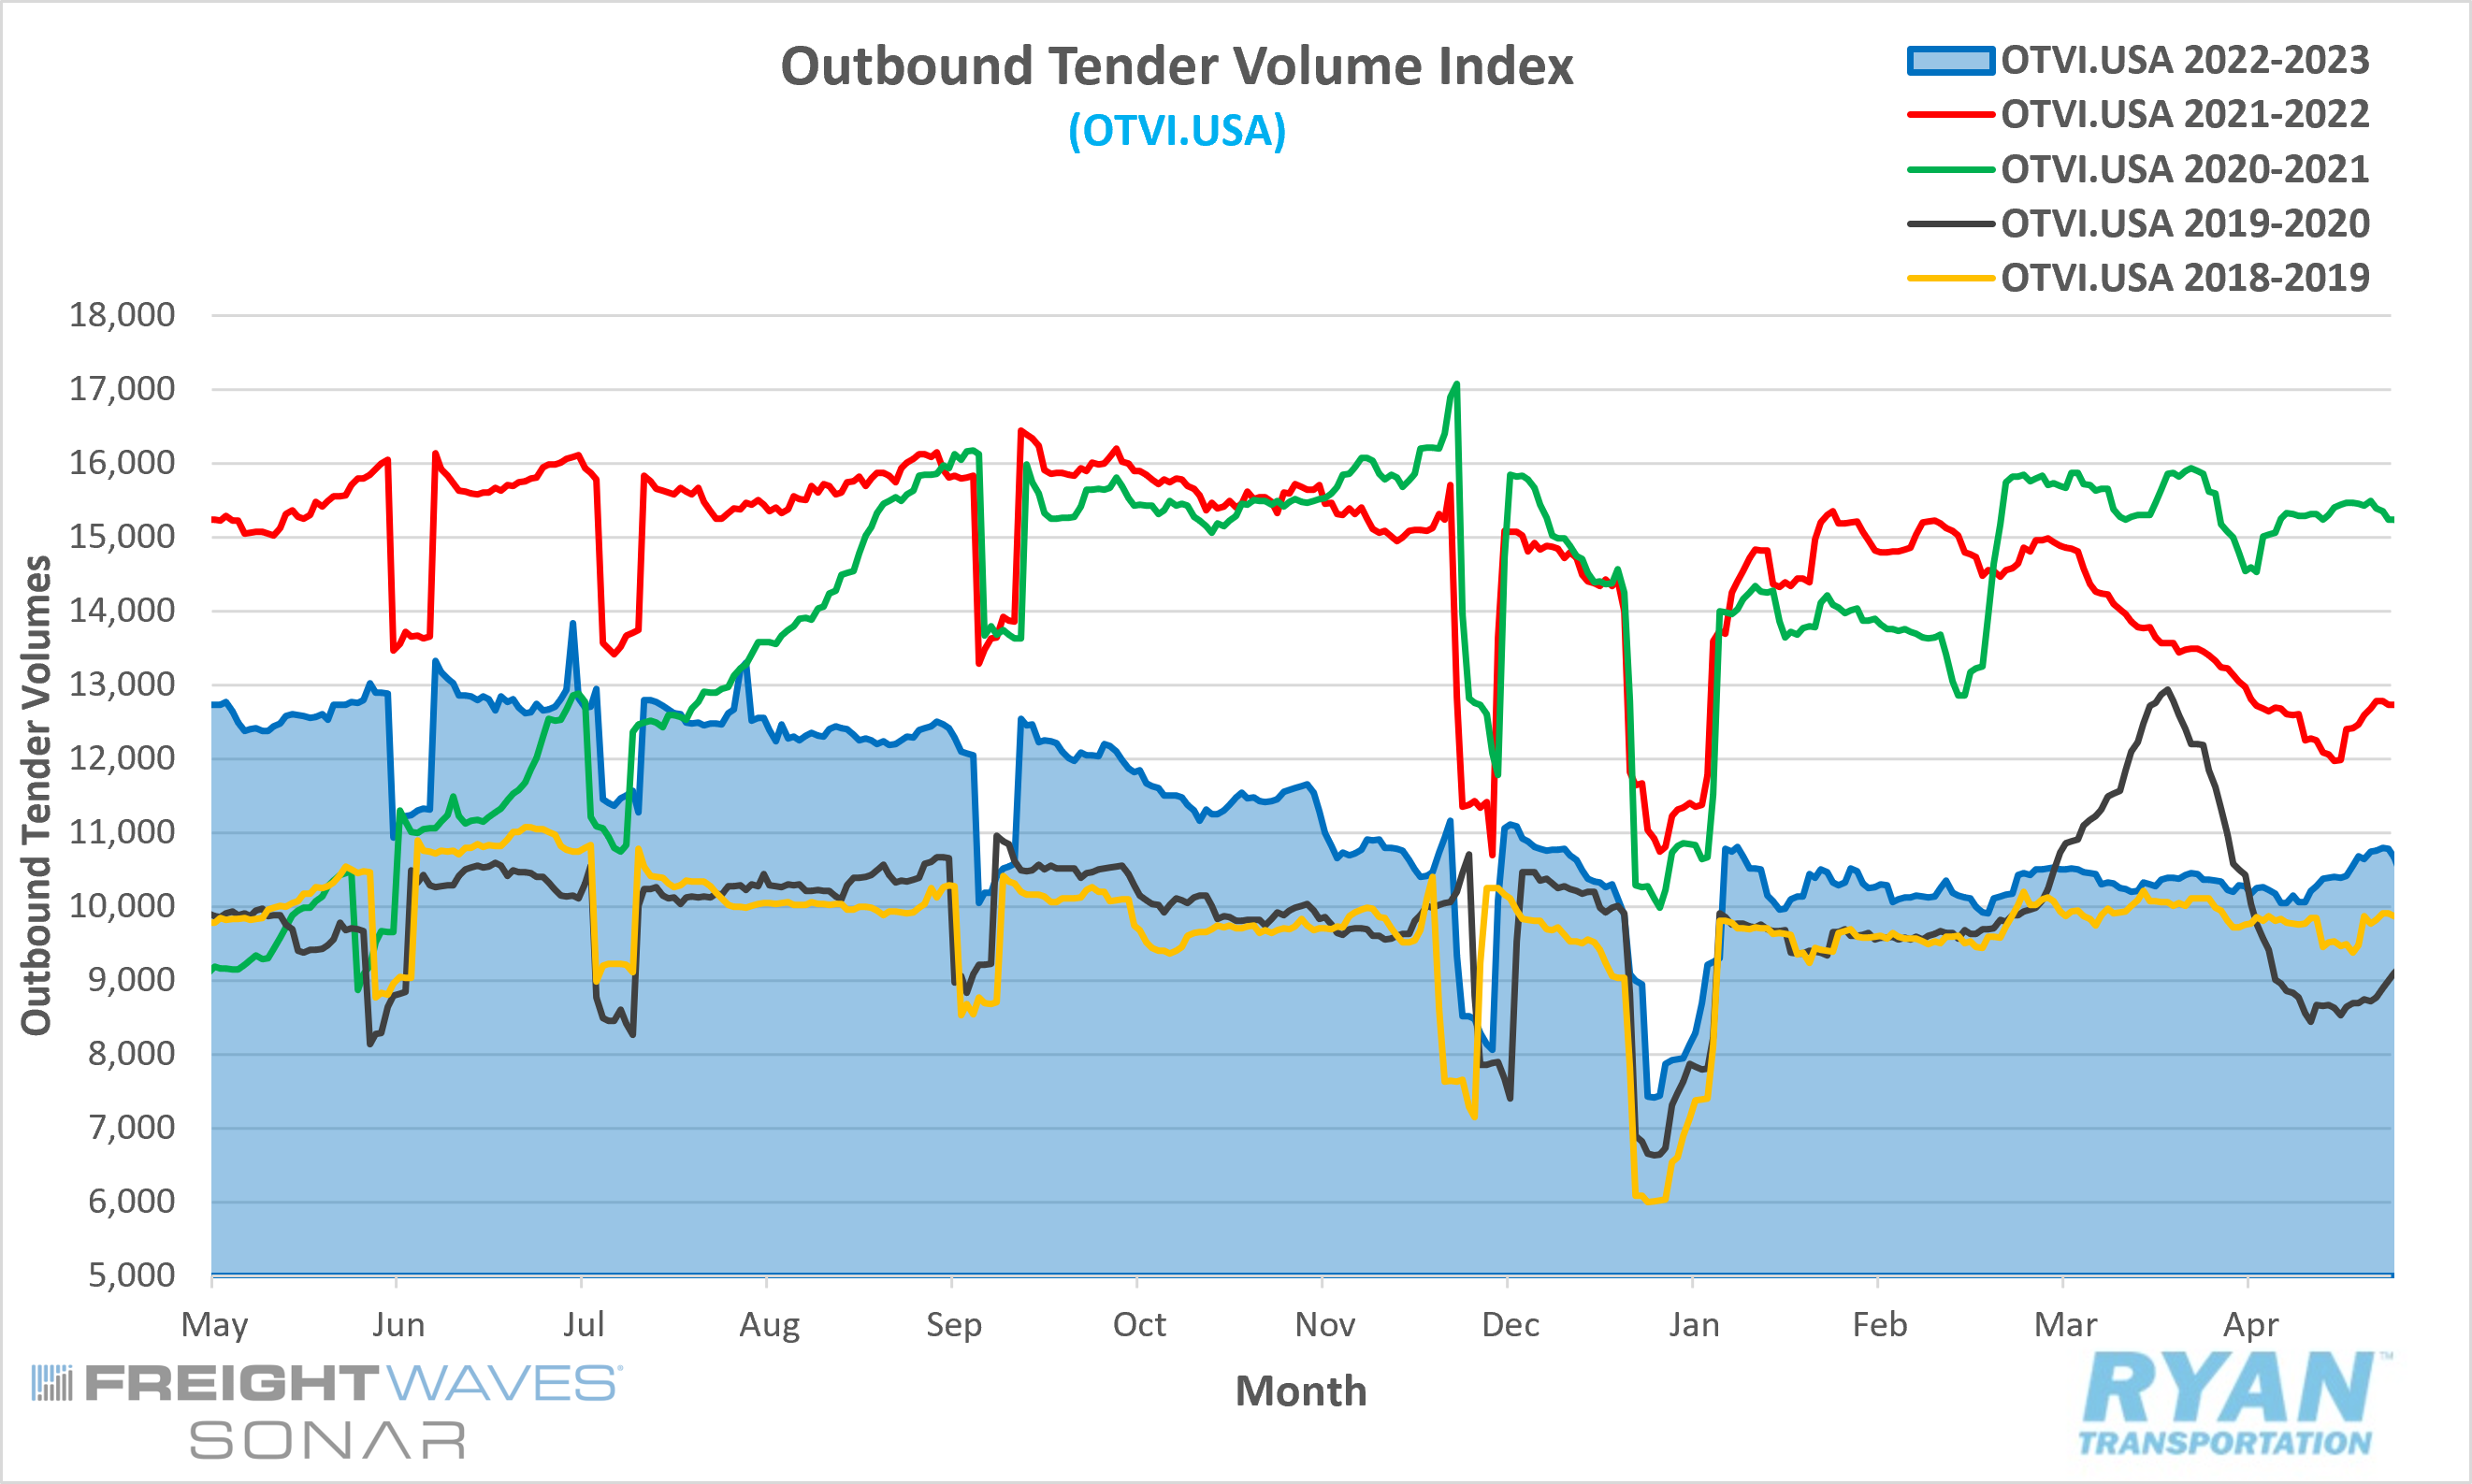
- The FreightWaves SONAR Outbound Tender Volume Index (OTVI), which measures contracted tender volumes across all modes sent electronically to carriers, ended April up 4.1% to 10,786.34, from the 10,357.10 reading on March 31.
- Compared to this time last year, monthly average volume levels are down 18.0% and are 12.7% below the 5-year average.
- The Cass Freight Index, which analyzes the number of freight shipments in North America and the total dollar value spent on freight shipments, recorded decreases in April for both shipments and expenditures of 2.4% and 14.0% respectively.
- Spot market volumes in April declined on both a monthly and yearly basis by 21.2% and 65.8% respectively, according to DAT.
Summary
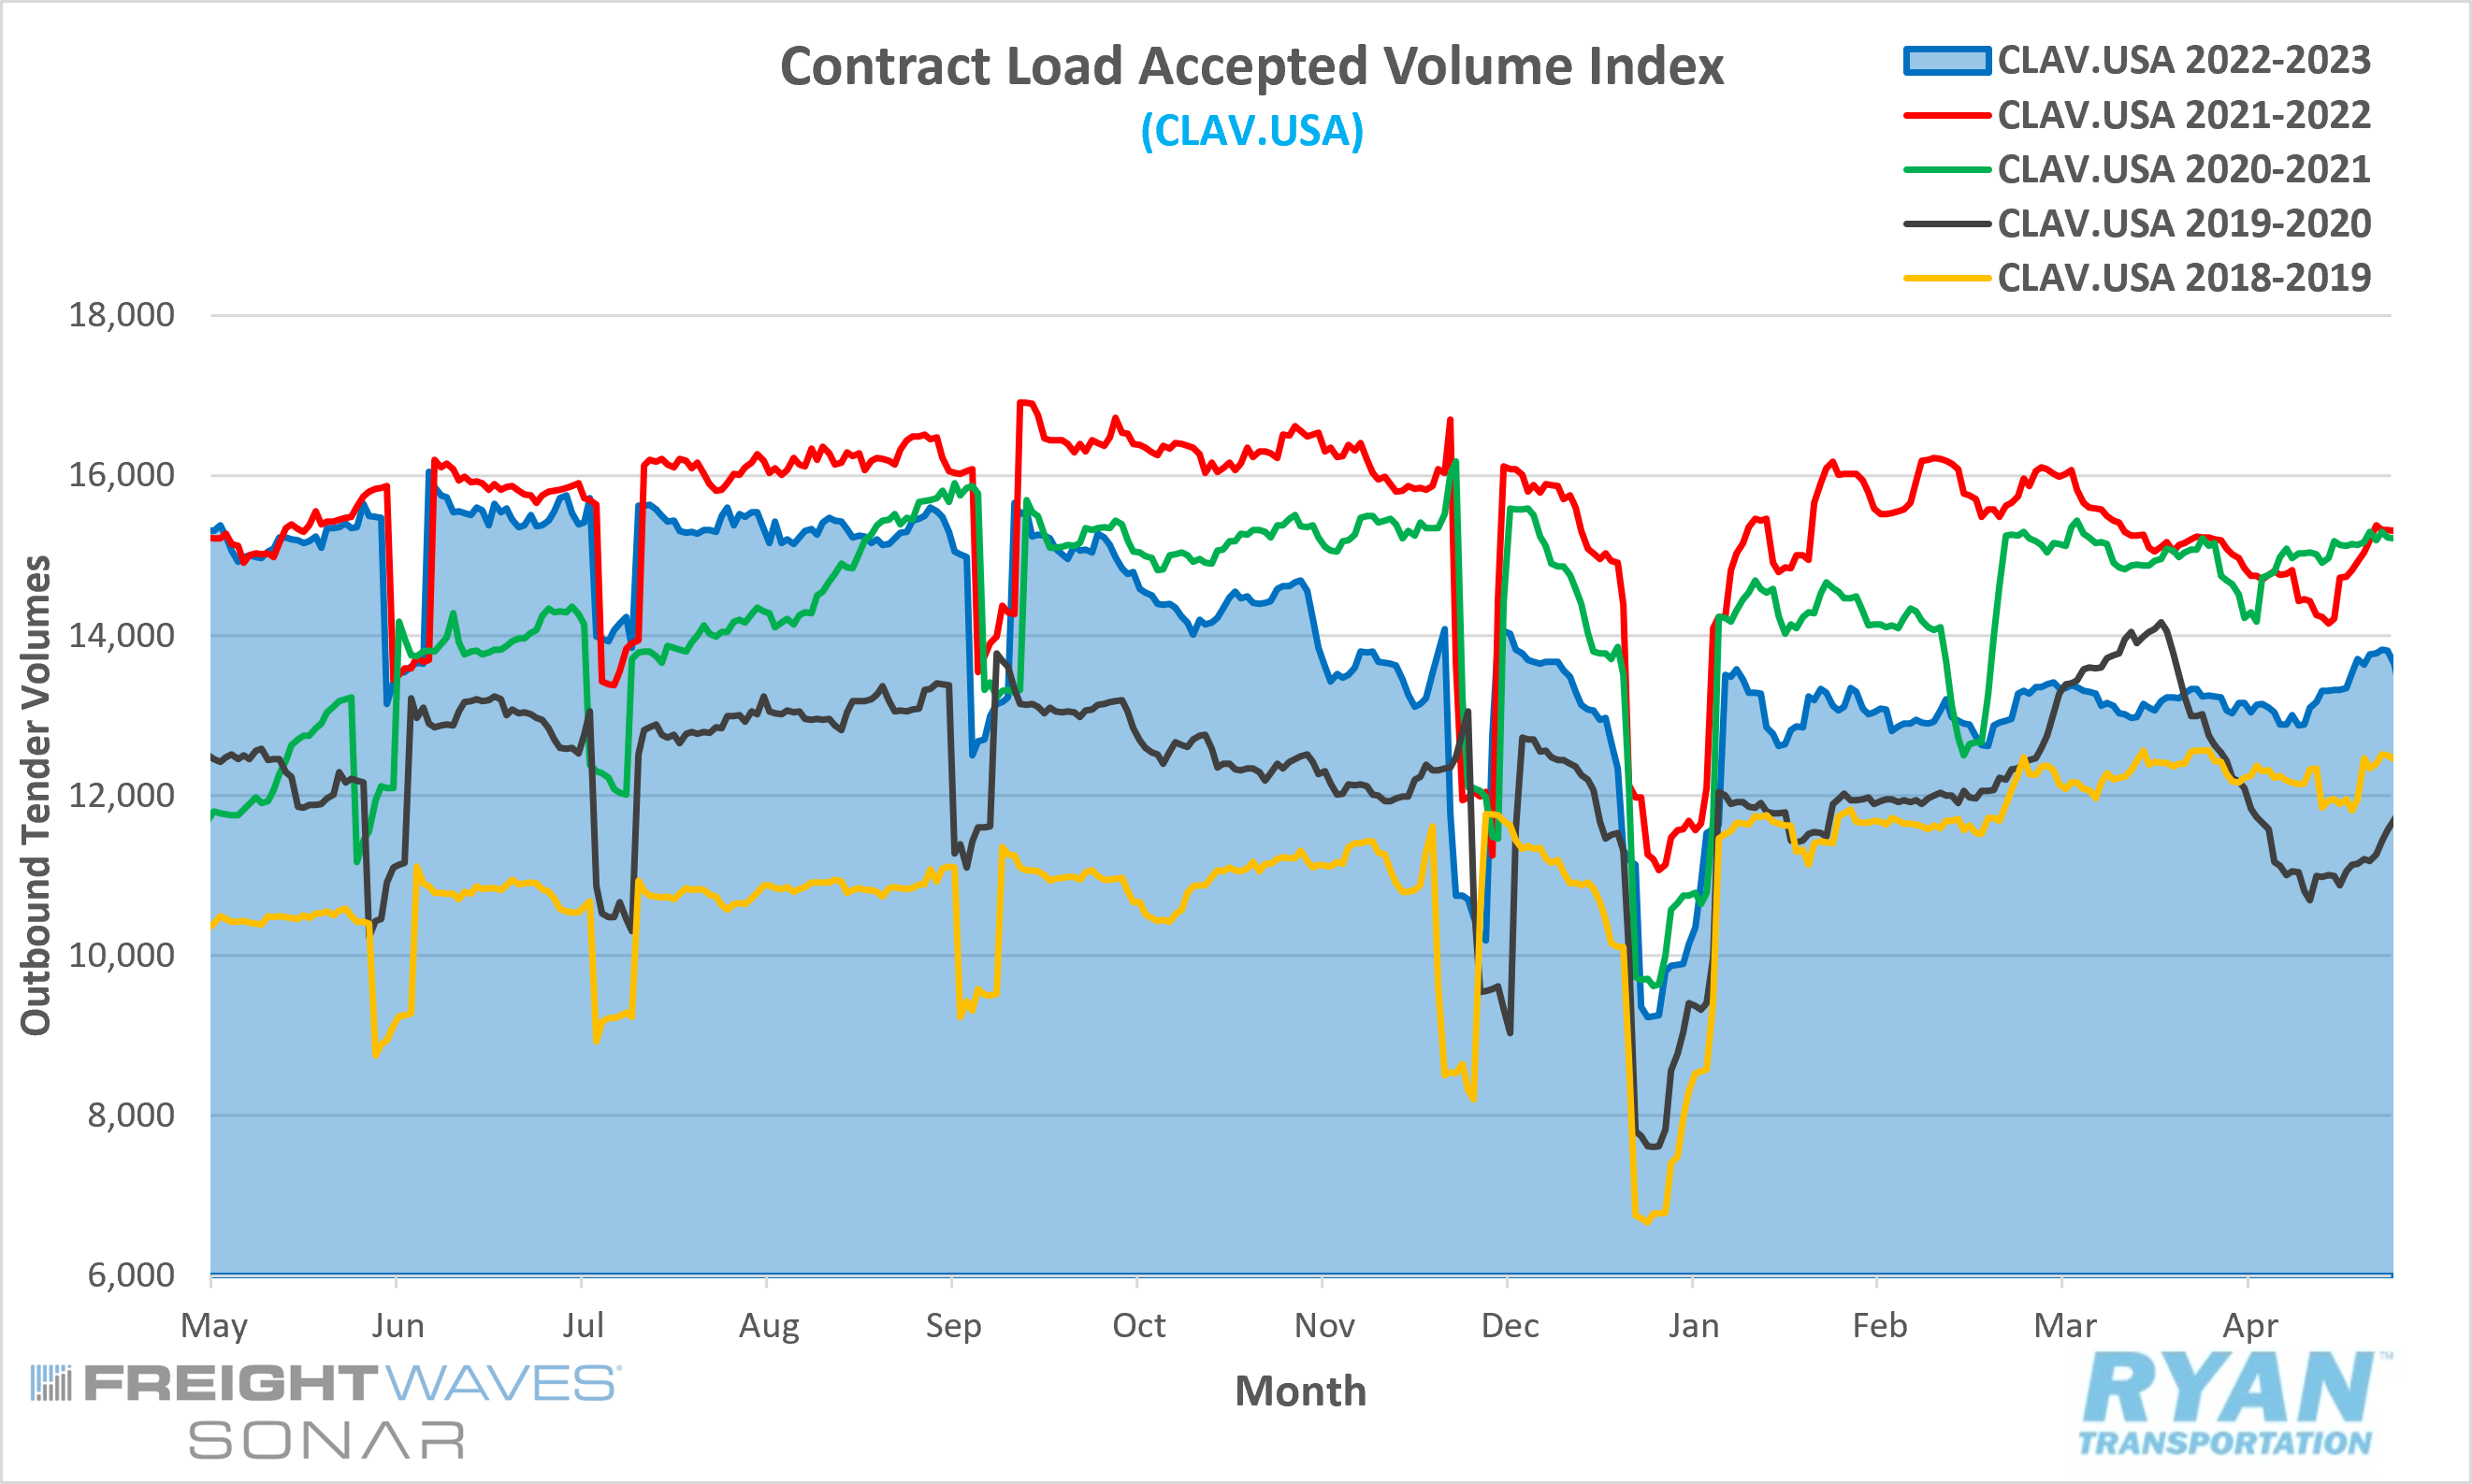
In many cases, with the start of the new quarter and projects ramping up for warmer-weather-related freight, April generally tends to be the go-live month for shippers who utilize annual contracts. With January through April being the “quiet” months for freight demand, transitioning and implementing rates toward the end of this period typically allows shippers and carriers to work out any issues prior to the seasonal shipping boom that generally arrives in May. This explains the increase in contracted load volumes in April following the relatively flat levels seen across the first quarter, as reflected by FreightWaves SONAR Outbound Tender Volumes Index (OTVI). As the deterioration of the spot market continues to apply negative pressure on contract rates, shippers are looking to capitalize on lower transportation costs while they can, before the market flips and routing guides potentially begin to fail. With new contracts underway, carriers are likely more willing to accept awarded volumes, even at a slight loss, to avoid tarnishing the relationship early on and to retain their market share. This is reflected by the 4.3% increase between the end of March and the end of April in the FreightWaves SONAR Contract Load Accepted Volume Index (CLAV), shown below, which measures carriers’ willingness to accept tender volumes moving under contractual agreements. With the increase in routing guide compliance, shippers are not forced to turn to the open market to find coverage, thus adding to the decline in spot market volumes.
Truckload Supply
Key Points
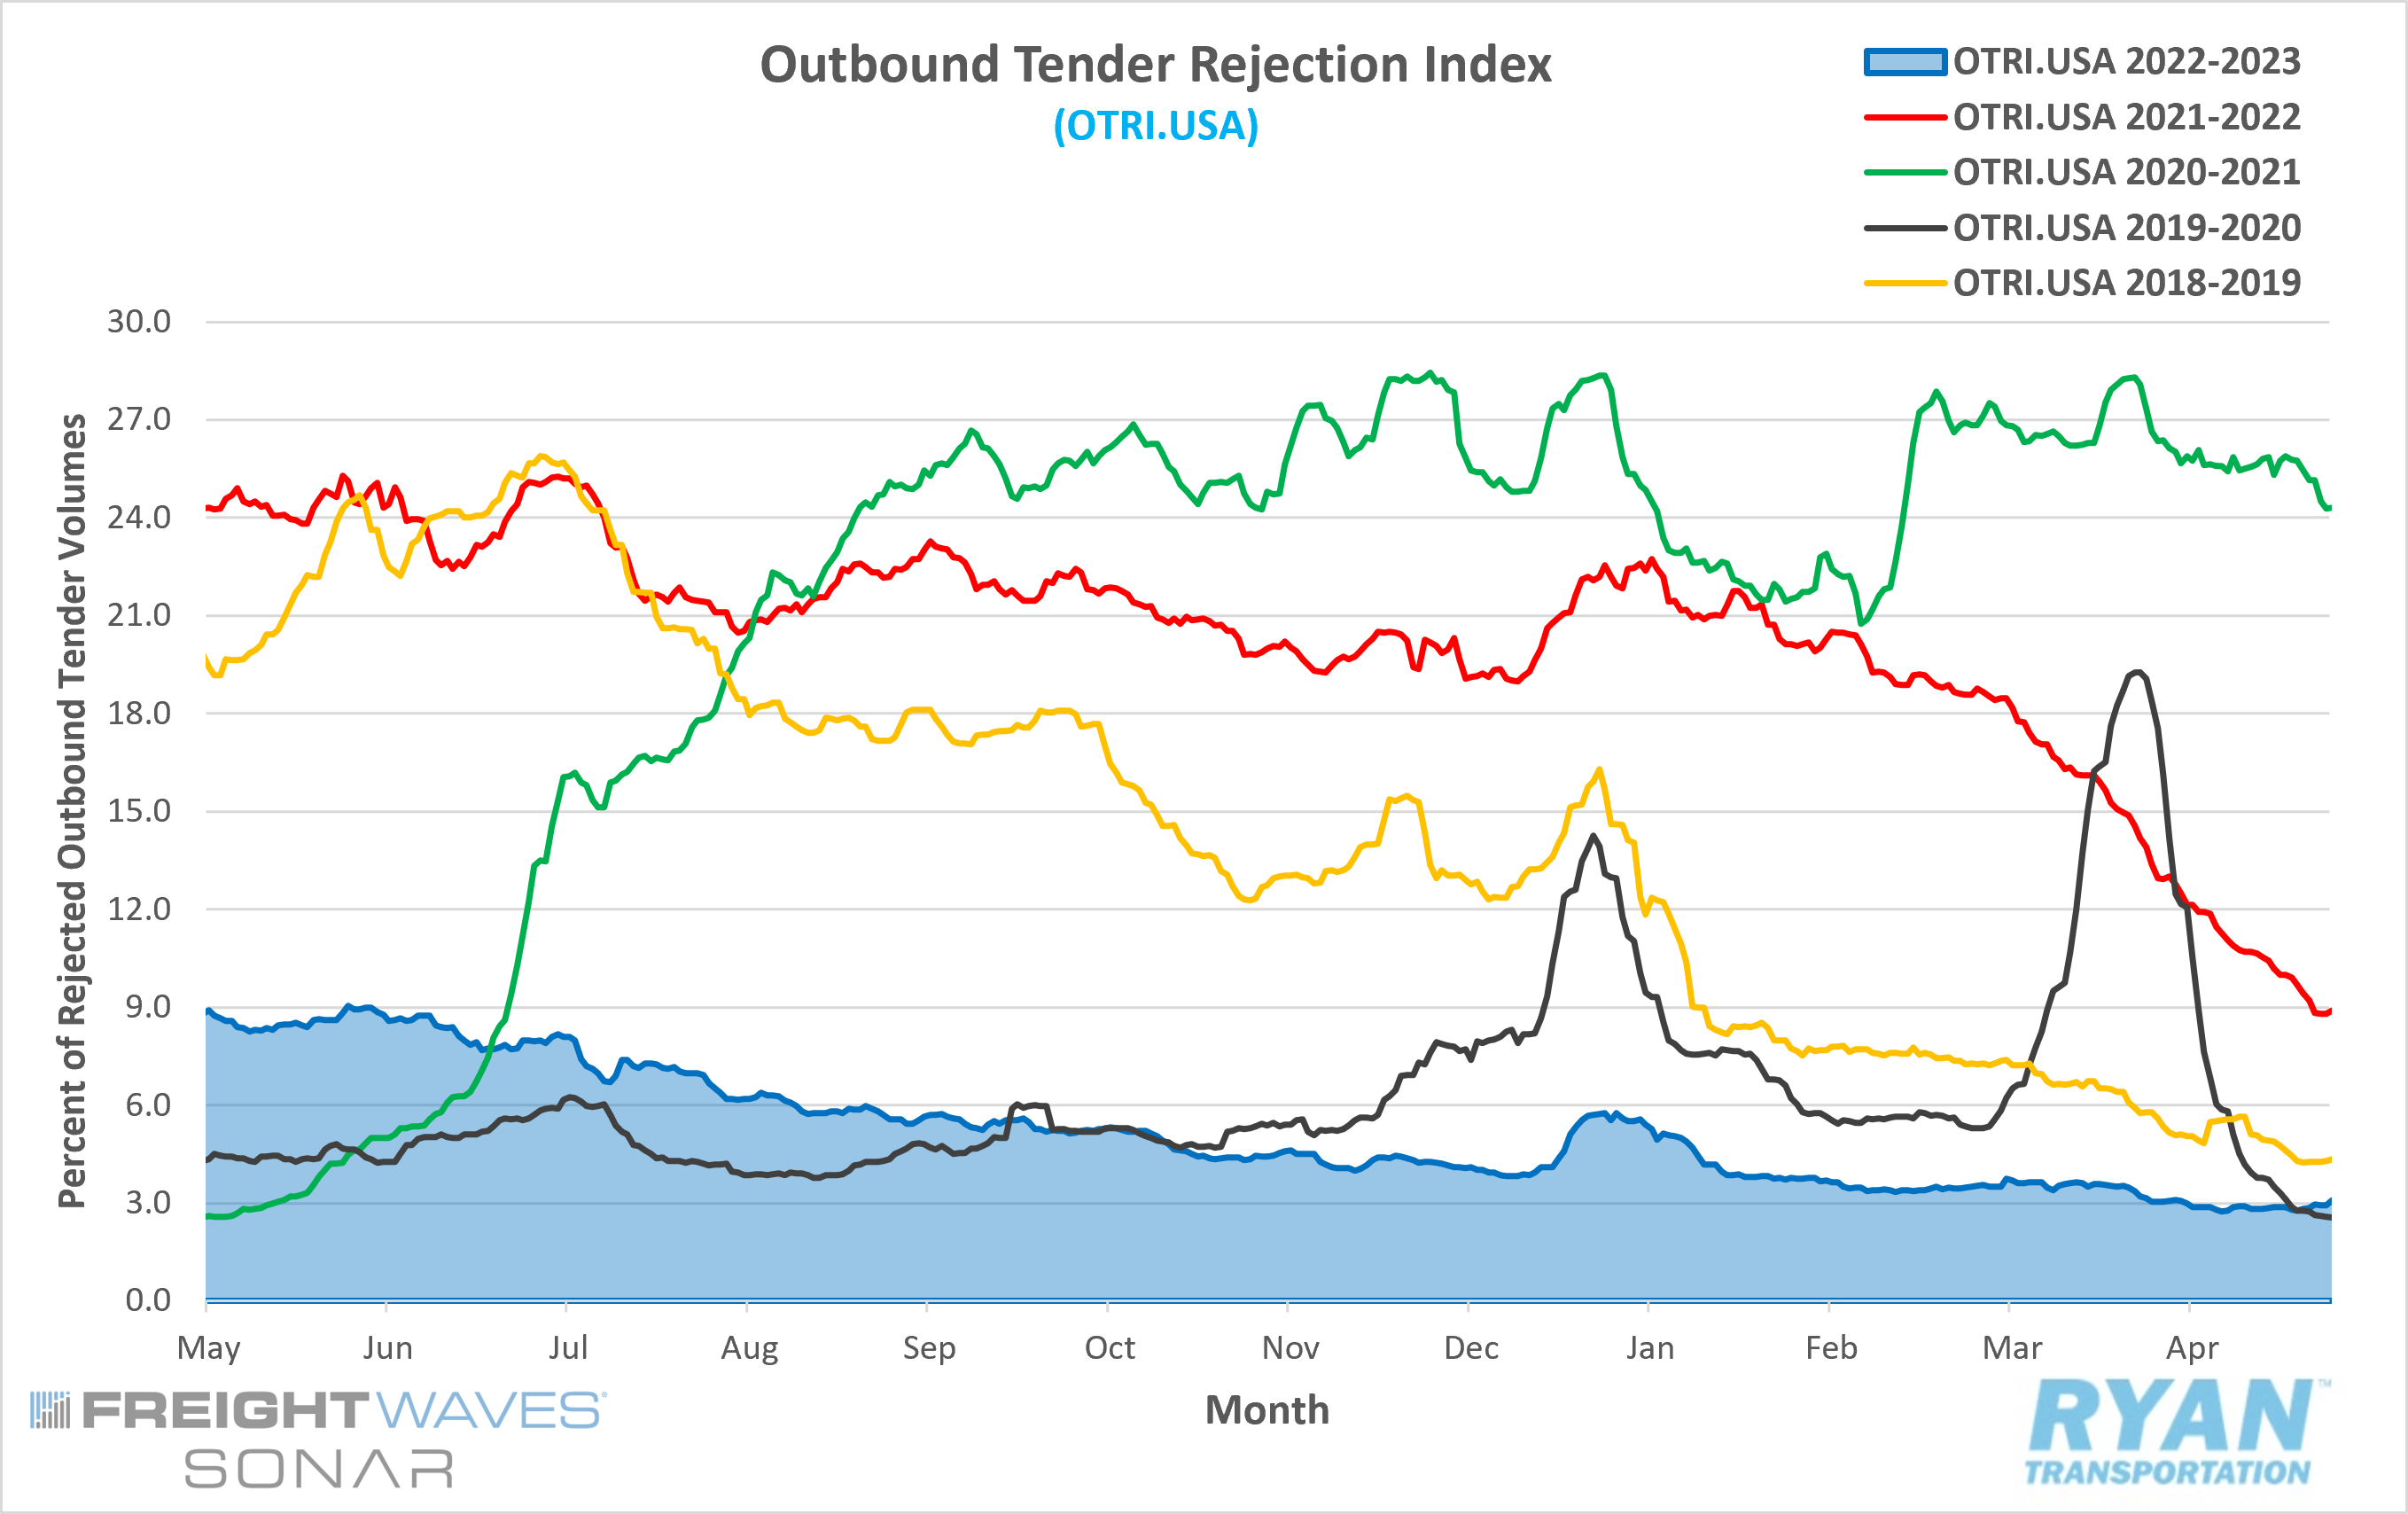
- The FreightWaves Outbound Tender Rejection Index (OTRI), which measures the number of loads rejected by carriers that are under contract as a percentage, contracted slightly in April, ending the month just over 0.1% below where it started.
- Contracted tender rejections are now 5.9% below the same time in 2022 and 21.4% below 2021 levels.
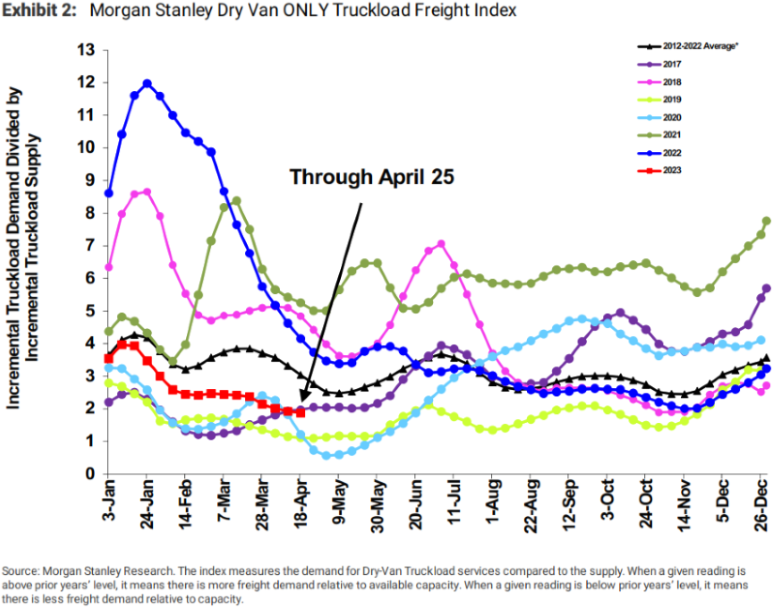
- The Morgan Stanley Truckload Freight Index (MSTLFI) saw slight sequential declines through April and has remained below the long-term average since August 2022. Despite the declines, the index outperformed seasonality for the second time this year, after 16 consecutive weeks of underperformance.
Summary
Rejection rates of contracted load tenders continued searching for a floor in April, even hitting its lowest point since the pandemic at 2.75% on April 12. The only other times the index registered below 2.75% coincidentally occurred in April and May of 2020 when production and shipping was halted due to the mandatory lockdown. Since the FreightWaves SONAR Outbound Tender Rejection Index was established in 2018, rejection rates on average have fallen roughly 5.4% in the month of April, making the declines in April of this year not completely uncharacteristic. While the 0.1% drop this past month was the smallest margin of decline compared to the same time frame over the last five years, it is worth noting that the rate of change becomes less significant as the index approaches zero. Regardless, the sequential monthly decline in rejection rates continues to reflect that an imbalance remains between truckload supply and overall demand.
Truckload Capacity Outlook
Key Points
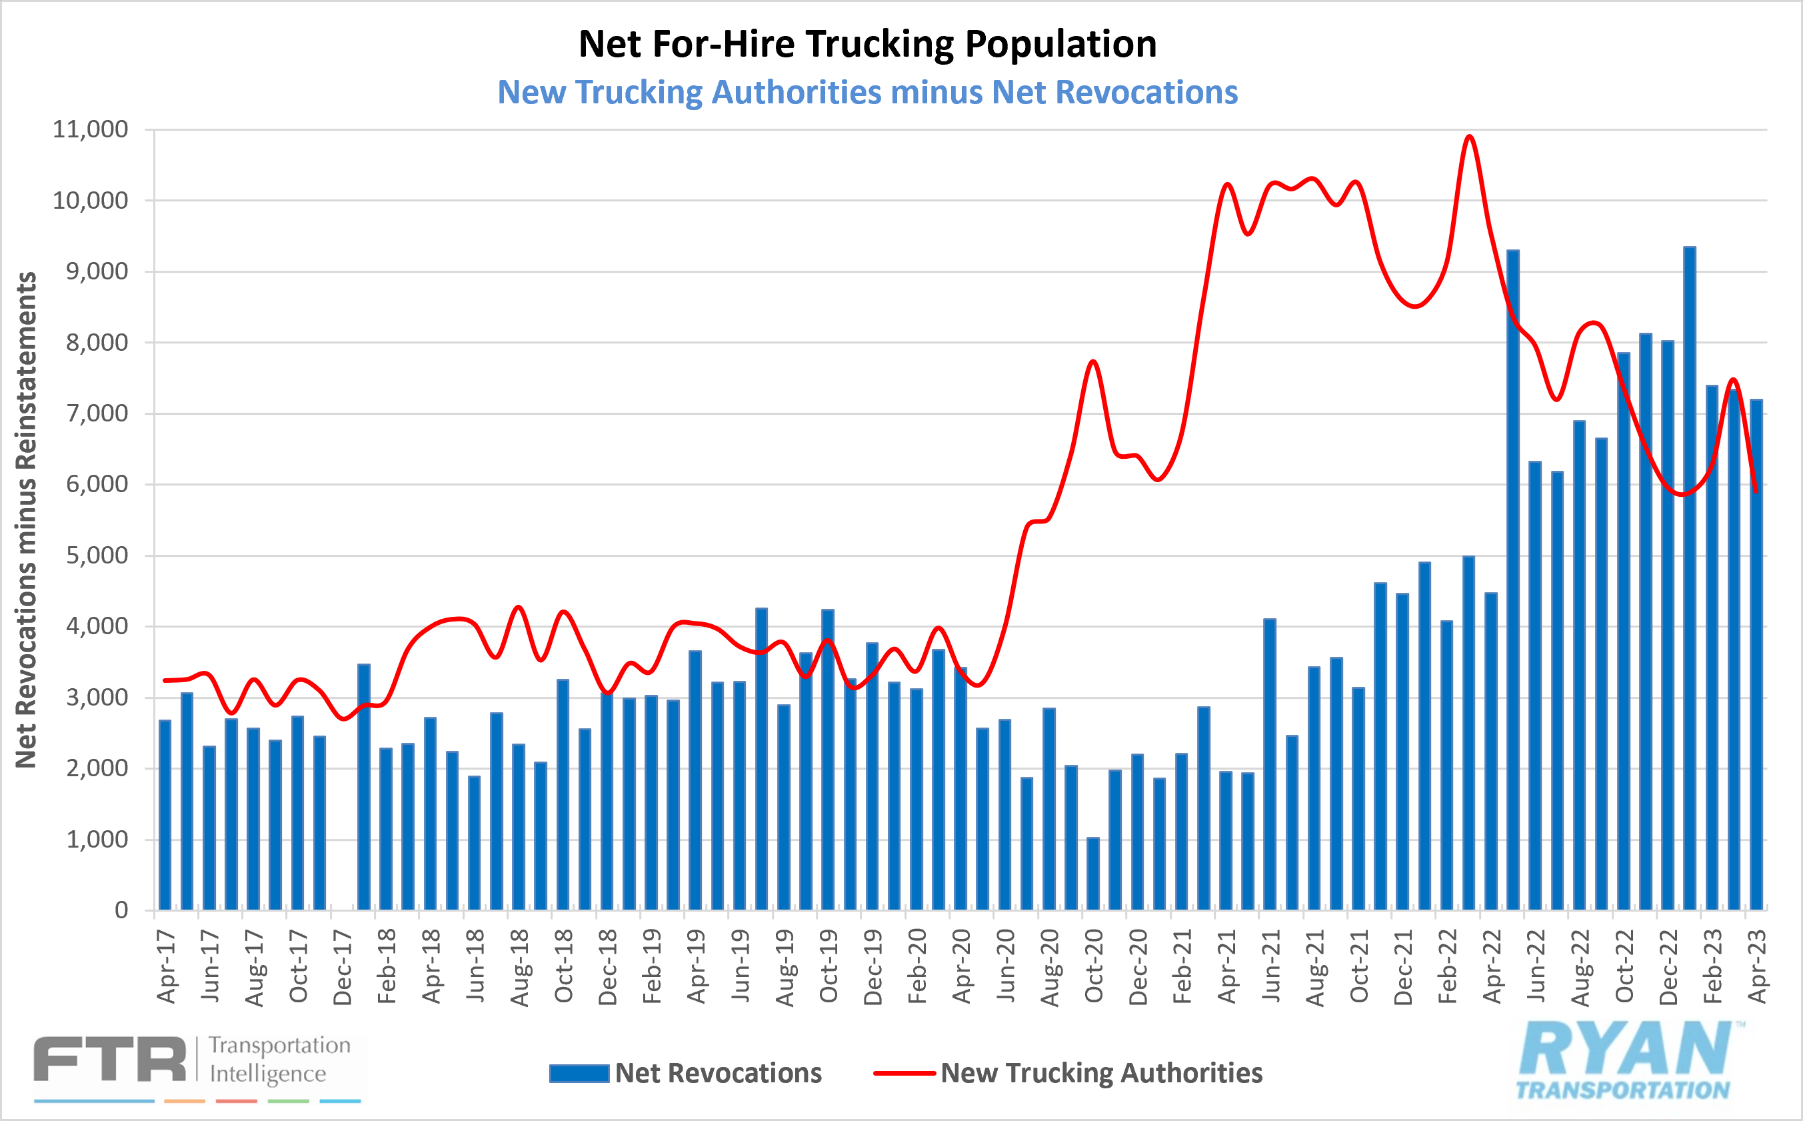
- FTRs preliminary analysis of the Federal Motor Carrier Safety Administration (FMCSA) data indicates net revocations, which are revocations of operating authority minus reinstatements, totaled 7,199 in April, around 1,409 fewer than March's total.
- Newly authorized for-hire trucking companies fell sharply in April, with 5,905 new carriers entering the market, well below the 7,478 recorded in March.
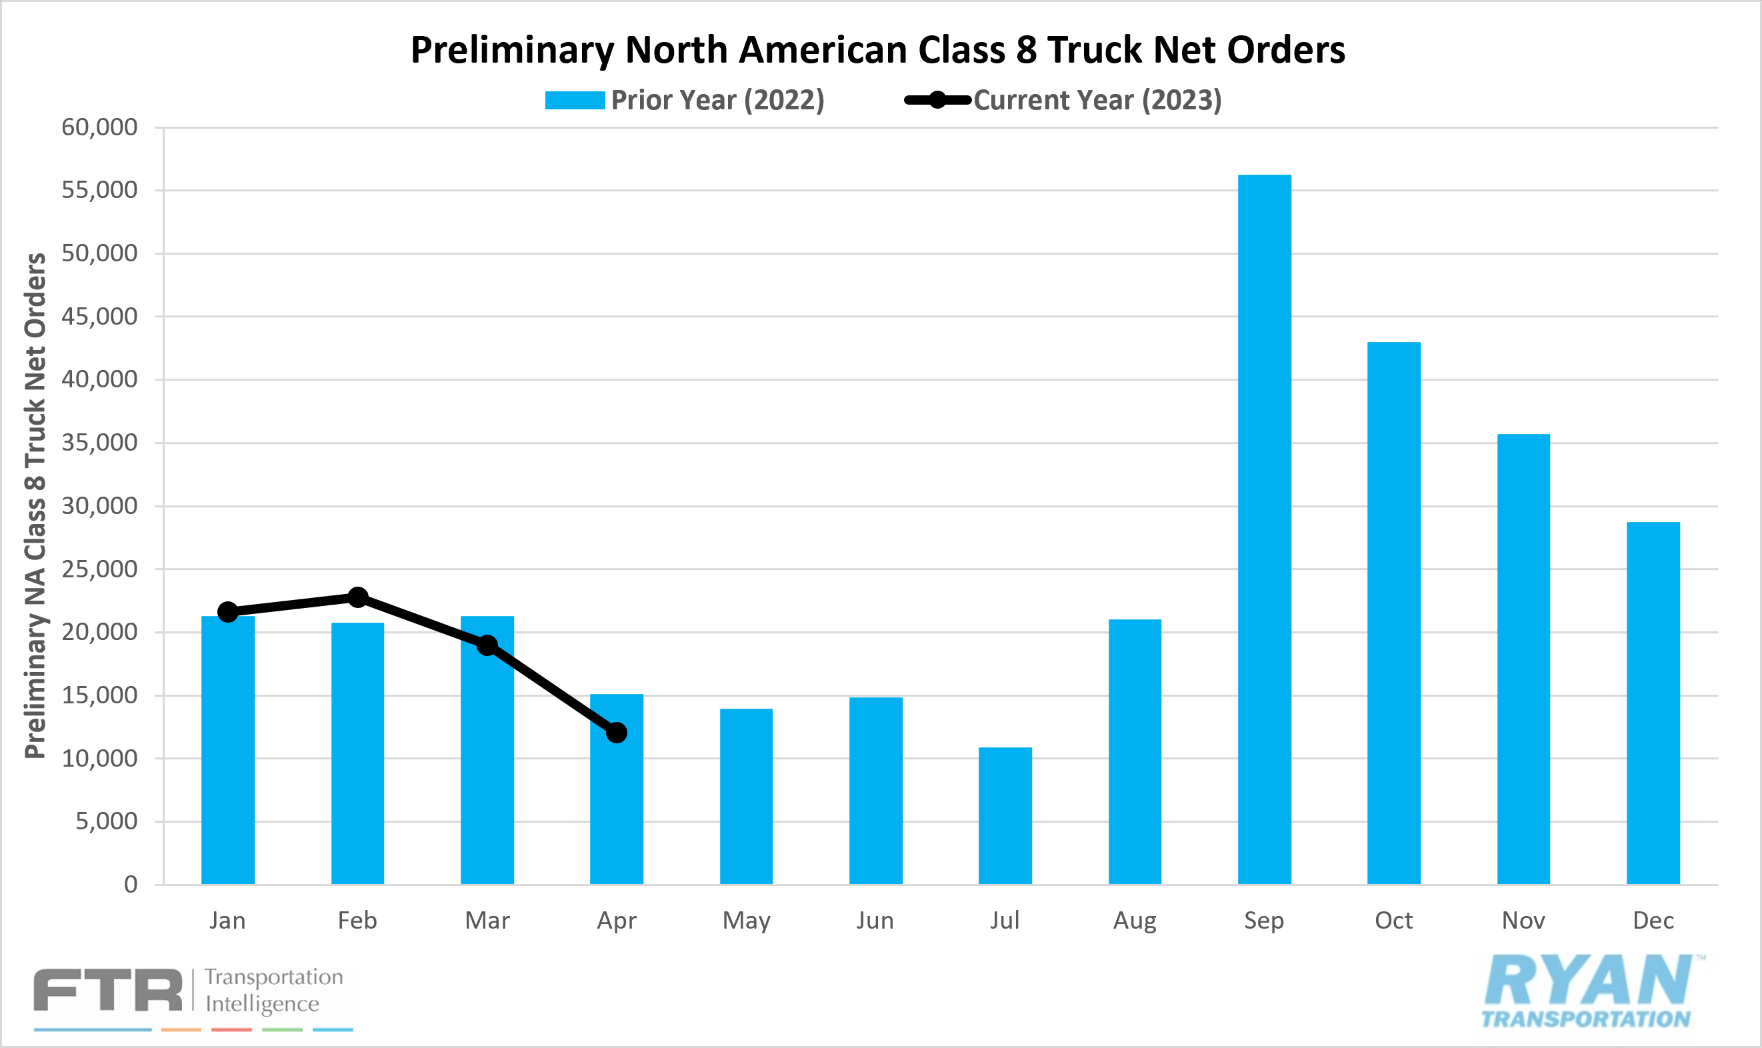
- According to FTR reports, preliminary Class 8 orders fell in April for the sixth time in the last seven months to 12,050, a 37% MoM decline, putting it 20% below last year’s levels.
Summary
The slight increase in transportation and for-hire trucking jobs was minimal in April compared to the strong gains seen in Q2 and Q3 of last year. The flattening of jobs within the sector could be a sign that the total driver force is starting to decline as more carriers are choosing to leave the market than enter it. The net change in carrier population resumed its downward trend in April after the slight bump in March, with 1,294 more authority revocations than newly authorized carriers. With overall freight volumes appearing to stabilize and employment levels flattening, the continued negative trend in the carrier population implies the return of activity back to contract from spot is likely nearing its end, per FTR.
Fuel Prices
Key Points
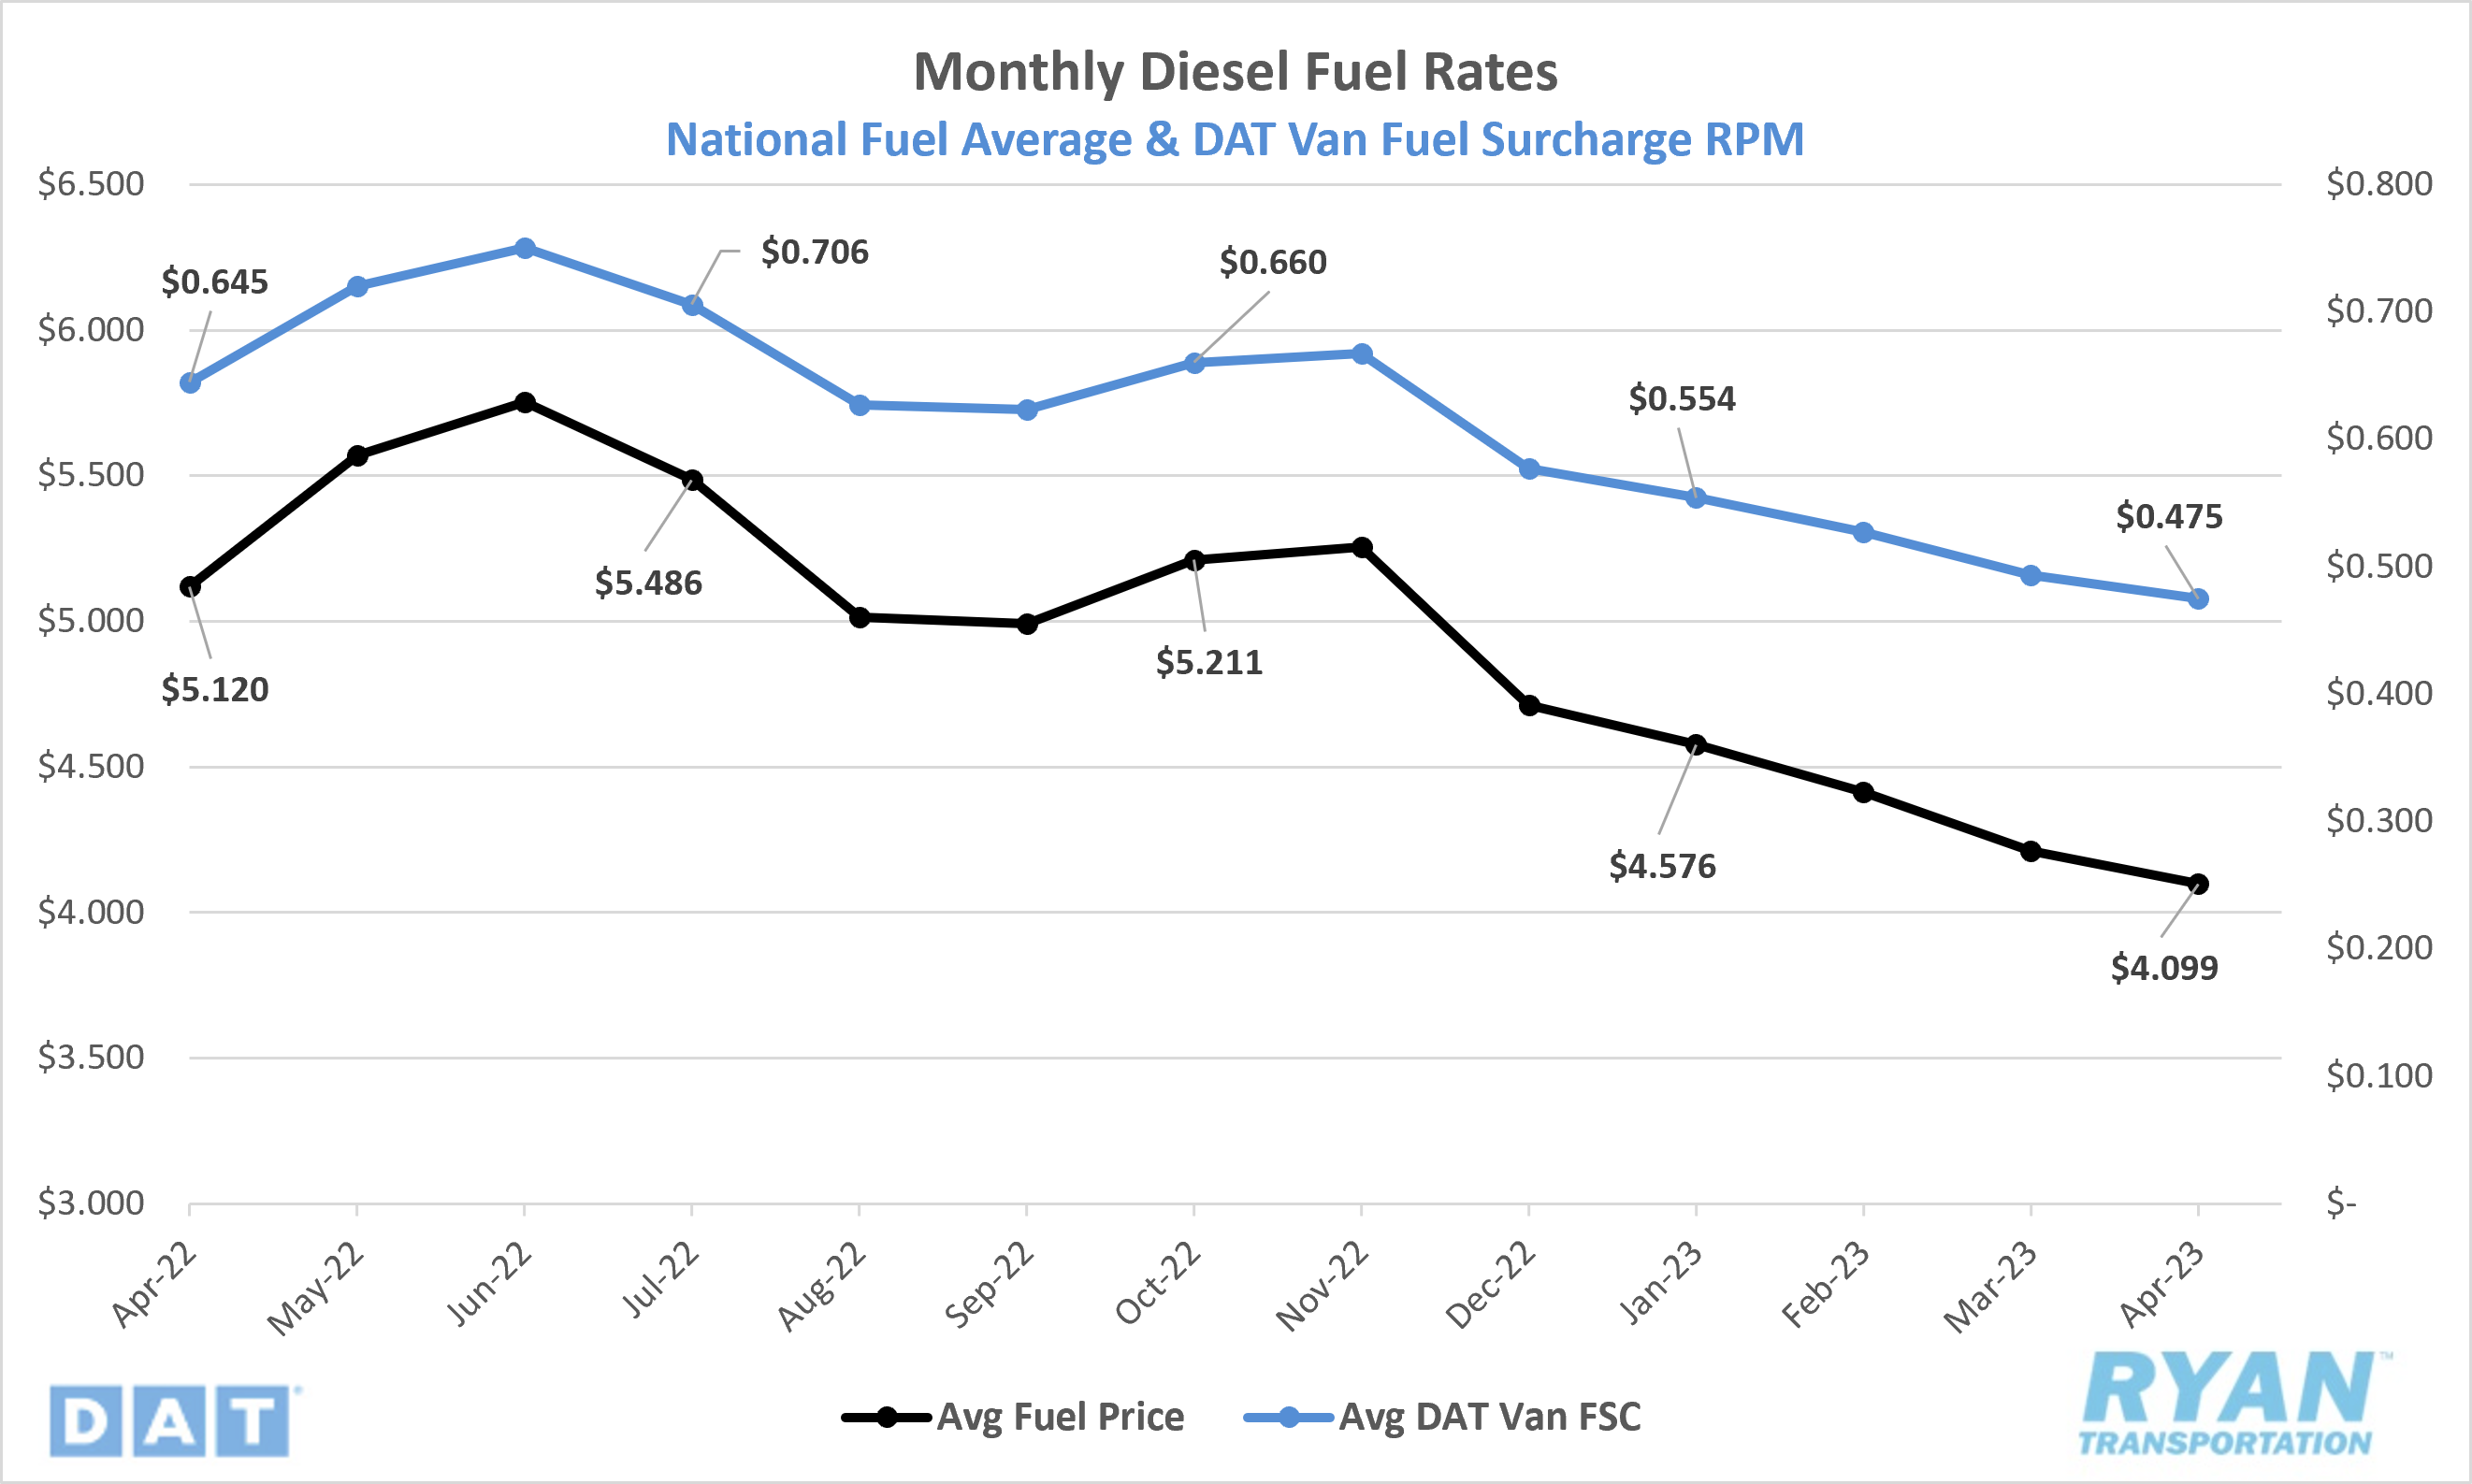
- Fuel prices declined for a sixth consecutive month in April as the national average price of diesel ended the month down 2.6% MoM from March.
- On an annual basis, the national average diesel price in April was 19.9% below 2022 levels when fears of global supply shortages from Western sanctions on Russia began to ramp up.
- Crude inventories decreased by 10.32 million barrels versus the -4.26 million consensus between the weeks ending April 7 and April 28, according to the EIA.
Summary
Following back-to-back increases the last two weeks of January, fuel prices declined steadily for 10 consecutive weeks until a slight uptick by about $0.018 snapped the streak in the third week of April. An increase in travel for the holiday weekend is likely to blame, with the gains being completely wiped out by the following week as prices resumed their downward trend. The national average price of diesel has now fallen by more than $0.50 from the start of the year, putting it just over $1.73 below the record high of $5.810 set in the second week of June 2022. The production cuts announced by OPEC+ at the start of the month sent oil futures soaring in early April before steadily deteriorating through the rest of the month. This was based on the weaker-than-expected post-pandemic rebound in China and heightened concerns over the future health of the U.S. economy and potential for recession.
Why It Matters: Prices continuing to fall, despite the reduction in supply from OPEC+, creates a lot of uncertainty surrounding how weak global demand truly is in the oil market. While the true impact of the production cuts has yet to be measured as they go into effect in May, the continued deterioration in oil futures prices could be interpreted as justification for the decision and open the discussion to further supply reduction at the next OPEC+ meeting in June. According to the latest data from the EIA, draws on crude inventories exceeded consensus by just over 6 million barrels in April while domestic refinery utilization and production remained relatively flat. The near-term outlook is likely to see this trend continue as lower prices lead to slimmer margins for refiners, resulting in less incentive to increase production. Under normal conditions, the current supply choke could be problematic ahead of the warmer driving months, as increased demand forces wholesalers/retailers to replenish depleted inventories quicker than normal, causing price surges. However, the wavering confidence in economic activity, combined with the potential for a recession hanging in the balance, would only further weaken demand, keeping fuel prices low and continuing to insulate carriers from declining rates.
Dry Van Overview
Spot Rates
Key Points
- The national average dry van spot rate excl. fuel surcharge ended April at $1.589, a 5.2%, or $0.087, decline from March, while the national average dry van contract rate excl. fuel fell 1.8%, or $0.041, to $2.205.
- Dry van linehaul spot rates registered 25.5% below previous year levels and 17.4% below the 5-year average.
Load-to-Truck Ratio
Key Points
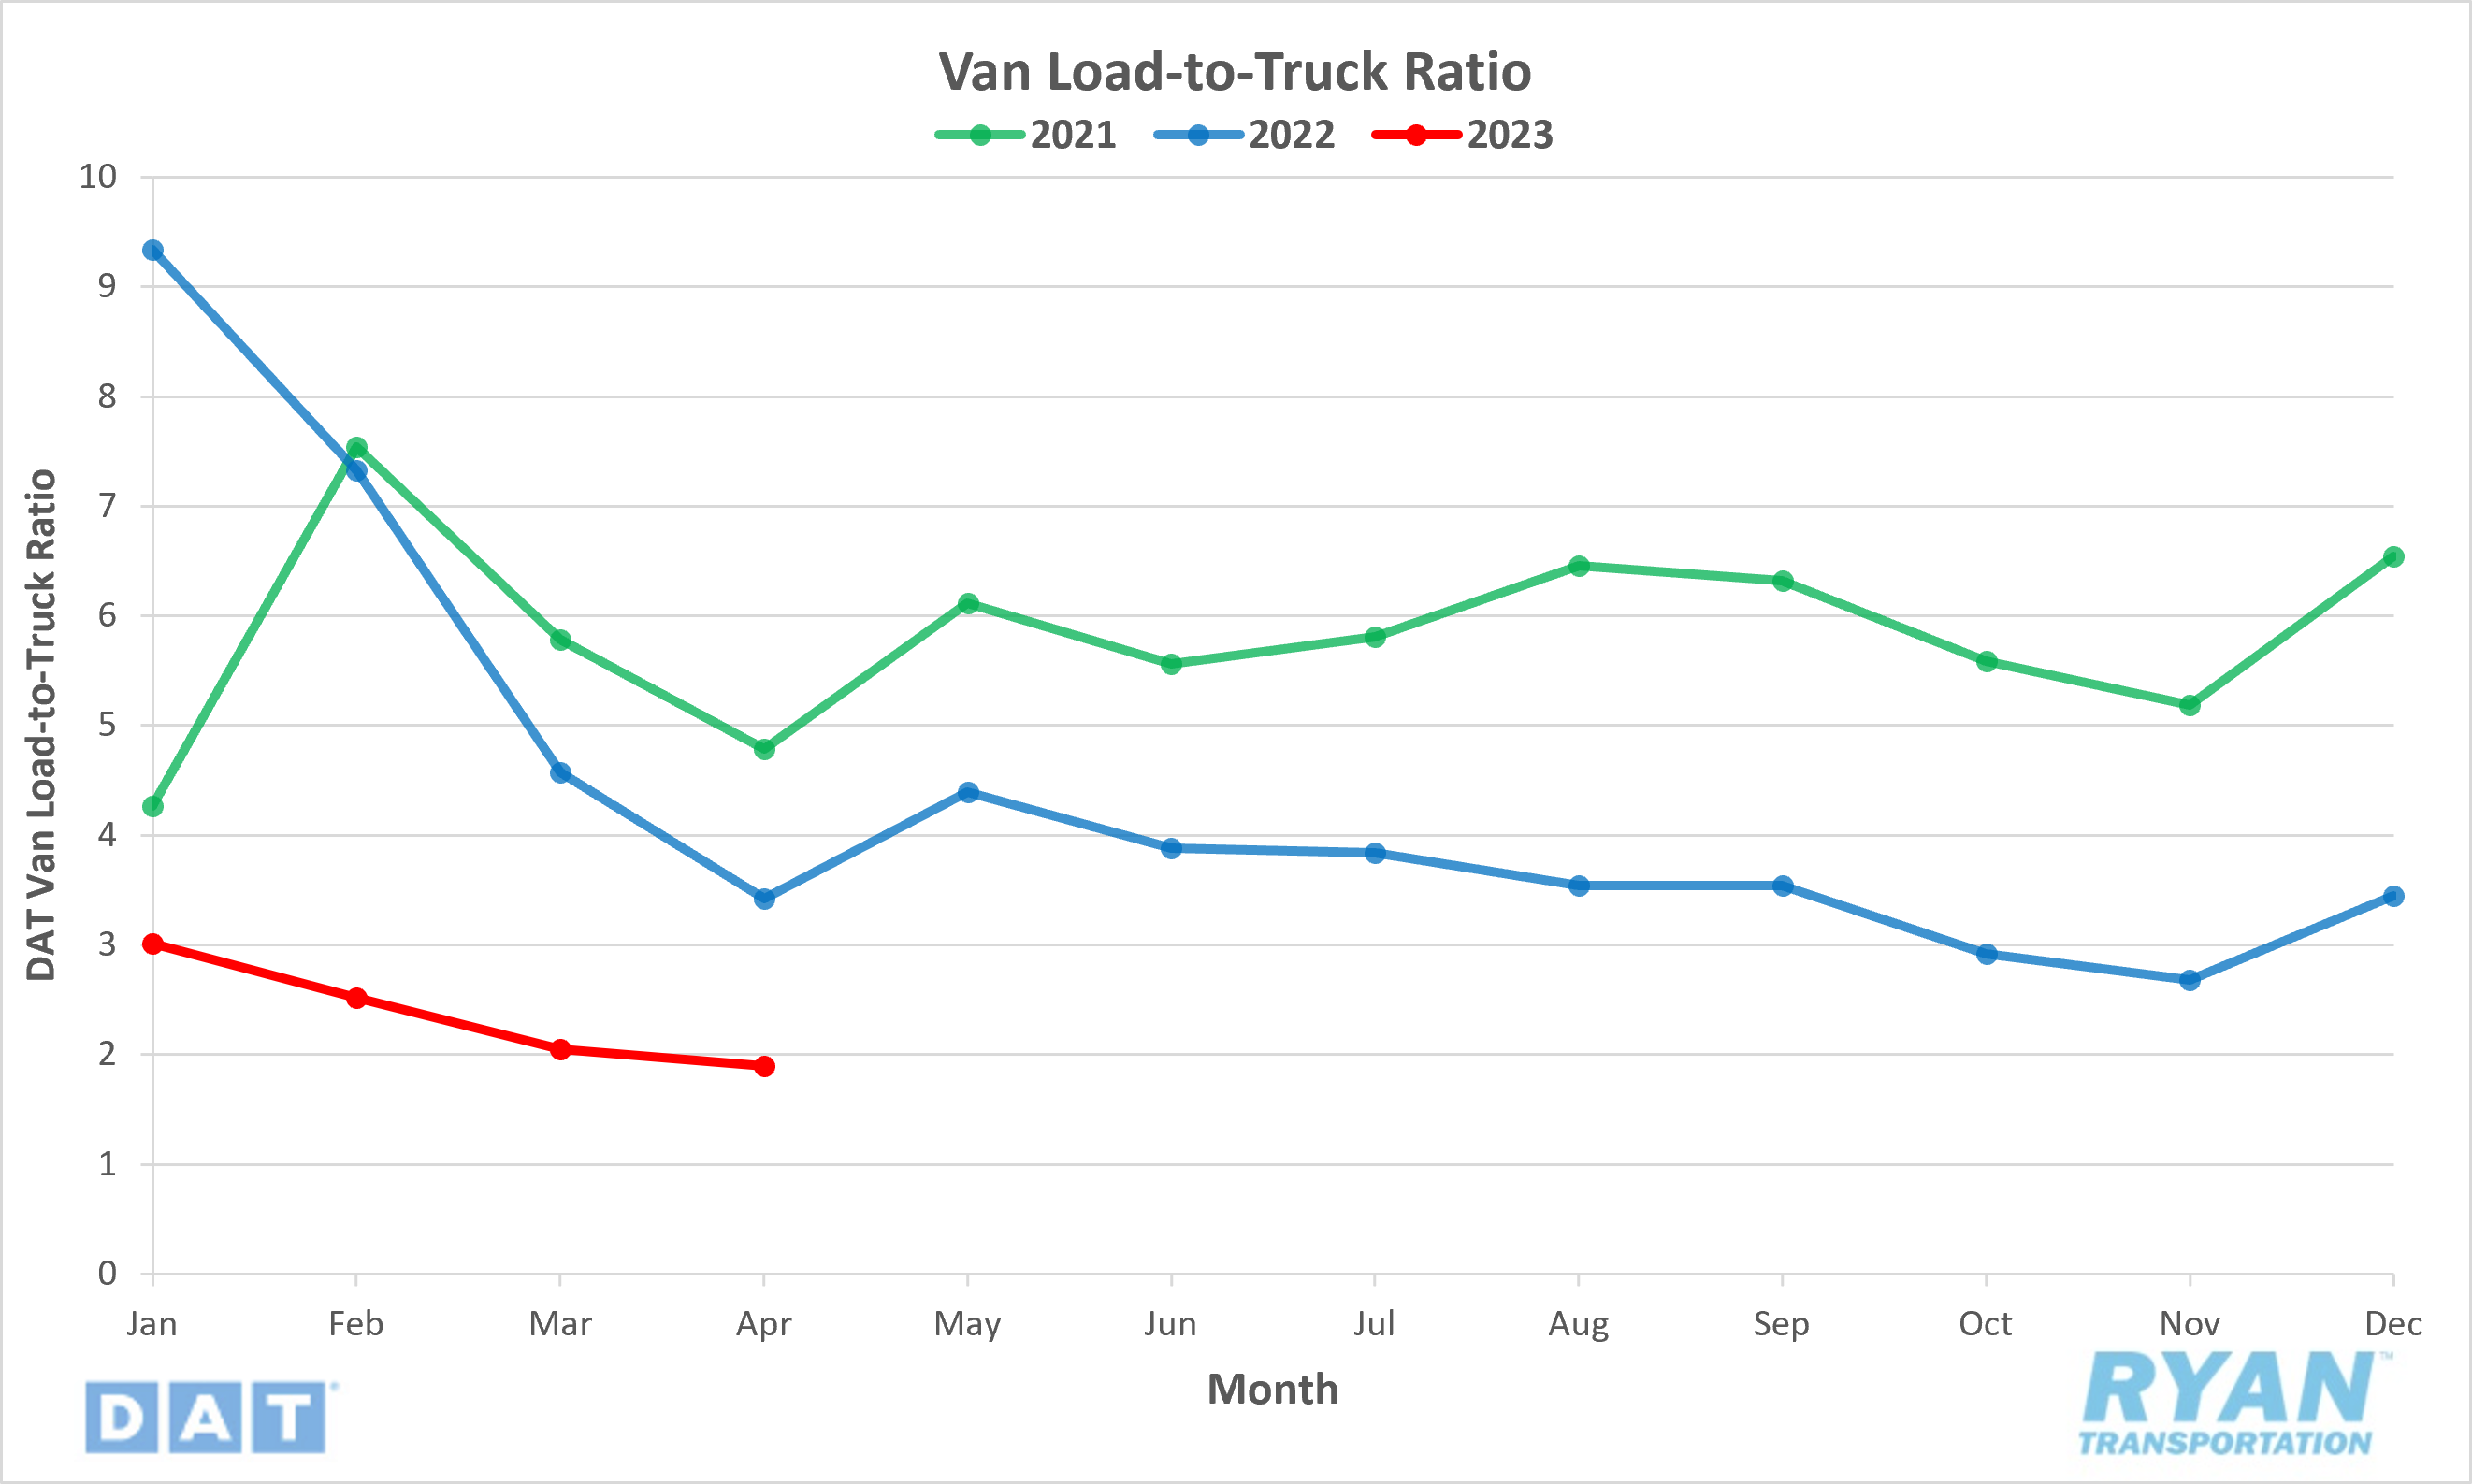
- The dry van load-to-truck ratio dropped 7.3% MoM in April and was down 44.4% from the same time last year.
Market Conditions
Dry Van Summary
Dry van linehaul spot rates at the end of April were down 17.8%, or $0.35, from the first week of the year. While linehaul rates in the dry van market, and the truckload market as a whole, continue searching for a floor, pockets of capacity shortages have begun to develop across the southern portion of the U.S. and into Northern and Southern California. The 7.3% decline in the dry van load-to-truck ratio (LTR) recorded in April snapped the trend of double-digit declines in the last three consecutive months and was relatively flat compared to the declines in the same month in 2021 and 2022 of 17.1% and 25.2% respectively. While the upcoming produce season is generally geared more toward refrigerated carriers, it can create negative pressure on available dry van capacity. As refrigerated carriers chase higher paying produce freight, it reduces the available capacity for non-perishable items that can utilize either dry van or reefer trailers. Depending on the influx of produce volume in the coming months, the dry van market could begin to see further tightening through Q2.
Reefer Overview
Spot Rates
Key Points
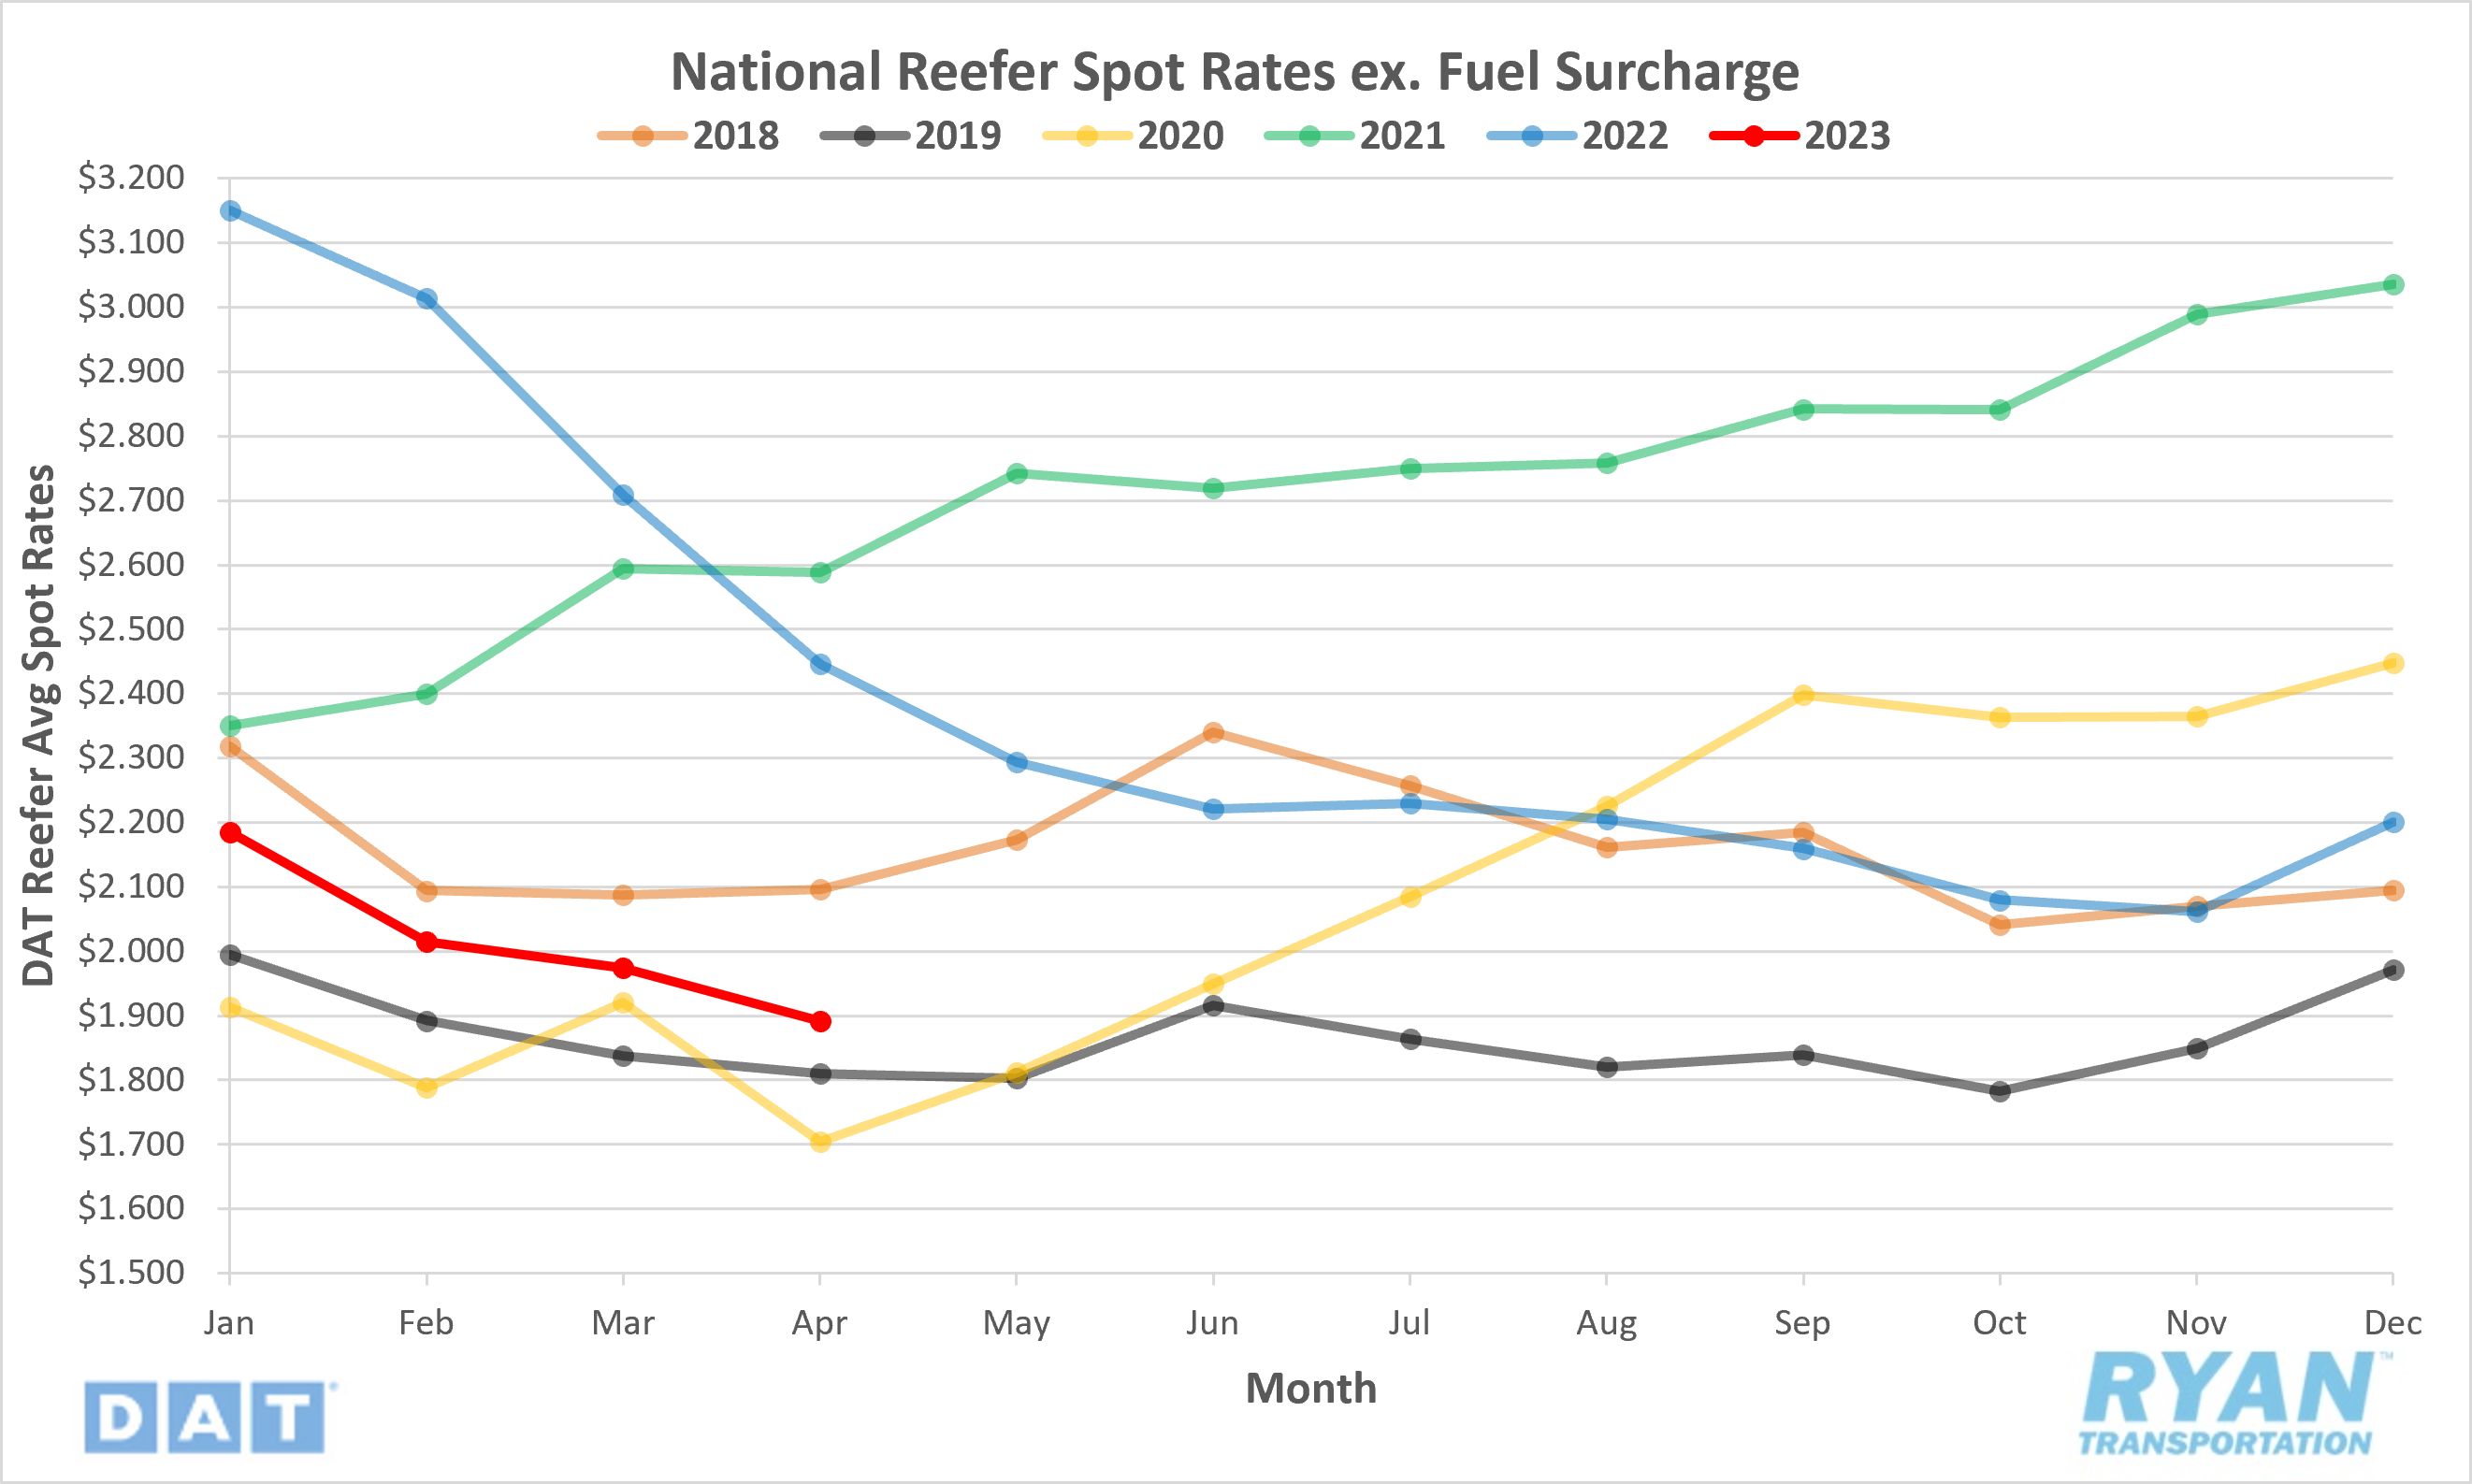
- The national average reefer spot rate excl. fuel surcharge declined by 4.2%, or $0.083, in April to $1.892 while the national average contract rate excl. fuel fell 1.2%, or $0.03, to $2.492.
- Reefer linehaul spot rates in April were 22.7% below 2022 levels and 15.6% below the 5-year average.
Load-to-Truck Ratio
Key Points
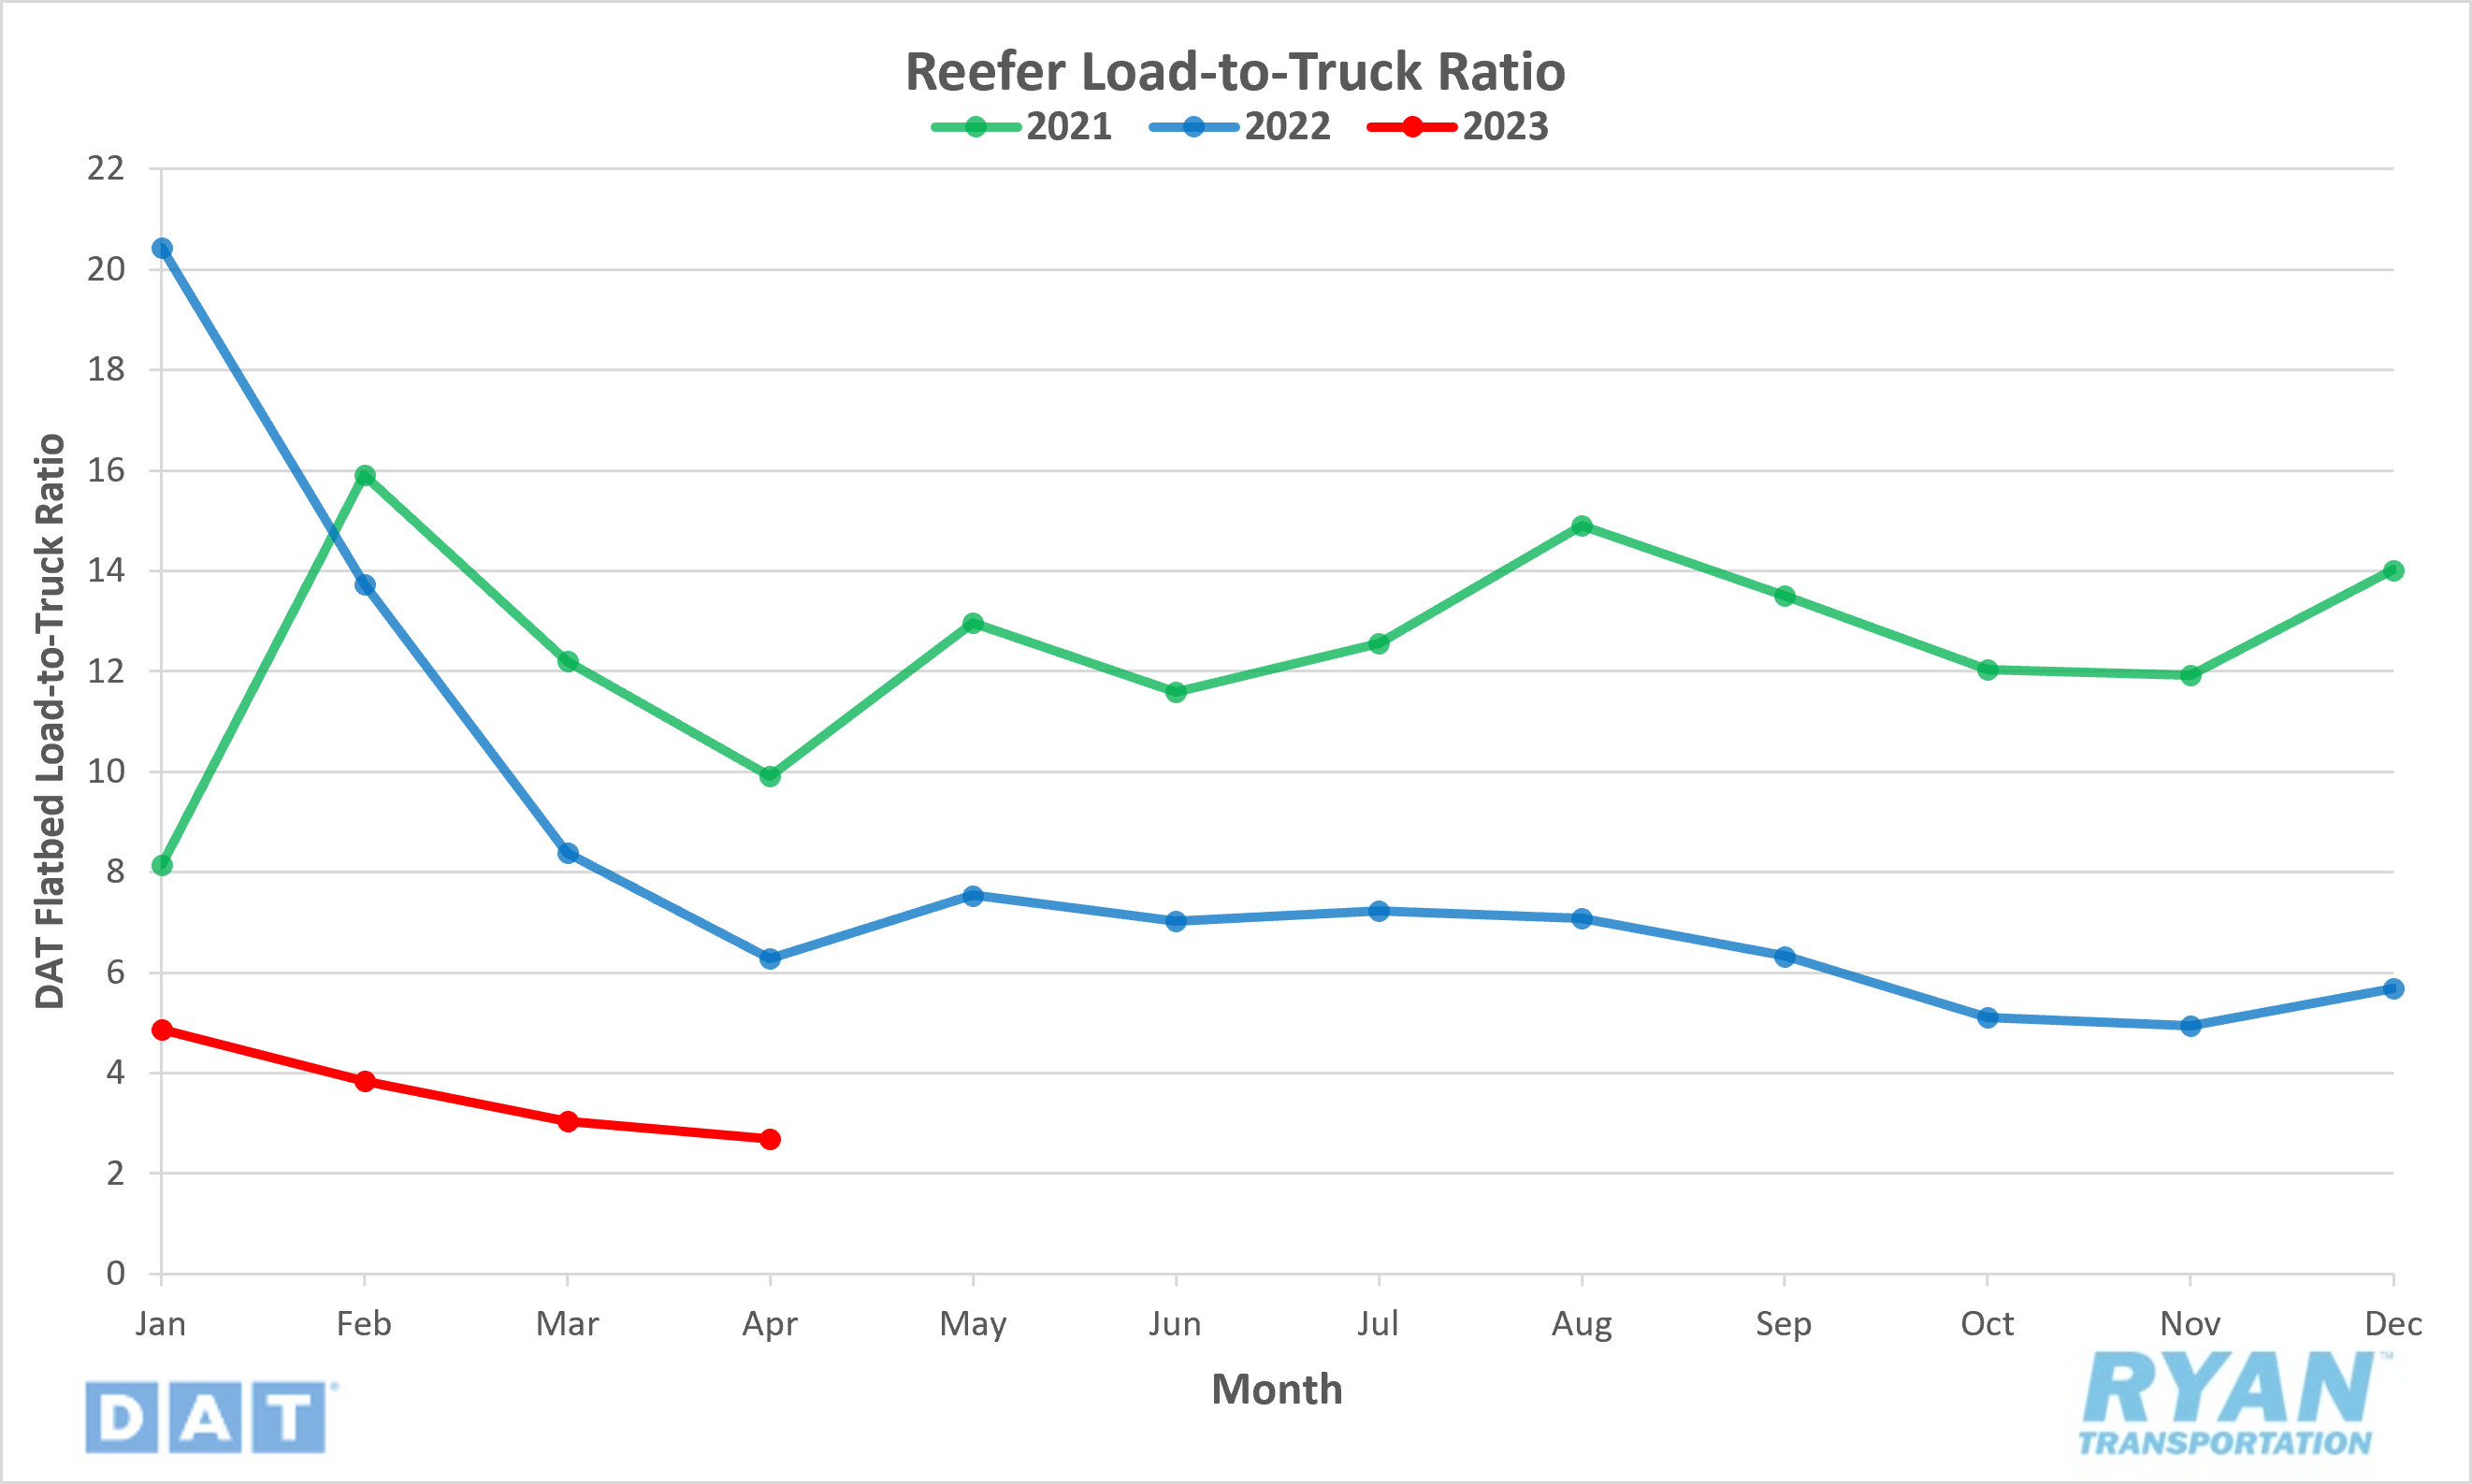
- The reefer load-to-truck ratio fell 11.2% MoM in April and sits 57.1% below 2022 levels.
Market Conditions
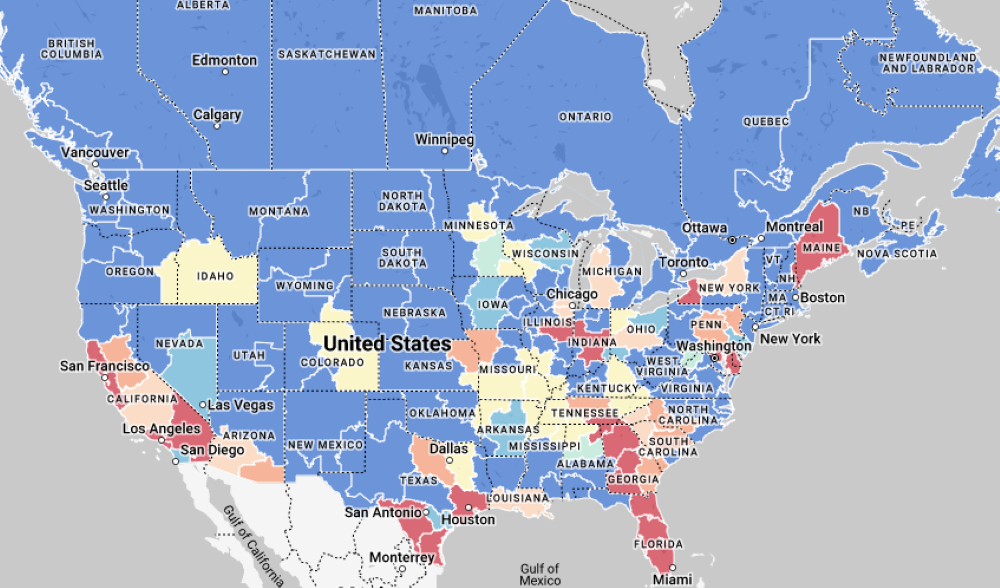
Reefer Summary
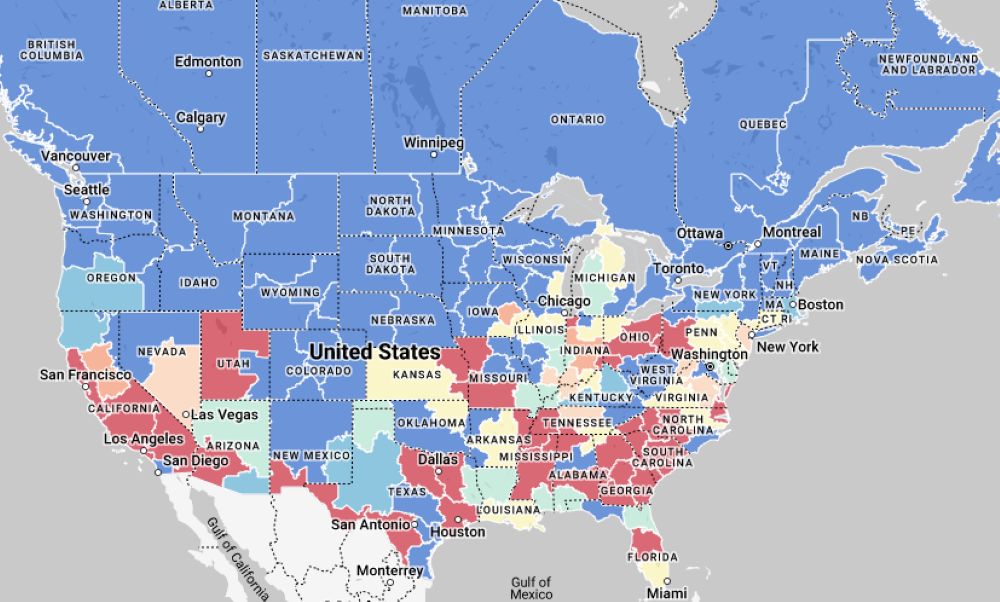
The refrigerated segment continues to be the most impacted by the downturn in the market, with linehaul rates sitting 19.4%, or $0.47, below where they started the year. April is generally welcomed relief by refrigerated carriers after the slowdown in Q1, as produce season is beginning to get underway. So far this year, though, produce volumes have not made much of an impact compared to previous years, as there still remains an abundance of available capacity in the market. The only caveat is that it is still early in the produce season, so we have yet to get a true measure of how much influence this year’s harvest will really have on rates. As reflected in the reefer market conditions map (above), warmer regions like Florida and the southern parts of Texas and California have already seen produce shipping ramp up. The initial demand surge from the April harvest can provide some insight into how significant the capacity shift will be into the summer months. In a normal market, inbound and outbound rates from areas with the highest produce transportation demand can fluctuate anywhere from 15 - 25% of their annual averages. With the current market still oversupplied by carriers, we expect the fluctuation to be much less dramatic pending any significant weather or economic events.
Flatbed Overview
Spot Rates
Key Points
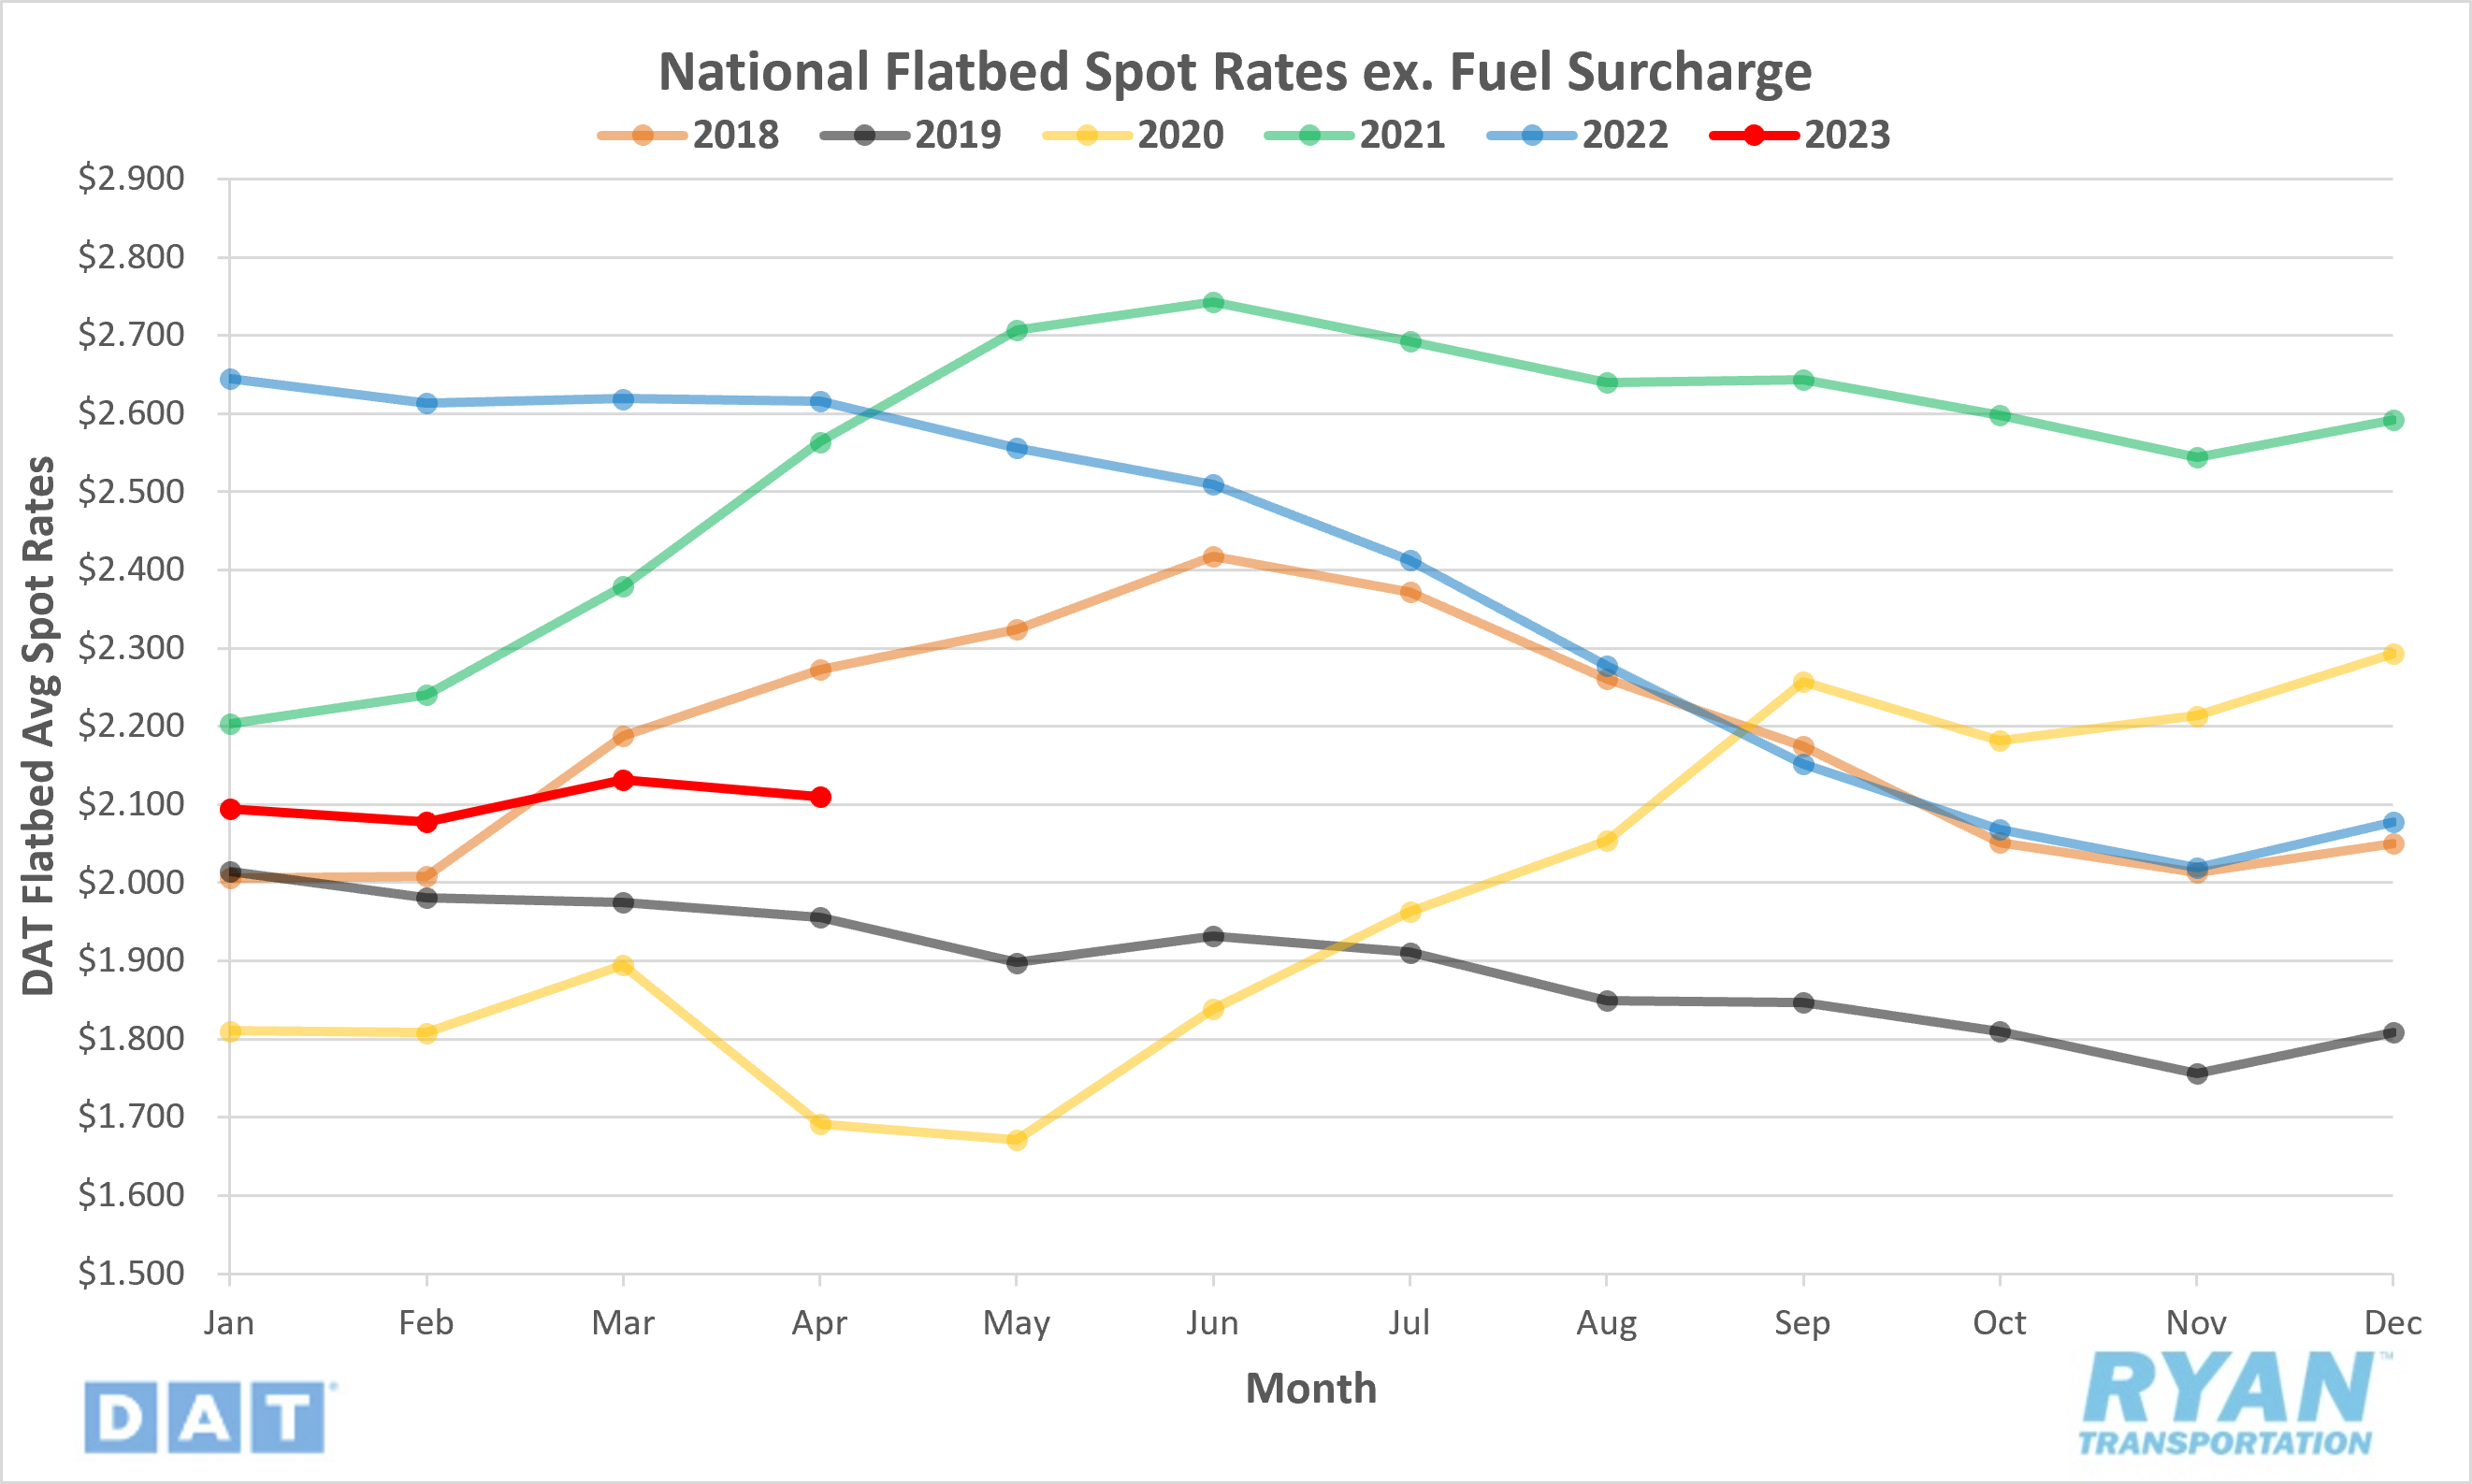
- After increasing MoM in March, the national average flatbed spot rate excl. fuel surcharge declined $0.022, or 1.0%, in April to $2.110.
- The national average flatbed contract rate excl. fuel technically increased for the second consecutive month but was realistically flat MoM in April, up $0.002 from March to $2.770.
- Flatbed linehaul spot rates in April were down 19.3% YoY, sitting just under 4.0% below the 5-year average.
Load-to-Truck Ratio
Key Points
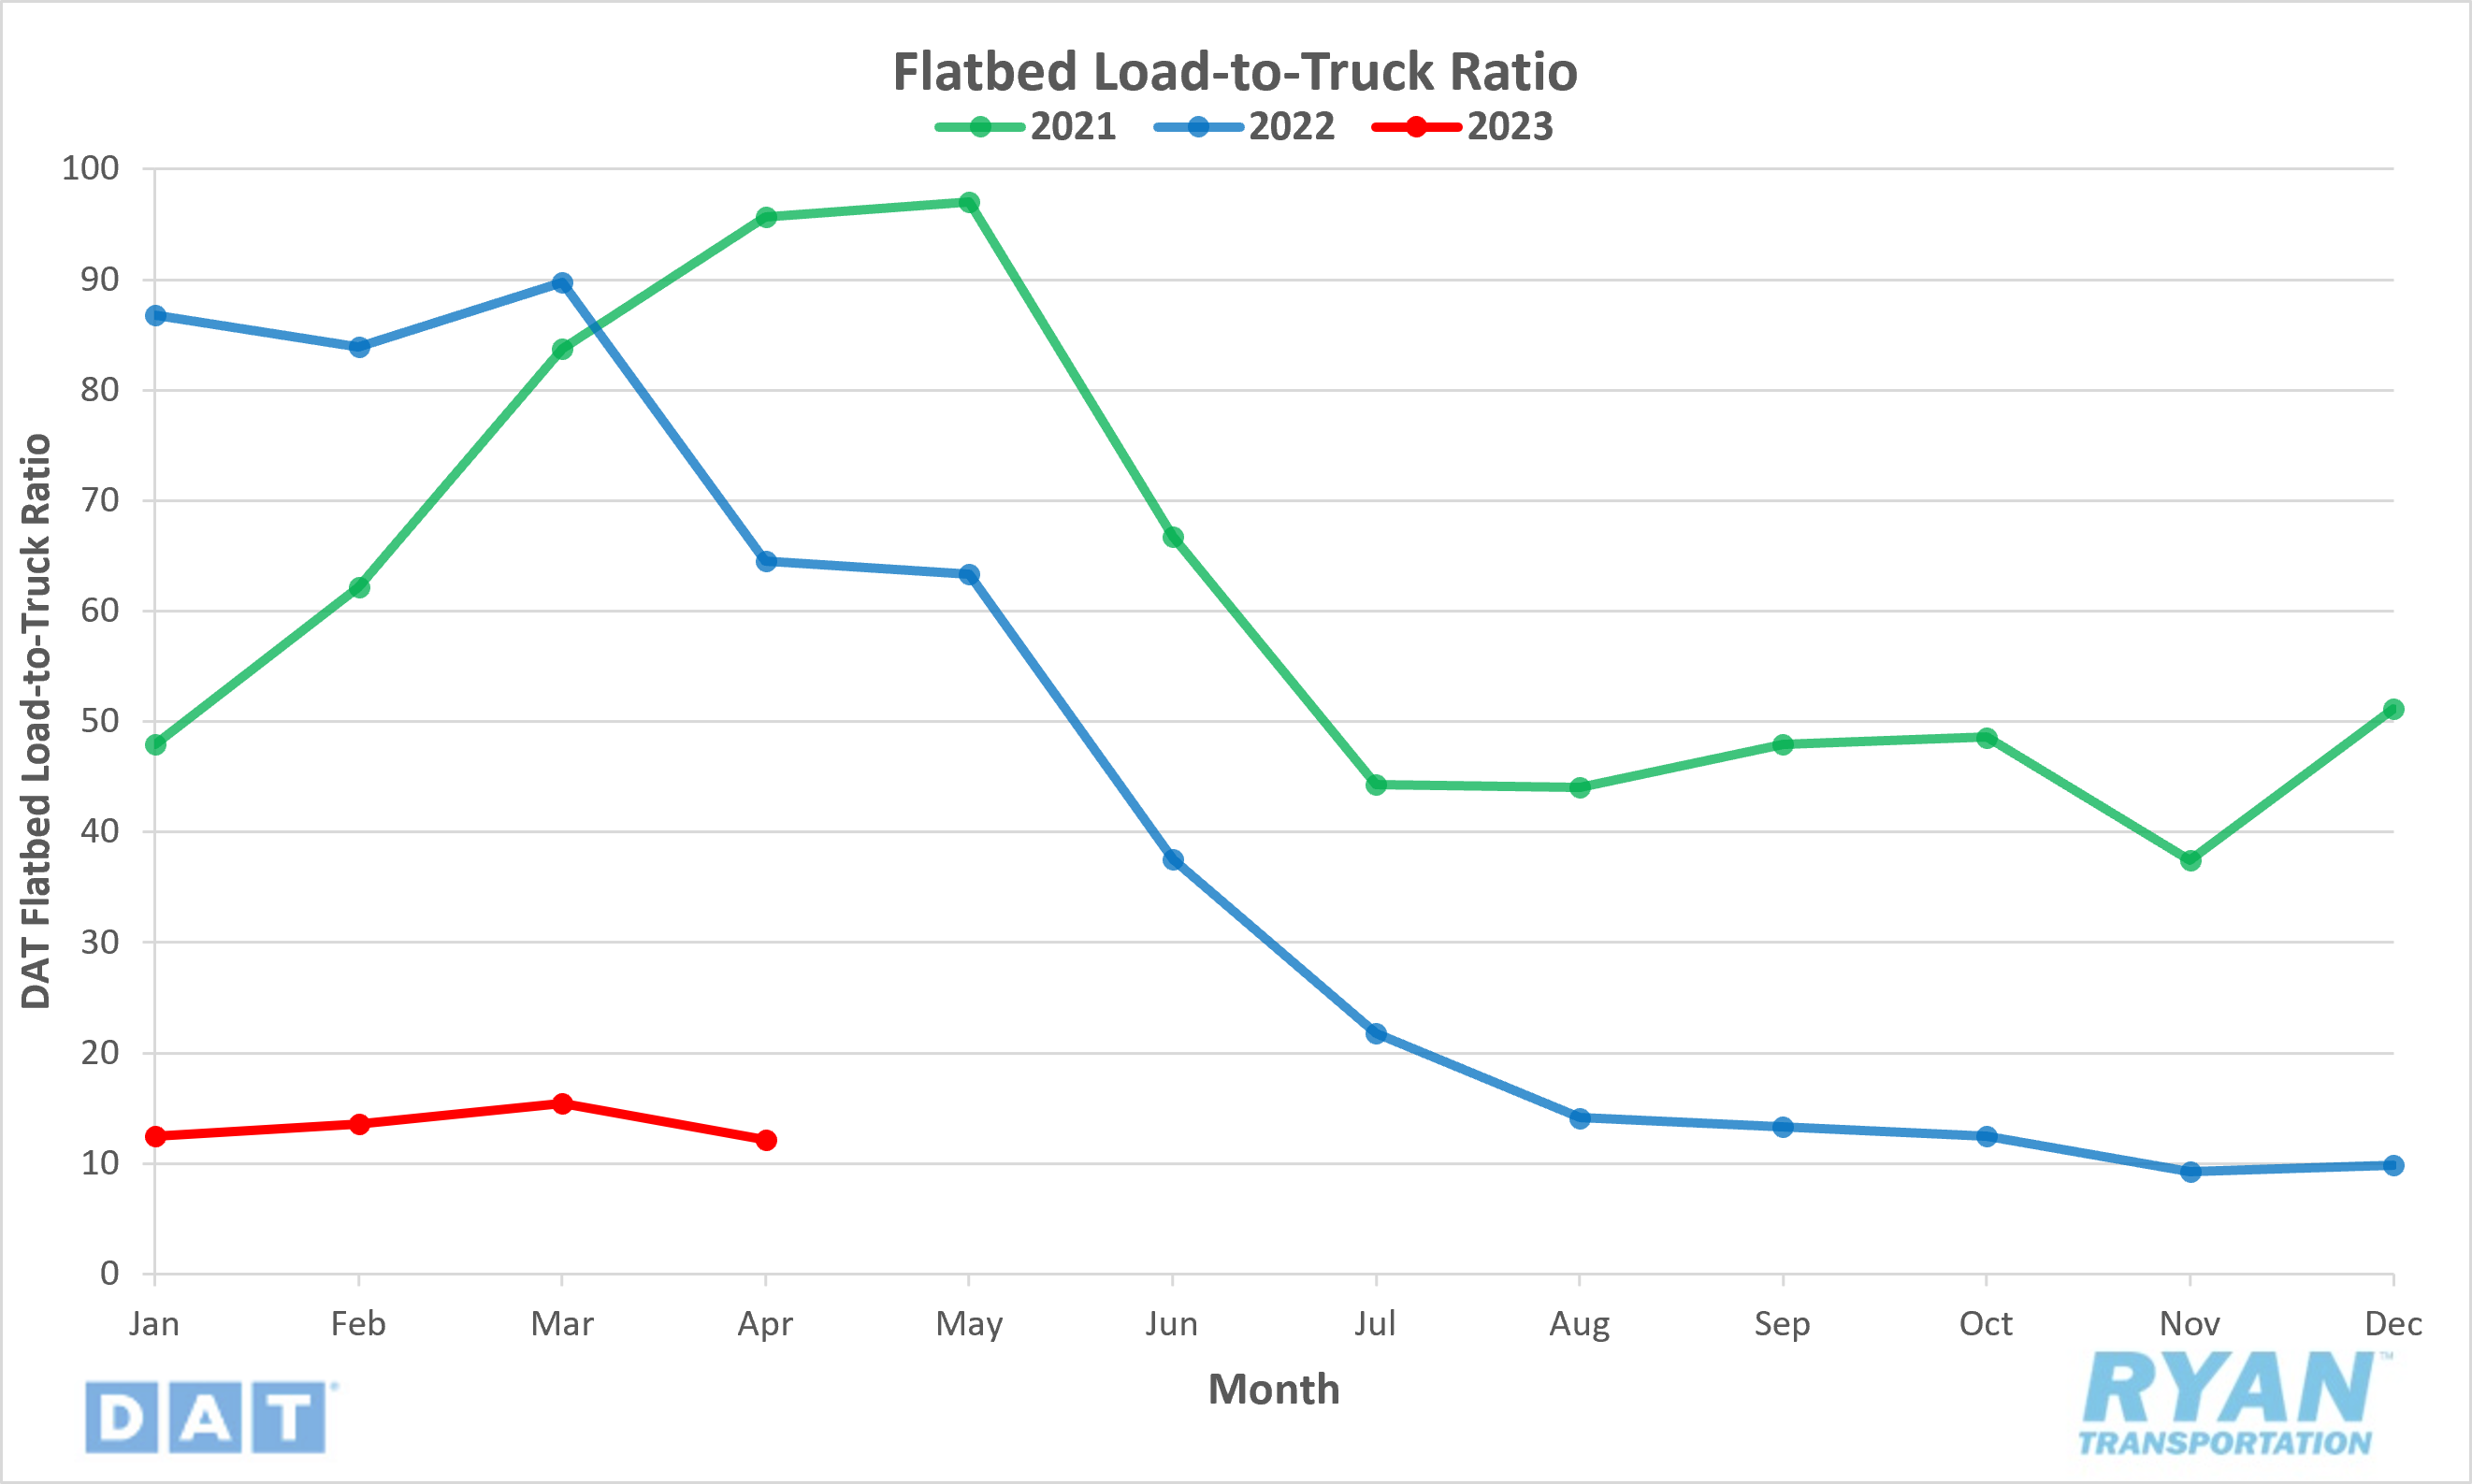
- The flatbed load-to-truck ratio declined 81.2% YoY in April and registered 21.6% below March levels after seeing a slight increase last month.
Market Conditions
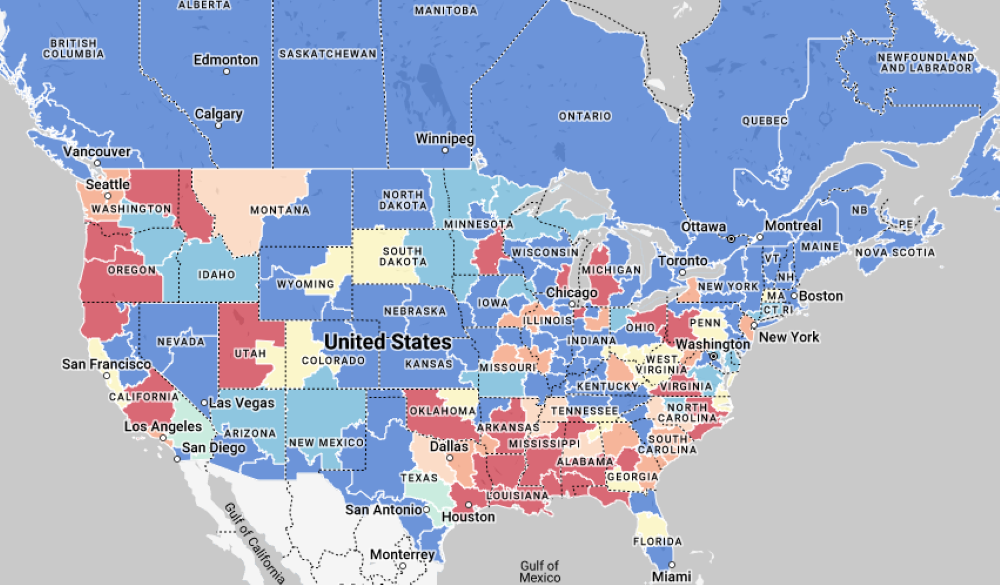
Flatbed Summary
Following an uptick in activity in March for both linehaul rates and volumes, the flatbed market unseasonably cooled off in April as construction-related freight should be getting underway. Flatbed spot rates peaked in the last week of March to end the month up 2.3%, or $0.05, from where they started. Since that point, flatbed spot rates saw a $0.03 decline in the first week of April and remained relatively flat on a weekly basis through the rest of the month. The minor increase seen for contract rates in April was to be expected following the almost 14% increase in volumes in March. Since contract rates are more stable, they are less reactionary to shifts in the market and fluctuations are delayed in comparison to spot rates. Similar to the scenario last fall, the flatbed market continues to outperform the other two modes, with rates moving within 5% of the 5-year average and dropping within 20% of YoY levels, despite seeing 80% less volume as the same time last year. New residential housing starts and building permits both fell in March, with both coming in under the consensus. April's data is set to be released on May 17, with current consensus projecting numbers to be flat from March with the industry still struggling with building material issues.
Intermodal
Spot Rates
Key Points
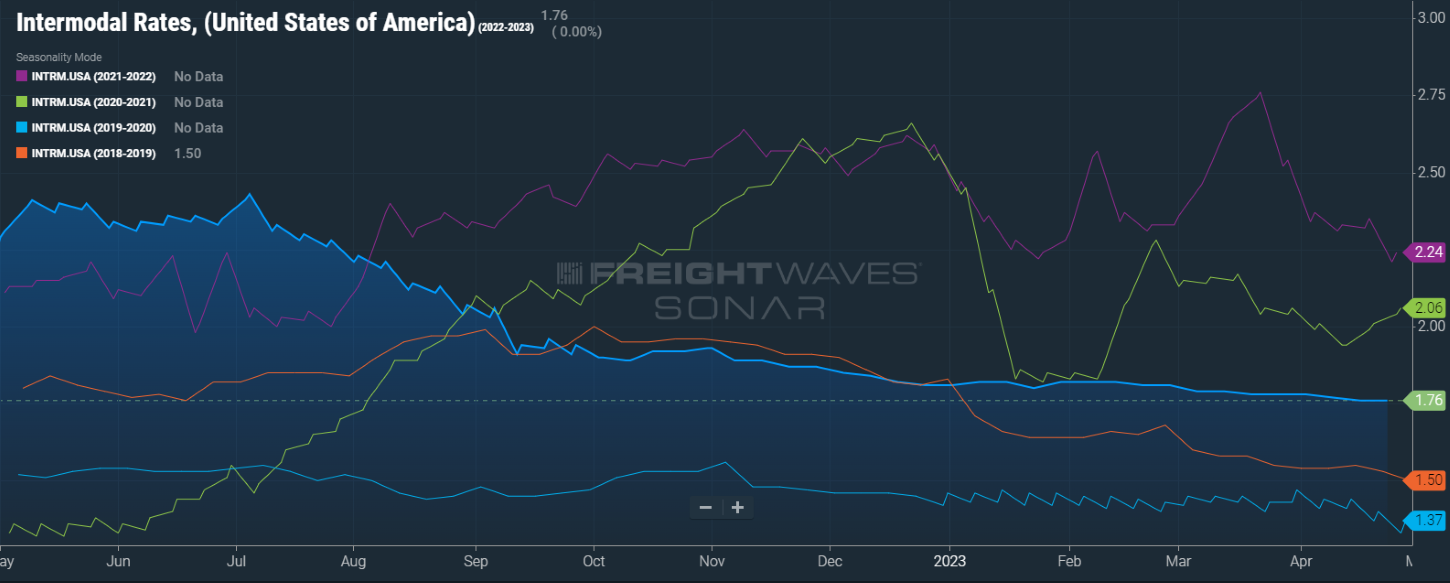
- FreightWaves SONAR Intermodal Rates Index (INTRM.USA), which measures the average weekly all-in door-to-door intermodal spot rate for 53’ dry vans across a majority of origin-destination pairings, ended the month of April down $0.02 from where it started and sits 27.3%, or $0.48, below the same time in 2022.
- Compared to the 5-year average, intermodal rates sit just 1.5%, or $0.02, below.
Volumes
Key Points
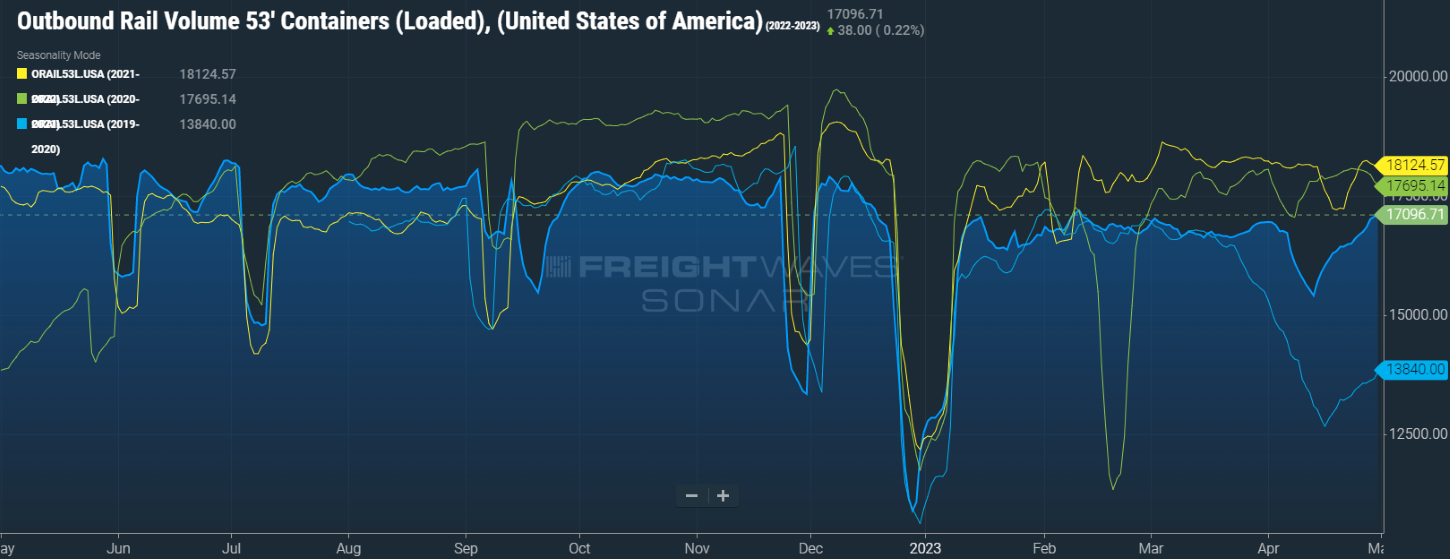
- Total loaded volumes for 53’ containers from all domestic markets, measured by FreightWaves SONAR Loaded Outbound Rail Volume Index (ORAIL53L.USA), shows volume levels fell by more than 5.7% in the front half of the month before rebounding 11% to end the month of April, up 4.7% from where it had started.
Intermodal Summary
Intermodal carriers saw some positive momentum in April but still have a long way to go to get near levels seen prior to the market decline. After a relatively flat March, North American carload volumes saw a sharp decline in the week leading up to Easter, which was primarily due to carriers in Mexico shutting down for the holiday. They were able to recover in the weeks following to close the month out ahead of where they started. The holiday shutdown in Mexico was not the only headwind the intermodal industry faced in April. The intermodal market share continued to face challenges from the declining truckload market as the spread between the two modes' contract rates remains in a downward trend, starting the month just over 9.8% and ending the month at 8.6%, a record low since FreightWaves SONAR started tracking the spread in 2017. Another factor adding negative pressure to intermodal volumes is the ongoing port negotiations along the West Coast, with the International Longshore and Warehouse Union (ILWU) withholding labor for two days between April 6 and 7 at the ports of Los Angeles and Long Beach. The contract between the ports and unions expired in July of last year and have yet to come to an agreement, making customers weary of sending product through those ports and opting for other locations that may be less intermodal-friendly. The port of Los Angeles is a major throughput for intermodal activity, so further delays in contract negotiations will continue to reduce opportunities to regain any considerable market share.
Further Reading
- FreightWaves: 2nd-half freight rebound increasingly unlikely
- Transport Topics: April Class 8 Sales Up 19.4% YoY
- FreightWaves: American Shipper: US imports up again in April as market mirrors pre-COVID ‘normal’
For more insights and to get help with your shipping needs, reach out to a Ryan Transportation representative today!