
Executive Summary
Uncertainty surrounding the health of the economy continues to be a major topic, despite indicators either improving or holding steady since April. Concerns have eased a bit following the avoidance of a default by raising the debt limit, but lingering recession conversations continue to make headlines. Payroll employment remains strong while inflation eased in May as unemployment ticked up slightly, indicating the Federal Reserve is closer to navigating a smooth landing than most anticipated. The federal funds rate is likely to remain at the current 500-525 bps through 2023, pending any significant changes in economic data, until inflation nears the Fed target of 2%. Import volumes increased 3.8% from April but overall volumes continue to track closely with pre-pandemic levels, up just 0.5% from May 2019. Holiday and safety enforcement disruptions created positive momentum for the truckload market in May, but the imbalance of an abundant supply versus weak demand remains a major caveat for any substantial growth in the near-term outlook. The intermodal sector is proving to be resilient in Q2 as overall volumes reversed their negative trend from Q1 despite the ongoing headwinds facing the industry, including the West Coast labor disputes and competitive environment with over-the-road carriers.
Main Takeaways
- Activity in the manufacturing sector slowed in May, moving further into contraction territory, as weak demand keeps inventory levels slightly elevated and reduces new orders.
- National linehaul rates saw minor improvement within the spot market in May, while the contract side continued its negative trend, narrowing the contract-to-spot spread to $0.53.
- International Roadcheck Week, held by the Commercial Vehicle Safety Alliance (CVSA) in conjunction with the Federal Motor Carrier Safety Administration (FMCSA), took place between May 16 and May 18, causing capacity disruptions and rate spikes for the week ending May 20.
- Peak produce shipping season is fully underway, as the refrigerated load-to-truck ratio increased 34.1% MoM.
- The total trucking population contracted further in May with net authority revocations exceeding new entrants by 3,058 carriers.
- Fuel prices continue to decline, prompting major U.S. oil and gas companies to take drill rigs offline in May and drive down overall flatbed volumes.
Click the links below to jump to a specific section:
Economy | Spot Rates | Truckload Demand | Truckload Supply | Capacity Outlook | Fuel Prices | Dry Van Overview | Reefer Overview | Flatbed Overview | Intermodal Overview | Further Reading
Economy
United States ISM Manufacturing PMI
Key Points
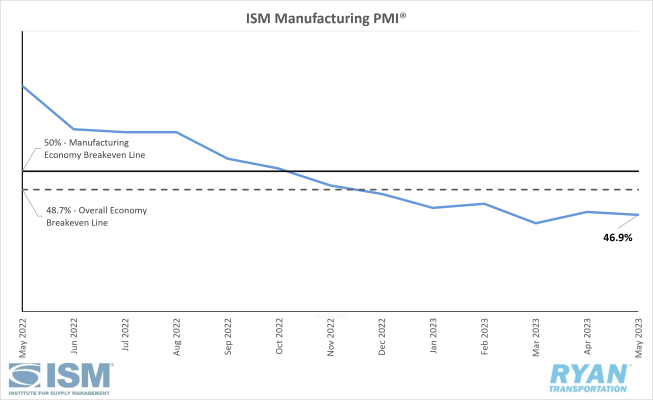
- The Institute for Supply Management (ISM) Manufacturing PMI® contracted for the seventh consecutive month in May, registering 46.9%, a 0.2% decline from April’s reading of 47.1%. This is the sixth consecutive month of contraction in regard to the overall economy, after a 30-month period of expansion.
- After five consecutive months in contraction, the Production Index moved into growth territory in May, registering 51.1%, up 2.2% from April's reading of 48.9%.
- The Employment Index remained in expansion territory in back-to-back months, increasing 1.2% from April’s 50.2% reading to 51.4% in May.
- The New Orders Index continued to contract after falling 3.1% between April and May to 42.6%. This marks the ninth consecutive month of contraction in new orders.
Summary
After a minor rebound in April, the ISM Manufacturing PMI® moved further into contraction territory in May. This comes as companies are continuing to slow outputs to better match first half demand, while bracing for what was once a positive outlook for the second half but has become increasingly uncertain. The Customers Inventories Index remains at the low end of ‘too high’ territory as the Backlog of Orders Index is approaching levels not seen since the Great Recession, according to the latest ISM Manufacturing report. This has created more negative pressure on the New Orders Index, causing it to contract at a faster rate in May and weakening the hope for positive growth in future production. The output and consumption factors of the Manufacturing PMI®, measured by production and employment, saw positive momentum as both indexes were in expansion in May. Employment levels in May indicated expanding and contracting head count activity near equal levels amid mixed sentiment of future growth potential, according to the ISM Manufacturing PMI® survey panelists. Another positive spotlight in May was the significant decrease in the Prices Index, dropping 9.0% from April’s reading of 53.2%, as customers and consumers are starting to push back as inflation eases and, hopefully, creating some upward momentum for new orders in the future.
Why it Matters: The continued contraction of new orders remains concerning for the return of growth in the manufacturing sector as the first half of the year closes out. Soft demand levels have extended the weak near-term outlook timeline that prevailed through the first two quarters into the early months of the second half of the year. The anticipation for an uptick in manufacturing activity in late summer/early fall remains up for debate, as panelists for the Manufacturing PMI® remain at a 1:1 ratio of optimism for future production growth and pessimism of continued demand decline in the near-term. The pushback from consumers and customers towards inflated pricing creates some upside for future new orders. However, customer inventories remain elevated as suppliers work through backlogs, which could have negative impacts on the continued growth of production and employment.
Macro Impacts
- Nonfarm payroll employment added 339,000 jobs in May according to the Bureau of Labor Statistics (BLS) most recent jobs report.
- The unemployment rate registered 3.7% in May, a 0.3% increase from April’s figure and the most significant increase since March 2020 at the start of the pandemic.
- Total transportation and warehousing jobs rose by 24,000 in May, primarily driven by transit and ground transportation, couriers and messengers and air transportation. Truck transportation saw no change from April while warehousing jobs fell by 1,900.
- At the time of this writing, the Federal Reserve is expected to halt the increases to the federal funds rate and remain at the current 5.00%-5.25% set at the last Fed meeting in early May.
- According to the CME FedWatch Tool, the consensus probability of the federal funds rate remaining the same sits at 77.1% versus a 22.9% consensus probability of yet another 25-basis-point rate hike.
- As mentioned in our previous update, the Federal Reserve reached its projected target during their meeting in May, leaving further rate hikes in the hands of overall economic activity expansion, the labor market and CPI Inflation.
- Headline Consumer Price Index (CPI) rose 4.0% in May on an annual basis with Core CPI rising 5.3% over the last 12 months, according to the recent BLS report.
- After increasing 0.4% in April, headline CPI rose 0.1% in May on a seasonally adjusted basis while core inflation rose 0.4%, similar to April and March.
- Shelter continues to be the largest contributor to the monthly increases in inflation for all items minus food and energy, rising 0.6% in May, followed by used cars and trucks and vehicle insurance.
- The 4.0% increase in core inflation in May was the smallest 12-month increase since March 2021.
- The energy index continued to decrease, falling 3.6% in May after rising 0.6% in April. Over the last 12 months, the energy index has fallen by 11.7%.
Industry Overview
May Key Figures (YoY)
| Truck Data Points | YoY Change (%) |
|---|---|
| DAT Spot Rates (incl. FSC) | -23.2 |
| Fuel Prices | -29.7 |
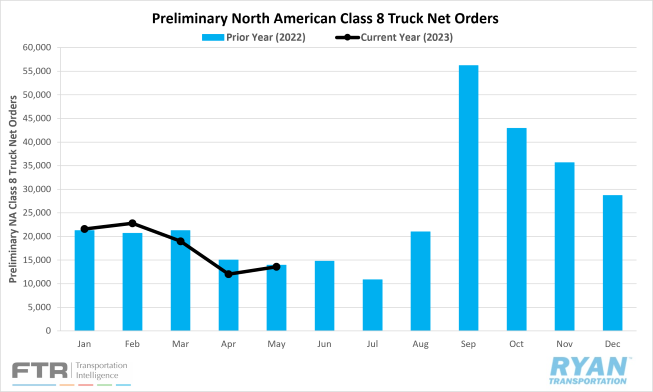
| ACT Class 8 Preliminary Orders | -2.0 |
| ATA NSA Truck Tonnage | -5.1 |
| Cass Freight Index | -15.3 |
| Cass Freight Expenditures | -15.7 |
| Cass Freight Shipments | -5.6 |
Rates
Spot Rates
Key Points
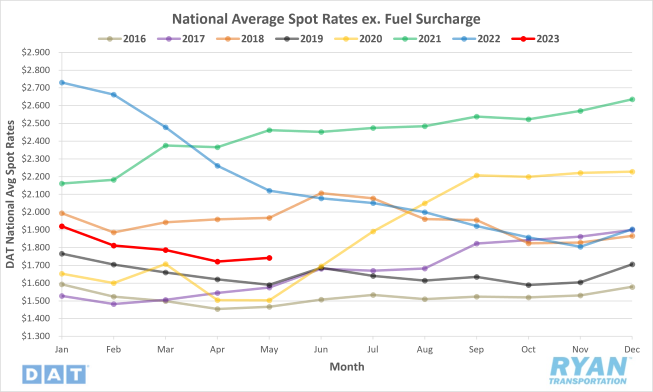
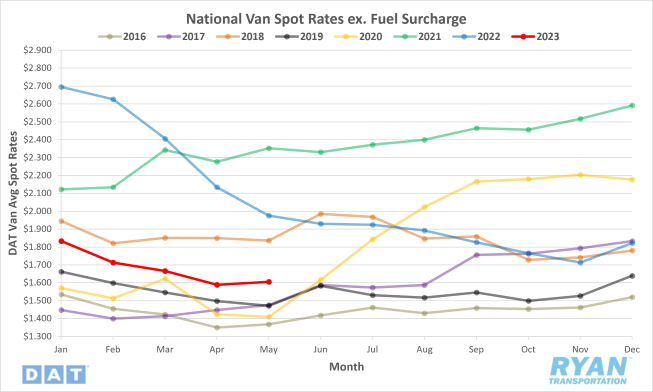
- After declining 10.7% MoM since January, national average spot rates excl. fuel increased 1.2% in May despite ending the month 17.9% below the same time last year.
- Average linehaul rates registered below the 5-year average for the eighth consecutive month with May’s reading of -8.2%.
Contract Rates

Key Points
- National average contract rates excl. fuel fell slightly from April, dropping 0.3% in May while sitting 13.1% below 2022 levels.
- The contract-to-spot rate spread in May decreased 2.0%, or roughly $0.07, from April’s reading, registering $0.53.
Summary
National spot rates excl. fuel continued to decline through the first two weeks of May, having fallen 17.6% or just over $0.37 from where they started the year and reaching their lowest level since June 2020. Following the nearly 3-year low, linehaul spot rates surged by 5.2% or over $0.09 during International Roadcheck Week, pushing the monthly average up over April’s average. Spot rates saw moderate change leading up to the holiday, but ultimately remained flat WoW before returning to their negative trend post Memorial Day. Linehaul contract rates continued their negative trend, although at a slower pace, in May, dropping just 0.3%, the lowest MoM decline since December of last year. The inverse trends of contract and spot linehaul rates narrowed their spread in May by $0.07 to $0.53, the second largest MoM decline since February 2022, with the largest coming in December when the spread declined by $0.11. Despite the significant decline, the contract-to-spot spread remains elevated against the pre-pandemic average range of $0.35-$0.45 when seasonally adjusted.
Why It Matters: While the overall MoM increase in national linehaul rates in May was in line with typical seasonality seen during the pre-pandemic era, the granular data does not indicate a significant rebound in the near- to mid-term outlook. Prior to the surge seen in the back half of the month, rates continued to trend negative through the first two weeks, which is not characteristic of the first full month of peak shipping for the southern half of the country. As is the case each year, the spike in spot rates seen in the third week of May was a direct result of International Roadcheck Week that occurred between May 16th and May 18th and was the strongest gain in rates since the last week of December. The 3-day inspection blitz that occurs every year in either May or June causes spot rates to jump 5-7% on average in a single week, as many carriers choose to opt out of hauling to avoid potential fines while those that do choose to work run the risk of being placed out of service. According to the Commercial Vehicle Safety Alliance, DOT officers inspect roughly 65,000-75,000 trucks during this time, resulting in about 15%-20% of trucks being placed out of service, with an additional 4%-5% of drivers being placed out of service and countless fines being issued.
Truckload Demand
Key Points
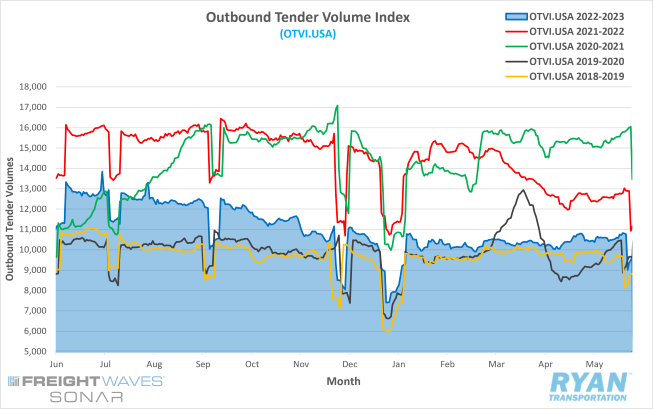
- Heading into the final full week of May, tender volumes across all modes, measured by FreightWaves SONAR Outbound Tender Volume Index (OTVI), sat roughly only 1.3% higher than they did in the previous month before increasing 2.8% by the Friday before Memorial Day. Post-holiday levels dropped by 12.3% to end the month, which is in line with typical seasonality.
- The monthly average of daily tender volumes recorded by the OTVI shows overall volumes saw slight improvement in May, rising 0.9% to 10,447.73 from April’s average of 10,350.56.
- On a YoY basis, the Outbound Tender Volume Index (OTVI) was down 15.4% during the pre-holiday-week surge and sits 10.3% below the 5-year average during the same time period. Similar to 2022, the week leading up to Memorial Day saw a 2.3% jump in volumes, however entering that week, volume levels were already 6.1% higher than the month before.
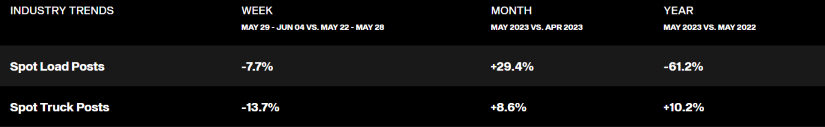
- Spot market volumes also saw significant MoM improvement in May according to DAT, registering 29.4% above April’s figures despite being down 61.2% on a YoY basis.
- The Cass Freight Index, which analyzes the number of freight shipments in North America and the total dollar value spent on freight shipments, recorded YoY decreases in May for both shipments and expenditures of 5.6% and 15.7% respectively.
Summary
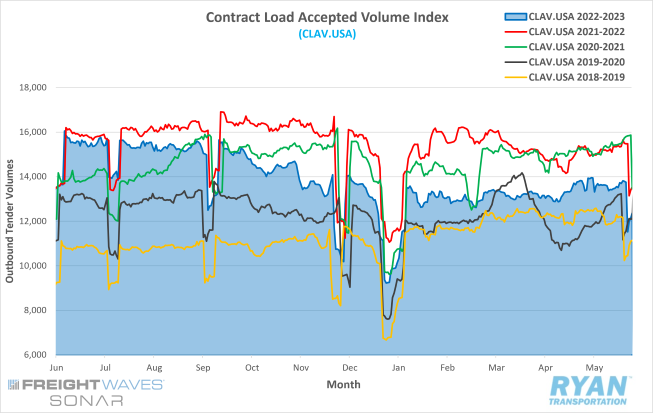
Overall, tender volumes in May saw moderate increases over April’s volume levels but were stable overall throughout most of the month. With Memorial Day marking the unofficial beginning of summer, the additional volume noted in the preceding week was the result of a final push from shippers and customers to get product out ahead of the long weekend and the end of the month. Freight volumes continued to favor the contract market in the front half of the month ahead of the week of CVSA Inspections. The FreightWaves SONAR Contract Load Accepted Volume Index (CLAV), shown below, which measures tender volumes accepted by carriers moving under contractual agreements, was up 3.6% from the previous month through the second week of May, before losing steam in the third week as carriers shifted capacity over the spot market. By Memorial Day, though, contract volumes had nearly returned to their pre-inspection blitz levels and were flat compared to the month before. The disruptions in the contract market from International Roadcheck Week allowed for spot market activity to flourish, however. According to DAT, spot market volumes surged nearly 41% across all modes during the third week of the month, putting it just 29% below 2022 levels. The substantial gains were short-lived, with spot volumes falling by 10.5% in the final full week of May, but they remained elevated, sitting 13.5% above the averages recorded during the same time in April.
Truckload Supply
Key Points
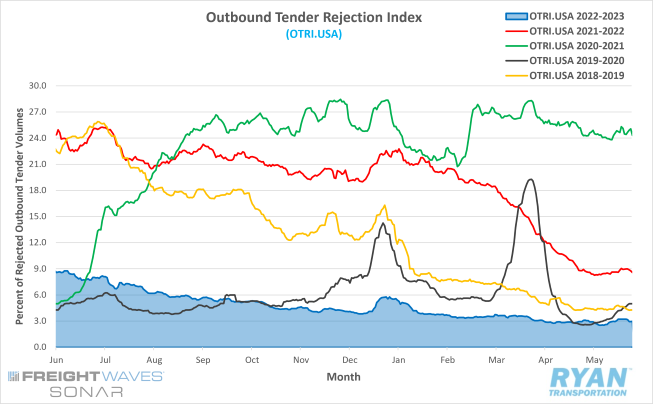
- After jumping to its highest level in over a month, 3.11% on the first day of May, the FreightWaves SONAR Outbound Tender Reject Index (OTRI), which measures the number of loads rejected by carriers hauling under contract as a percentage, declined sequentially through the first two weeks to the lowest point ever recorded on the index of 2.53%.
- Rejection rates rallied in the weeks leading up to the holiday, rising 0.7% to its May peak of 3.23% before cooling off post-holiday to end the month flat MoM.
- At its peak in May, the OTRI sat 5.71% below 2022 levels and 8.44% below the 5-year average.
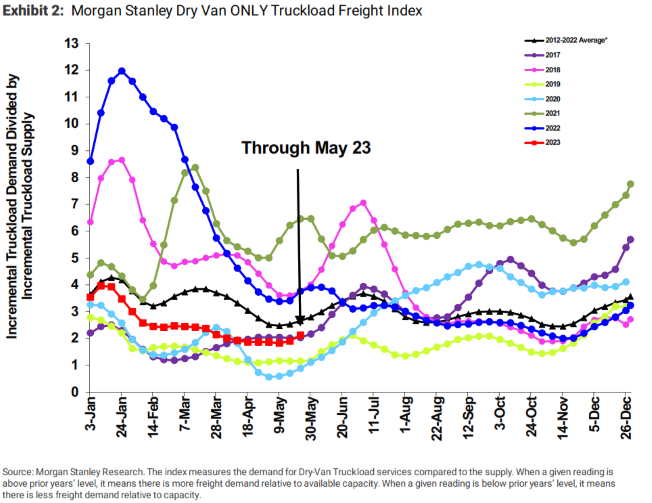
- The Morgan Stanley Truckload Freight Index (MSTLFI) increased in May and outperformed seasonality for the third consecutive reading after 16 weeks of underperformance. While the MSTLFI remains below the long-term average, it is continuing to trend closer to the long-term trends.
Summary
The market remained oversaturated with capacity in May as weak demand levels struggled to match excess truckload supply, despite disruptions caused by the CVSA inspections and Memorial Day. Tender rejection rates continued to trend negatively, as the declines experienced in the front half of the month outpaced the increases caused by the limited capacity in the back half. The impact on the available carrier pool from the CVSA/FMCSA inspections during the third week of May was relatively significant compared to the last 15 months, however. Since the CVSA is not likely to release their inspection results until later in the year, we can only speculate on how the number of out-of-service violations impacts landing near the averages of 20.5% for trucks and 4.9% for drivers over the last six years. While the majority of the violations that put drivers out-of-service fall under Hours of Service and are temporary, the delays from the driver going off-duty until their clock does a full reset can have a ripple effect for recovering loads that the driver might have been assigned on, adding to the capacity constraint. Equipment availability was already depleted coming into the week, as truck postings dropped just over 16% WoW as many carriers opted out of hauling at all, according to DAT. The additional negative pressure from trucks being put out of service pushed rejection rates up 0.42% WoW, making it the third most significant WoW jump since February 2022, with only the week ahead of Christmas and the week following the 4th of July registering higher.
Truckload Capacity Outlook
Key Points
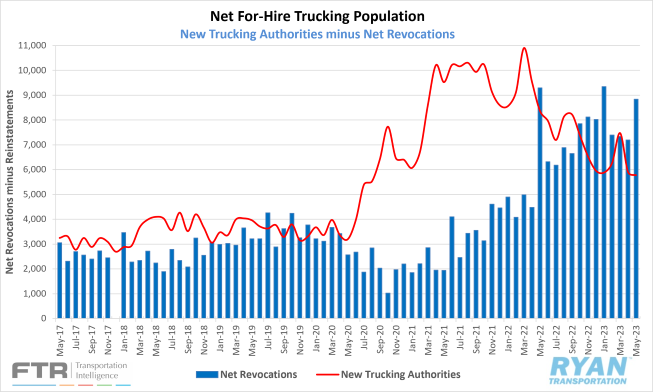
- Net revocations, the number of revocations of operating authority minus reinstatements, shot up by 23% in May from April, increasing by 1,640 carriers to 8,839, according to FTR’s preliminary analysis of the Federal Motor Carrier Safety Administration (FMCSA) data.
- The number of new authorities, which are newly authorized for-hire trucking companies, fell about 2% MoM in May, dropping down to 5,781 from the 5,905 figure recorded in April, according to FTR.
- Preliminary Class 8 orders reversed its negative trend in May and outperformed expectations, increasing 9% MoM to 13,600 units and sitting just 2% below YoY levels, per FTR’s report.
Summary
The net change in the for-hire carrier population, which is newly authorized carriers minus net revocations, declined by just under 25% or 3,058 in May, according to FTR. The change in the carrier population was the second largest on record, with the first coming in January of this year when the population declined by 3,464 carriers. Total revocations in May were at their highest since January’s total of 9,350 and the third most significant in history. According to FTR, the net revocations for both January and May appear to be outliers and somewhat misleading, as revocations during most months tend to occur across four or fewer days with 1,000 or more while those two months had five such days, including the first business day of the month in each case. While the additional factor is significant, the bottom-line points towards a declining carrier population but at a slower pace than the surges seen in 2020 and 2021. The inspection week in May provided a preview of the market’s response to a large-scale capacity retreat. The next test will come at the end of June ahead of the 4th of July holiday, when available capacity declines amid an increase of volumes before the books are closed for the end of the month and the end of the quarter.
Fuel Prices
Key Points
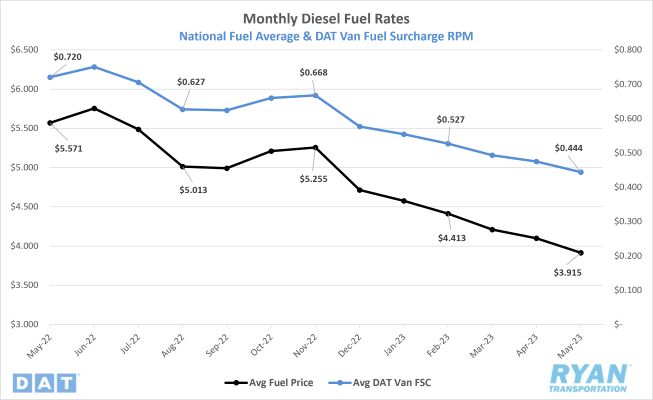
- National average fuel prices have now declined for seven consecutive months as the average price of diesel in May dropped 4.5% from April to $3.915.
- Fuel prices in May were 29.7% below 2022 levels when the monthly average was the second highest ever recorded.
- Crude inventories were essentially flat MoM, increasing by 24,000 barrels versus the -2.45M consensus between the weeks ending May 5 and May 26, according to the EIA.
Summary
Fuel prices have now sequentially declined over the last seven weeks, following 10 consecutive weeks of negative trends before a slight increase from Easter travel in April snapped the streak. By the start of the last week in May, the national average price of diesel had dropped 15.9%, or $0.728, from where they started the year and sits $1.684 below the same week last year. The U.S. stockpile of commercial crude products continued to build in May as the demand market remains weak. Draws on crude inventories underperformed analyst expectations for most of the month, with the exception coming in the week ending May 19 when the net change in crude stocks exceeded the consensus by -11.68M barrels. The continued decline in prices against rising interest rates, labor and material costs are starting to squeeze profit margins for major oil and gas companies and is likely to result in a reduction of drilling and production on the domestic side. On the global scale, the further production cuts announced in April by OPEC+ went into effect at the beginning of May but have not had the desired impact of driving the price per barrel back up. As a result, Prince Abdulaziz, the Energy Minister of Saudi Arabia, announced another reduction of supply by 1M bbl/day to begin in July, bringing total Saudi production to 9M bbl/day, the lowest output level since June 2021.
Why It Matters: The upside for fuel prices remains limited in the near-term, with economic uncertainty surrounding a looming recession plaguing the U.S. and China’s economy continuing to underperform expectations of a return to growth. Oil prices saw a slight increase following positive discussions regarding the debt-ceiling and the belief the U.S. would avoid a default, however the gains were short-lived as global supply remains elevated. Saudi Arabia’s decision to reduce overall output further in July was theirs alone as the other member countries in OPEC+, as well as Russia, are allowed to continue pumping freely. The move could come with steep costs and a loss of market share to the kingdom but is expected to keep the slide in prices from deepening, according to several energy analysts. The International Energy Agency had previously forecast a deficit of 1.9M bbl/day by Q3, but that is likely to be revised to closer to 3M bbl/day once the hit to production levels goes into effect. Oil futures hovered around $70/bbl through the month, but many Wall Street analysts believe the reduction of output will push prices back up to around $90/bbl by the end of the year.
Dry Van Overview
Spot Rates
Key Points
- The national average dry van spot rate excl. fuel surcharge slightly increased MoM in May, rising 1.0% or $0.016 from April’s average to $1.605, while the national dry van contract rate excl. fuel declined by almost the same amount to $2.171.
- Dry van linehaul spot rates in May were down 18.7% compared to 2022 levels and sit 9.6% below the 5-year average.
Load-to-Truck Ratio
Key Points
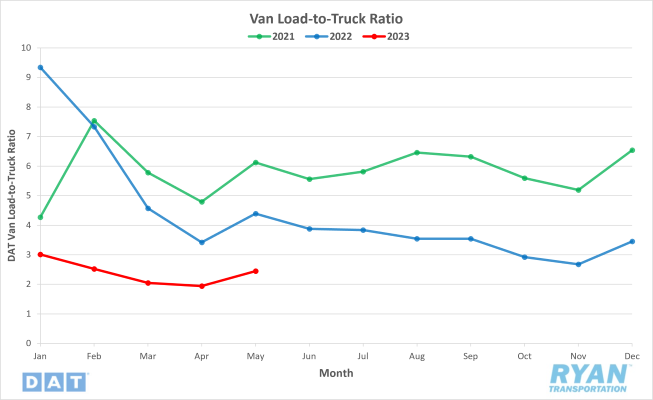
- The dry van load-to-truck (LTR) ratio increased 26.2% MoM in May but was down 44.2% compared to 2022.
Market Conditions
Dry Van Summary
The dry van spot rate excl. fuel fell to $1.60 in the second week of May, the lowest level seen in nearly three years since the pandemic, and 20.8% or $0.42 below where rates had started the year. Rates spiked $0.09 in the week following as a result of reduced capacity, before increasing an additional $0.02 ahead of the Memorial Day holiday to end the month above where it started. Prior to an increase in the third week of May, dry van linehaul rates had declined for 11 straight weeks with the last upward adjustment coming at the end of February, when rates rose by just under $0.01. While volumes remain relatively flat across the dry van sector, capacity has started to show signs of tightening as produce freight pulls refrigerated carriers away from non-perishable goods transport in the southern half of the country. This moderate tightening is likely to be felt through the rest of Q2 and into Q3 as produce transport demand shifts further north.
Reefer Overview
Spot Rates
Key Points
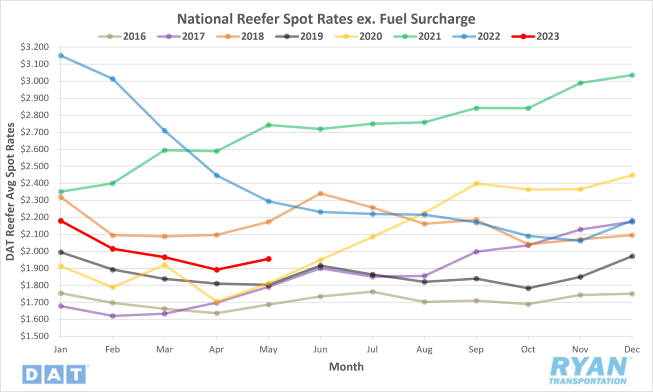
- The national average reefer spot rate excl. fuel surcharge increased in May by 3.4% or $0.06 MoM to $1.955, while the average contract rate excl. fuel declined by 2.1% or $0.05.
- Linehaul spot rates in the reefer sector ended May 14.8% below 2022 levels and sits 8.2% below the 5-year average.
Load-to-Truck Ratio
Key Points
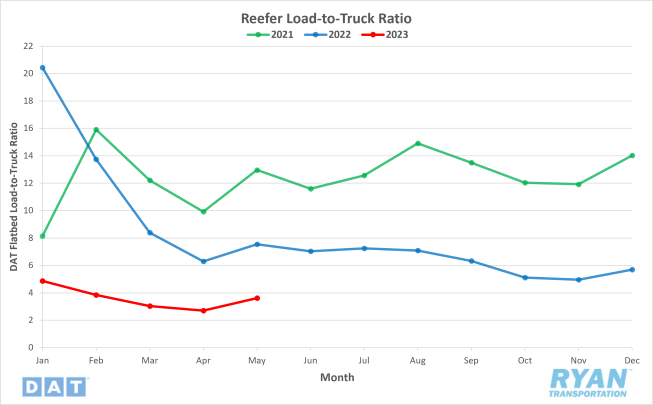
- The reefer load-to-truck (LTR) ratio increased 34.1% MoM in May and sits 52.0% below the same time last year.
Market Conditions
Reefer Summary
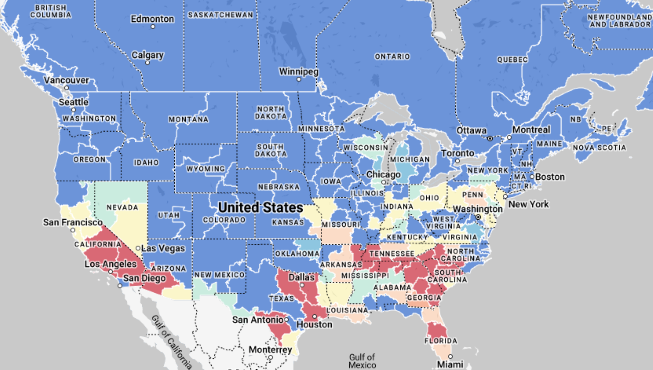
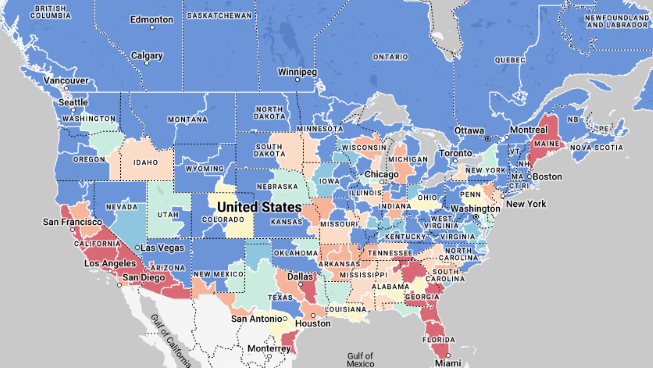
Refrigerated carriers saw positive momentum in May as produce season is now fully underway. Reefer linehaul spot rates started the month around $1.90, a penny higher from where they finished April, and remained flat through the first two weeks before jumping $0.14 to $2.05 during the week of CVSA inspections. Prior to the spike, reefer spot rates excl. fuel sat 23.9% or $0.60 below where they started the year and had spent seven consecutive weeks below $2.00 since dropping below in the third week of March. Produce volumes originating in Southern Florida typically peak ahead of Mother’s Day with the influx of flower imports into the Miami port, before shifting North into Georgia through May and into June. While produce season initially starts in the Southeast, much of it is driven by produce originating from California. Overall produce volumes originating from the Golden State have been relatively muted for the past few years, as a multi-year drought suppressed growth for much of last year and damaging floods in early spring of this year delayed planting and harvesting season. Currently, produce volumes remain 20% lower than last year, but there are signs that growers are starting to increase shipping volumes with expectations to match last year’s output by Independence Day.
Flatbed Overview
Spot Rates
Key Points
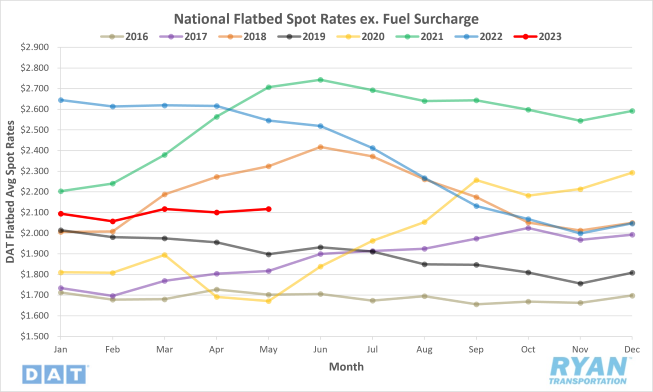
- The national average flatbed spot rate excl. fuel saw a slight increase in May, up 0.8% or $0.01 MoM to $2.117, while flatbed contract rates excl. fuel jumped 2.1% or $0.06 to $2.772.
- Flatbed linehaul spot rates were down 16.8% YoY and sit 4.23% below the 5-year average.
Load-to-Truck Ratio
Key Points
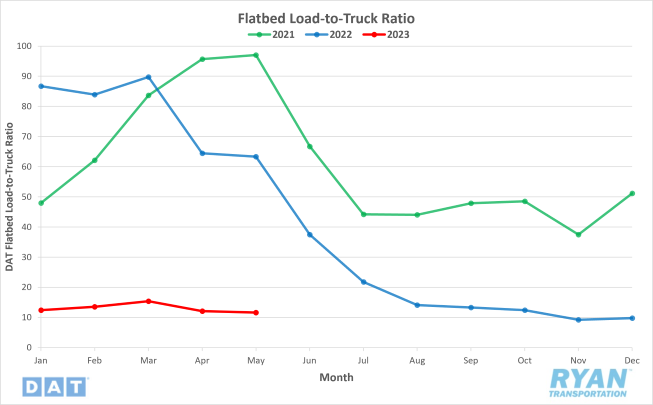
- The flatbed load-to-truck (LTR) ratio was down 81.5% compared to 2022 and declined 3.6% from April’s levels.
Market Conditions
Flatbed Summary
The flatbed sector performed the worst of the three major modes in May as construction and oil-related volumes remained well below normal averages for this time of year. Flatbed linehaul spot rates dropped $0.03 through the first two weeks, putting them 4.2% or $0.09 below where they started the year, before surging $0.07 in the third week with the help of International Roadcheck Week. Rates remain within 5% of the 5-year average and within 20% of the previous year’s levels, but flatbed activity as a whole has underperformed typical seasonality so far in 2023. Residential construction has suffered so far in 2023 with spending down 12% in April from its March 2022 peak. However, non-residential construction hit record highs as the infrastructure bill, passed earlier in the year by the administration, put an emphasis on commercial projects. Residential construction tends to favor general flatbed activity while commercial construction incorporates more specialized carriers. The other major factor contributing to the decline in flatbed volumes is the reduction of oil and gas drilling by exploration and production companies. Due to declining fuel prices, many of the major companies are taking drill rigs offline as the cost to maintain and operate remains elevated and are bleeding into profit margins. According to Baker Hughes, the U.S. oil and gas rig count dropped by 44 rigs in May and marked the largest drop in the last three years. As prices continue to decline, producers are likely to continue dropping their rig counts until there’s a shift in oil prices.
Intermodal
Spot Rates
Key Points
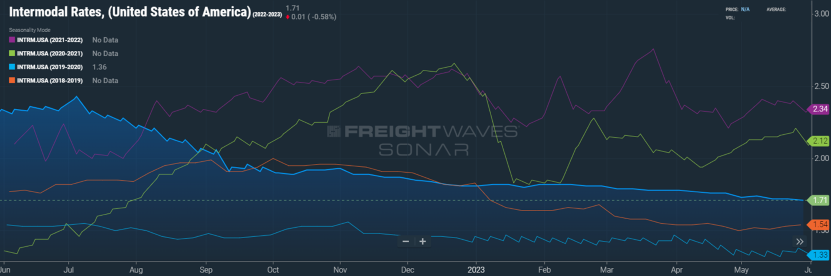
- FreightWaves SONAR Intermodal Rates Index (INTRM.USA), which measures the average weekly all-in door-to-door intermodal spot rate for 53’ dry vans across a majority of origin-destination pairings, fell in May, dropping $0.02 from $1.73 to $1.71 and sits 26.9% or $0.63 below the same time in 2022.
- Compared to the 5-year average, the INTRM.USA sits 5.4% or just under $0.10 below.
Volumes
Key Points
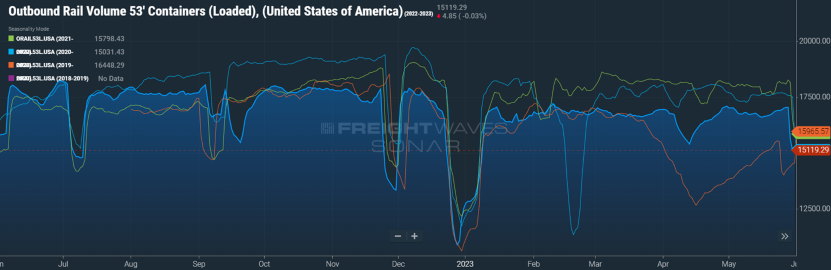
- Total loaded volumes for 53’ containers from all domestic markets measured by FreightWaves SONAR Loaded Outbound Rail Volume Index (ORAIL53L.USA) remained relatively flat through most of May, increasing just over 1.0% in the week leading up to Memorial Day before dropping 11.3% after the holiday, and in line with seasonal expectations.
Summary
After a weak first quarter this year, intermodal volumes have trended upward through the second quarter. Volumes still remain well below 2022 levels and the 5-year averages, but the continued incremental gains, despite the many headwinds rail carriers have faced, is a positive sign for the future outlook of the industry. Of the major headwinds facing the intermodal industry, competition for market share against truckload carriers continues to be the primary impediment for significant growth in rates and volumes. After declining steadily in the first part of May, the FreightWaves SONAR Intermodal Contract Savings Index, which measures the average percent difference between all-in intermodal contract rates and all-in truckload rates in the same lane, registered its lowest ever reading in the index’s history of 7.75% on May 20. Following the low point, the index rebounded to end the month just over 8.12%. Another major inhibitor to overall intermodal activity is the ongoing labor dispute between the International Longshore and Warehouse Union and Pacific Maritime Association that is negotiating on behalf of the ports. Contract negotiations began over a year ago and have made little progress, forcing many producers and shippers to redirect vessels to other ports that are not as intermodal friendly. Many rail carriers have had to suspend service to the Ports of Los Angeles and Long Beach due to delays and disruptions caused by the union, thus limiting volumes from two major throughputs for the intermodal industry.
Further Reading
- West Coast container ports hit as labor talks take ominous turn – FreightWaves: American Shipper
- Tonnage in April Drops 3.4% Year-Over-Year – Transport Topics
- Preliminary Class 8 truck orders see May gains – Logistics Management