
Executive Summary
Despite ongoing headlines forecasting a potential recession, key economic indicators continue to signal a resilient economy. Notably, initial estimates for Q3 GDP growth were revised upwards from 4.9% to 5.2% annualized, largely driven by robust consumer spending. The labor market also exceeded expectations, with payroll employment rising and the unemployment rate declining slightly. Moreover, recent Personal Consumption Expenditures data indicates that YoY inflation levels softened in October due to declining energy prices, bringing the Federal Reserve's "soft landing" scenario back into focus.
However, the truckload market remains in the late stages of its cyclical downturn, with excess capacity persisting as a key obstacle to growth. Although pre-holiday demand in November aligned with typical peak season activity, it was ultimately muted. Spot rates continue to come at a significant discount to contract rates, with the spread remaining well above historical averages. With supply levels exceeding demand, the prospects for a return to equilibrium in 2024 have become increasingly uncertain. Many now speculate that a full recovery may not materialize until late in the year, highlighting the long road ahead.
In contrast, the intermodal sector continues to demonstrate relative resilience. Despite a subdued peak season in October, Q4 is projected to be the most robust quarter from a volume perspective so far this year. While this positive inflection in loaded activity is encouraging, the outlook remains guarded as the sector faces headwinds from the declining truckload market conditions. November import volumes witnessed a 9% MoM decline from October, reaching just under 2.1 million TEUs, in line with the typical end-of-year seasonality. This further challenged industry growth, prompting carriers to consider potential headcount adjustments in the new year.
Main Takeaways
- U.S. Manufacturing activity went unchanged in November from October and remains in contraction.
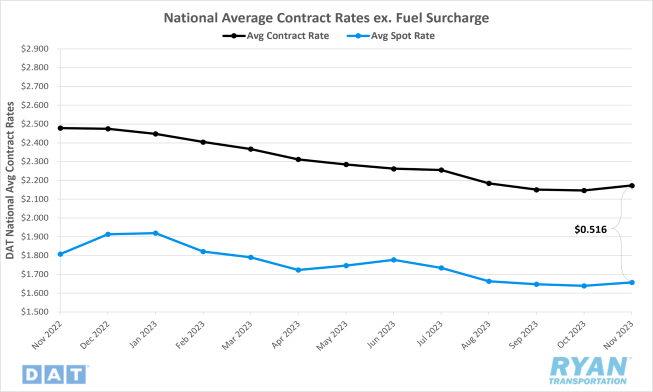
- The contract-to-spot spread edged higher in November as initially reported contract rate gains outpaced spot rate increases.
- Volume levels rallied at the start of the month, ahead of peak truckload shipping season, before tailing off in the back half of November.
- Excess capacity continues to work towards correction as net revocations exceeded new entrants for the 8th consecutive month.
- Crude inventories increased in November as fuel prices declined for the 2nd consecutive month.
Economy | Spot Rates | Truckload Demand | Truckload Supply | Fuel Prices | Dry Van Overview | Reefer Overview | Flatbed Overview | Intermodal
Economy
United States ISM Manufacturing PMI
Key Points
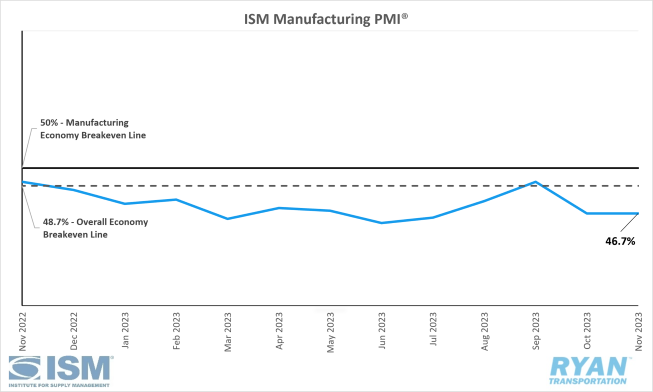
- The ISM Manufacturing PMI® remained in contraction territory at 46.7% in November and was unchanged from October’s reading.
- The New Orders Index contracted in November but at a slower rate than October, registering 2.8% higher to 48.3% from 45.5%.
- The Production Index registered 48.5% in November, a 1.9% drop from October’s reading of 50.4%, moving the index from expansion to contraction territory.
- The Employment Index indicated faster contraction at 45.8% in November, 1.0% lower than October’s figure of 46.8%.
- The Customers’ Inventories Index moved from “too low” territory to “too high” territory in November, after the index registered 2.2% higher than October’s reading of 48.6% to 50.8%.
- The Backlog of Orders moved deeper into contraction territory in November, registering 39.3% and 2.9% lower than October’s reading of 42.2%.
Summary
The Institute for Supply Management (ISM) Manufacturing PMI® report for November 2023 indicates that U.S. manufacturing activity continues to contract, albeit at the same rate as October. This marks the 13th consecutive month of contraction, with the PMI® index remaining below the 50% breakeven line. Moreover, November represents the second consecutive month of contraction for the overall economy, as a Manufacturing PMI® reading above 48.7% generally signifies expansion.
Demand-related factors included in the PMI® calculation continue to reflect industrywide softening. While the rate of contraction in new orders slowed down compared to October, the index remains in contraction territory for the 15th straight month. This moderate improvement was insufficient to offset further declines in the backlog of orders. Additionally, customer inventories shifted from the low end to the high end of "about right" territory, exerting negative pressure on the future demand outlook.
The output and consumption components, measured by the Production and Employment indices, combined for a 2.9% negative impact on the Manufacturing PMI® calculation. Companies continue to reduce MoM output to align with the subdued demand environment, as evidenced by the November Production Index reading indicating contraction. After a two-month expansion followed by one month at the breakeven line, the Production Index returned to contraction territory in November. In terms of employment, survey respondents reported a slowdown in hiring and an increase in headcount reduction activities, primarily through layoffs and attrition.
Meanwhile, the indices used to measure the input components of the diffusion index signal continued adaptability to accommodate future demand growth. The Supplier Deliveries Index indicated faster deliveries for the 14th straight month, and at a faster rate than in October. While remaining in "decreasing" territory, the Prices Index showed signs of stabilization with its November reading of 49.9%, representing a 4.8% increase from October's figure of 45.1%. The PMI® report attributes this slight rise to easing energy markets being offset by increasing commodity prices, particularly in steel markets.
Why It Matters:
The slowing pace of both the manufacturing sector and the broader economy as 2023 draws to a close has significantly heightened the difficulty of forecasting for 2024. Companies are prioritizing production adjustments to match persistently weak demand while placing increased focus on managing material inputs and, even more aggressively, labor costs. November's ISM Manufacturing PMI® figure of 46.7% fell short of analysts' expectations of 47.6%, suggesting a loss of economic momentum despite the robust growth witnessed last quarter.
Leading indicators crucial to future growth, such as new orders and customer inventories, offer no immediate signs of an imminent uptick in activity. While November's New Orders Index registered its second-highest reading since August 2022, sluggish orders in two capital-intensive industries, Computer & Electronic Parts and Machinery, which are both among the top six by share of manufacturing GDP, continue to drag down the subindex.
Comments from survey respondents included in the ISM report reveal a recurring theme of inflated inventory levels and customers postponing orders until 2024. Uncertainty surrounding the future economic outlook and elevated financing costs have further dampened demand levels, exerting significant negative pressure across the manufacturing sector. Notably, only two of the six largest manufacturing industries, Food, Beverage & Tobacco Products and Transportation Equipment, registered growth in November.
These insights paint a picture of a cautious manufacturing sector grappling with both ongoing challenges and a highly uncertain future. The need to manage costs while navigating a sluggish demand environment will remain paramount for companies in 2024. While there are glimmers of hope in specific industries, a broader economic recovery seems unlikely in the immediate future.
Macro Impacts
- Total nonfarm payroll rose by 199,000 in November, topping the 150,000 consensus and increasing from 150,000 in October that was unrevised from its initial release, according to the most recent jobs report released by the Bureau of Labor Statistics (BLS).
- The unemployment rate dropped 0.2% from 3.9% in October to 3.7% in November.
- Total Transportation and Warehousing employment declined slightly by 5,000 jobs, driven by a decrease of8,100 jobs in warehousing and storage.
- The Personal Consumption Expenditures (PCE) Price Index, the Fed’s preferred gauge for measuring inflation, was flat MoM from September to October while core PCE, which excludes fuel and energy, rose by a seasonally adjusted rate of 0.2%.
- On an annual basis, headline PCE was up 3% while core PCE was up 3.5%, seasonally adjusted.
- According to the most recent Consumer Price Index report released by the Bureau of Labor Statistics, headline CPI increased 0.1% MoM in November after being unchanged in October while core CPI rose 0.3% MoM, both seasonally adjusted.
- Headline CPI rose 3.1% on an annual basis, down slightly from the 3.2% rise recorded in October.
- Core CPI is up 4.0% YoY in November, similar to the October reading.
- The index for shelter continued driving the increases listed above in November and offset the decline in the gasoline index.
Industry Overview
November Key Figures (YoY)
| Truck Data Points | YoY Percentage (%) Change |
|---|---|
| DAT Spot Rates (incl. FSC) | -13.0% q |
| Fuel Prices | -19.1% q |
| ACT Class 8 Preliminary Orders | 26.4% p |
| ATA NSA Truck Tonnage* | -0.4% q |
| Cass Freight Index** | -7.5% q |
| Cass Freight Expenditures | -25.6% q |
| Cass Freight Shipments | -8.9% q |
*Report released 11/21/2023
**Report released 11/14/2023
Spot Rates
Key Points
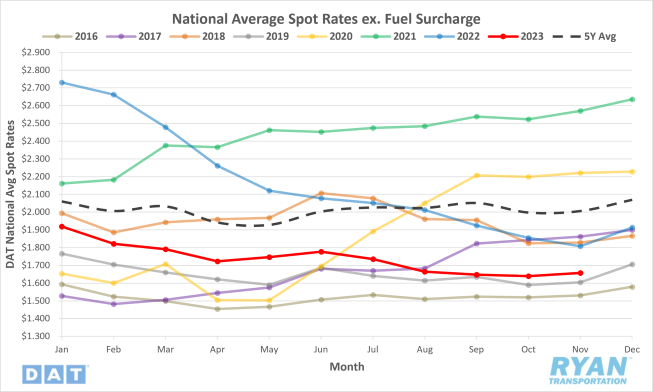
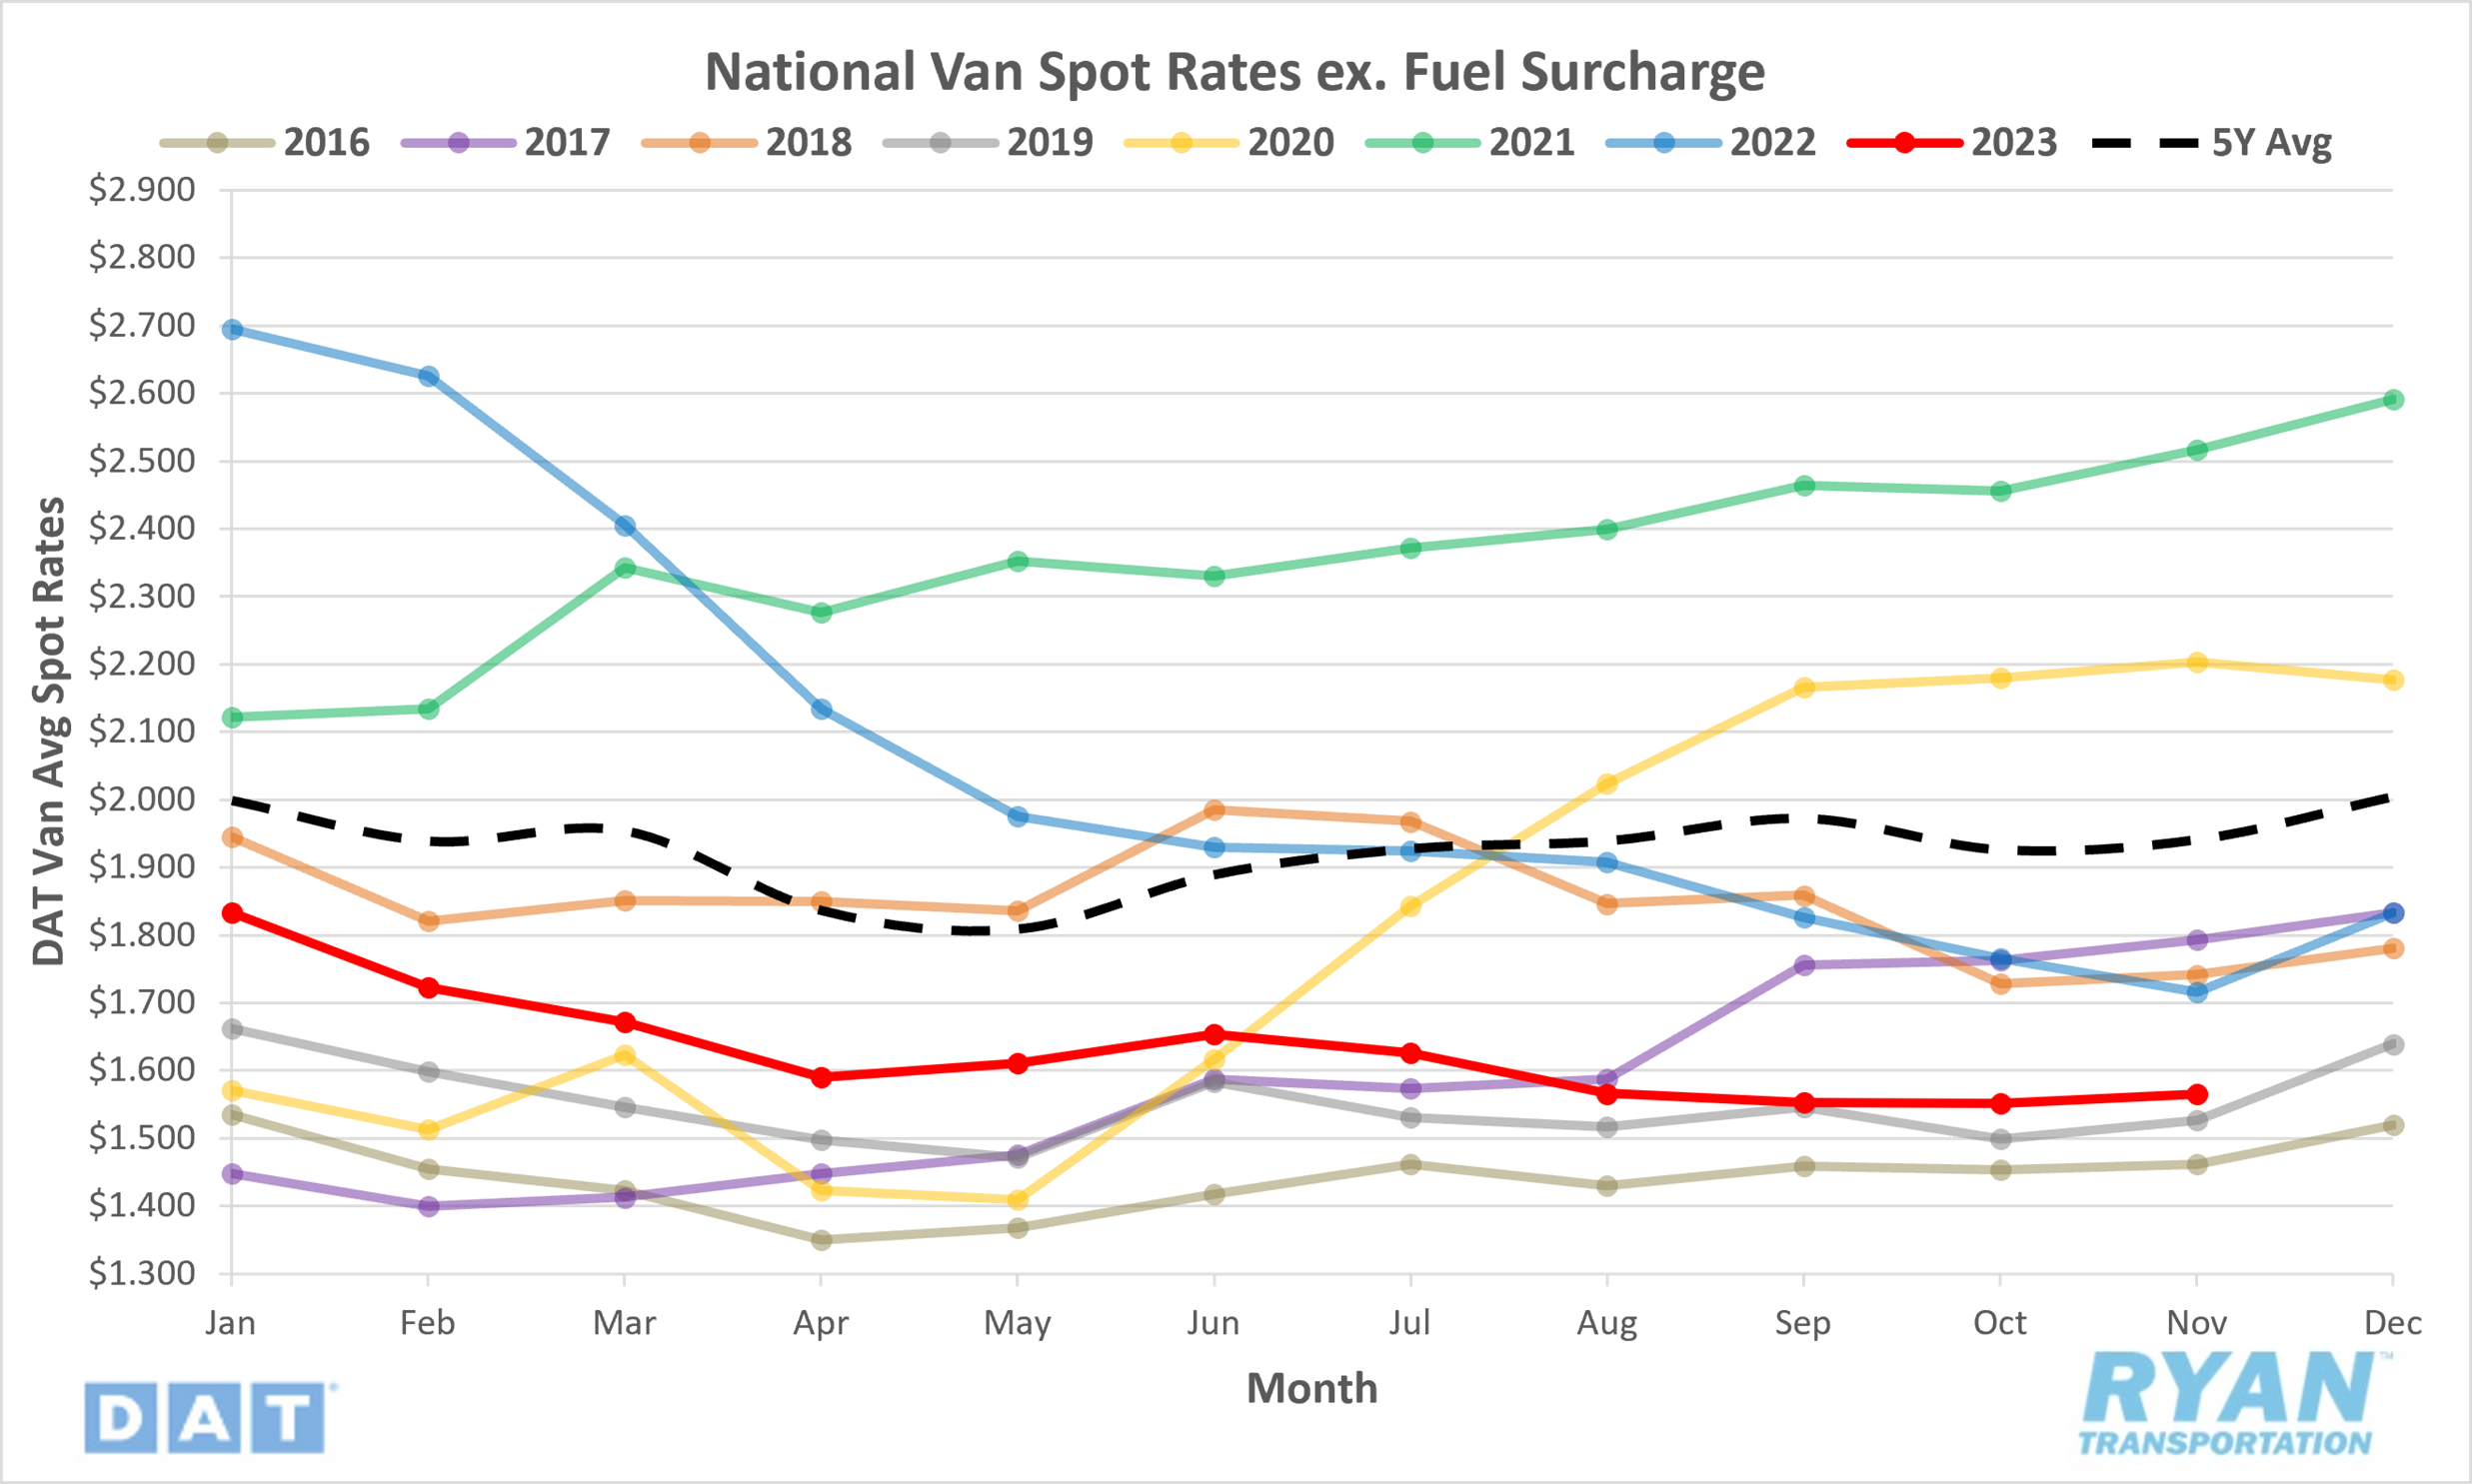
- The national average spot rate excl. fuel surcharge (FSC) increased 1.1%, or $0.018, MoM in November.
- The average linehaul spot rate in November was 8.3% below YoY levels and sits 17.4% below the 5-year average.
Contract Rates
Summary
Following four consecutive months of decline, national linehaul spot rates finally reversed course in late November, ending the month slightly above October's average. This uptick, despite being moderate in magnitude (1.1%), outperformed historical seasonality and offered a glimmer of hope after an unseasonably soft October.
Breaking down the trend further, the majority of the November increase occurred in the final two weeks of the month, as evidenced by DAT's 7-day average linehaul data. Through the first two weeks, the average rate remained flat WoW at just under $1.67 per mile. However, the week of Thanksgiving saw a significant jump of roughly 3%, followed by another 2% increase in the subsequent week. This sharp rise propelled the 7-day average linehaul spot rate to $1.75 by the end of the month, representing a gain of over $0.08 compared to October.
While the contract market has remained relatively stagnant over the past six months, the significant spread between contract and spot rates still suggests a potential for downward adjustments in the future. Initial data for November indicates slight MoM gains in contract rates but revisions to October's data revealed a 0.2% decline, highlighting the ongoing correction within this segment. Notably, the contract-to-spot spread remains historically high at $0.51, indicating further room for downward pressure on contract rates.
Why It Matters:
While the uptick in national linehaul spot rates in November conforms to the usual seasonal trend, expectations for significant gains through the remainder of the year remain subdued. This cautious outlook stems from the market's inability to sustain momentum throughout 2023. The current low baseline, set by October's pandemic-level low, further complicates YoY comparisons, making future increases appear less impressive.
Typically, November's spot rate rise is fueled by a potent combination of pre-holiday demand surge and capacity disruptions caused by the Thanksgiving holiday. However, during the current freight cycle's late and bottoming stages, demand-driven fluctuations have been virtually non-existent as additional volumes have been readily absorbed by the existing capacity networks. This trend persisted through November, with the 7-day average linehaul index remaining stagnant during the first two weeks, a period that typically sees increased activity due to pre-Black Friday inventory replenishment.
Similar to October, initial reports for November's contract rates indicate monthly growth. This coincides with the rise in shorter-term bids, known as mini bids, which were adopted by many customers to capitalize on reduced costs. However, the longer negotiation cycle for contract rates generally shields them from significant MoM fluctuations and has prevented a dramatic decline this year. With RFP season still underway, further downward adjustments to contract rates are likely, particularly considering the significant discount still offered by spot rates.
In summary, while the November spot rate increase aligns with seasonal trends, the overall market conditions temper expectations for substantial gains in the remaining months of 2023. The current low baseline, coupled with the absence of demand driven fluctuations, paints a picture of cautious optimism. Contract rates are also likely to experience further downward pressure as the effects of mini bids and the ongoing RFP season become more pronounced.
Truckload Demand
Key Points
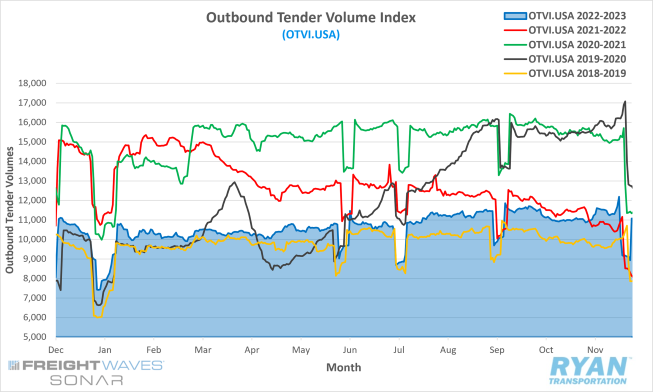
- The FreightWaves SONAR Outbound Tender Volume Index (OTVI), which measures contracted tender volumes across all modes, ended November just 90 basis points (bps) higher than the levels recorded 30 days prior.
- The monthly average of daily tender volumes recorded by the index in November was 2.0% lower than the month before, dropping from 11,075.86 to 10,858.04.
- Compared to 2022 levels, November’s daily tender volume average was up 4.9% but remains 8.5% below the 5-year average.
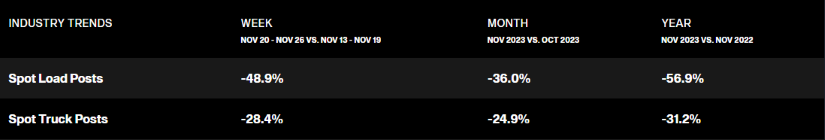
- Spot market volumes deteriorated further in November, falling 36.0% MoM and sitting 56.9% below 2022 levels.
- The Cass Freight Index Report, which analyzes the number of freight shipments in North America and the total dollar value spent on those shipments, registered a 1.3% MoM decline for both shipments and expenditures in November. On an annual basis, shipments are down 8.9% while expenditures are down 7.5%.
Summary
After a brief period of softness in October, tender volumes experienced a significant rally in early November, with the OTVI increasing by 4.5% in the first two weeks of the month. However, this positive momentum stalled midway through the month and was followed by a 1.4% decline in the week before Thanksgiving. The week leading up to the holiday witnessed a final volume surge, pushing the OTVI to its highest daily level (12,184.57) since September 2022. Despite this surge, the average daily tender volume for November witnessed a slight MoM decline, likely due to the lull in activity after the holiday.
On an annual basis, the contract market benefited from the below average demand levels observed last November, registering its first YoY gain since February 2022. Tender volumes at the start of Thanksgiving week were 9.6% higher than the same time last year. While demand remains muted compared to historical standards, it has actually shown growth on a quarterly basis throughout the year. The OTVI recorded volume increases of over 3% between the first and second quarter and and 5% between the second and third quarter.
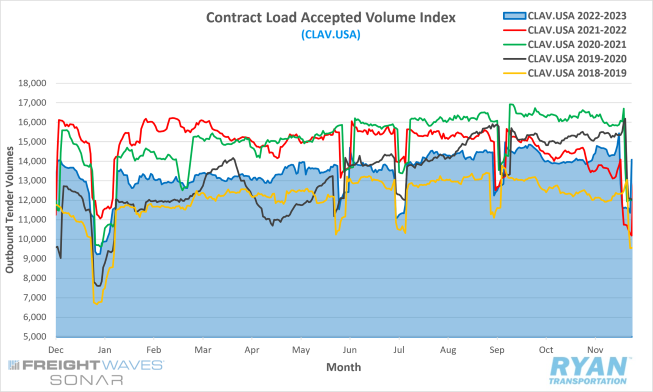
However, the spot market continues to deteriorate significantly compared to both the previous month and the same period last year. According to DAT, available volumes continue to flow predominantly through the contract market, as spot load posts witnessed substantial declines despite November traditionally marking peak truckload season. This shift towards the contract market is further supported by FreightWaves SONAR's Contract Load Accepted Volumes (CLAV) index shown below, which removes rejected tenders from the OTVI. This index showed a 2.5% increase in accepted load volumes for November and ended the month over 38% higher than the same period last year.
Why It Matters:
The increase in tender volumes observed in the first half of November indicates that the market experienced a peak season, albeit a subdued one. While the 2022 peak season was uncharacteristically weak, the YoY growth registered this November suggests that freight volumes are recovering from the current cycle's bottom. Notably, the influx of volumes during a period of flat rates offers evidence that the current freight recession is primarily driven by excess capacity rather than demand levels.
December, traditionally a softer month for contract volumes, tends to be more affected by holiday-related disruptions to capacity. As drivers take time off for the holidays, volumes are expected to shift from the contract market to the spot market, likely leading to more favorable monthly and yearly comparisons.
However, approaching the end of 2023, volume trends will have minimal impact on near-term projections for 2024. Instead, closer attention should be paid to rates and carrier capacity as the market enters the new year. These factors will provide more valuable insights into the trajectory of the freight market in the coming months.
Truckload Supply
Key Points
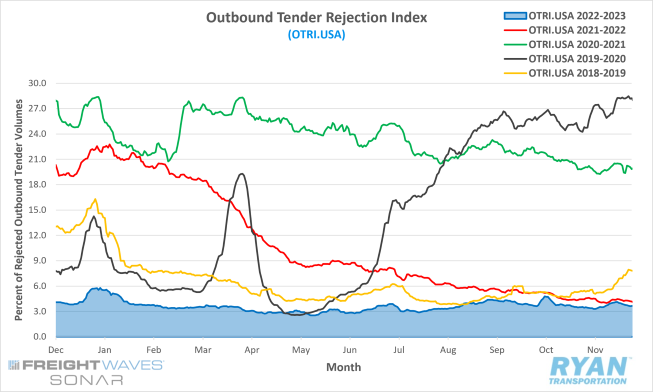
- The FreightWaves SONAR Outbound Tender Rejection Index (OTRI), a measure of relative capacity based on carriers’ willingness to accept freight volumes under contract reflected as a percentage, closed out the month at 3.66% and just 20 bps higher than the end of October.
- Average daily tender rejections registered 3.7% in November by the index, 0.2% lower than October’s average of 3.9%.
- Compared to the previous year, average daily tender rejections were down 63 bps in November and are 10.6% below the 5-year average.
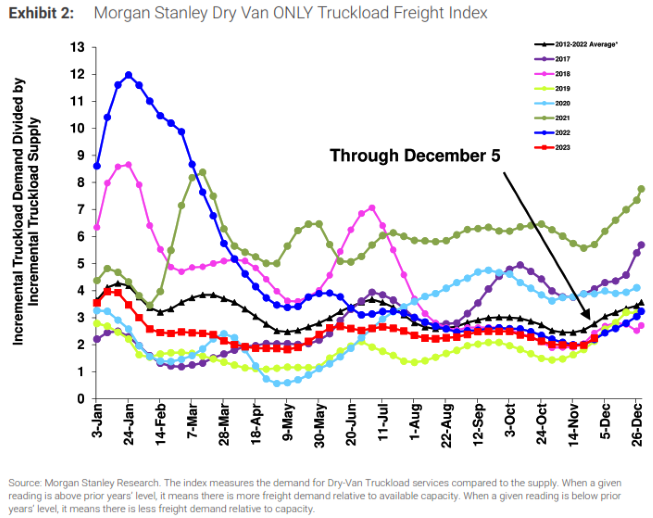
- After trending negatively throughout most of November and underperforming seasonality, the Morgan Stanley Truckload Freight Index saw a sharp uptick at the end of the month and outperformed seasonality
Summary
Data from November further strengthens the argument that the current freight recession is primarily driven by factors on the supply side. Despite a temporary rise in demand early in the month, both tender rejections and rates remained largely unaffected, suggesting that existing capacity levels are readily absorbing additional volumes.
By the second week of November, the OTRI (Outbound Tender Rejection Index) reached its lowest point (3.29%) since July, indicating minimal resistance from carriers. Similarly, daily tender rejections tracked by FreightWaves SONAR averaged a mere 3.56% in the first half of the month, jumping marginally to 3.87% in the post-Thanksgiving period due to holiday-related driver absences. Overall, rejection rates remained historically low throughout November.
While muted rejections and forced volume acceptance demonstrate the oversupply issue, there are subtle signs of a potential capacity correction. Average daily rejection rates have been slowly increasing over the past three quarters, with the Q4 average exceeding both Q3 and Q2 averages by 12 basis points and 77 basis points, respectively.
However, YoY comparisons suggest that achieving equilibrium remains unlikely in the immediate future. Compared to the same period last year, average tender rejections leading up to Thanksgiving were down 35 basis points, highlighting the persisting oversupply. The Morgan Stanley Truckload Freight Index further supports this observation, with current levels remaining below both 2022 and long-term averages. Despite narrowing the gap in recent months, the index still indicates an elevated capacity relative to demand.
Why It Matters:
November data further clouded the outlook for a balanced market, casting doubt on previous projections. Initial industry consensus placed the rebalancing timeline in Q2 2024, but growing speculation has pushed that timeframe later into the year.
At a recent conference, several industry leaders indicated that seasonality growth impacts would likely not be felt until mid-2024. However, some analysts remain less optimistic, suggesting that recovery stage growth might not begin until Q4 2024.
The significance of volume fluctuations in the coming months is diminished by the persistence of excess supply. Demand typically weakens towards the end of the year and remains subdued through Q1, reaching its annual low. During this period, carrier rejection rates will be a crucial indicator of the market's progress towards recovery. Considering current levels, achieving equilibrium remains a distant target.
In essence, November's data has amplified the uncertainty surrounding the market's rebalancing timeline. While an early to mid-2024 rebalancing was initially anticipated, the prevailing sentiment now leans towards a later date, potentially Q4 2024 or beyond. The upcoming period will be marked by significant fluctuations in demand, with Q1 being the weakest quarter. Monitoring rejection rates during this time will be paramount in assessing the market's progress towards a balanced state.
Truckload Capacity Outlook
Key Points
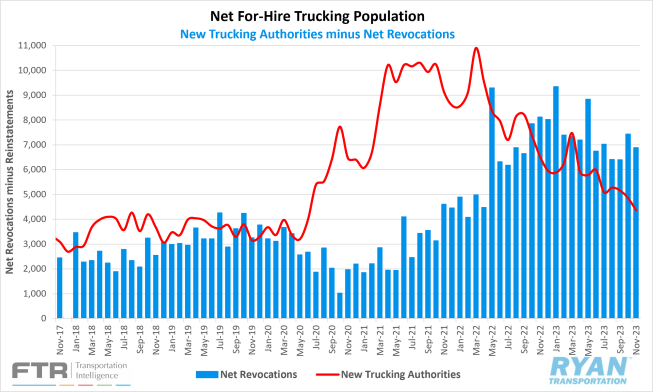
- Total net revocations, which measures total authority revocations minus the number of reinstatements, registered lower MoM in November by dropping from 7,433 carriers in October to 6,886 carriers, according to FTR’s preliminary analysis of the Federal Motor Carrier Safety Administration (FMCSA) data.
- The number of newly authorized for-hire trucking companies also declined, down from 4,859 carriers in October to 4,367 carriers in November and the lowest figure since June 2020.
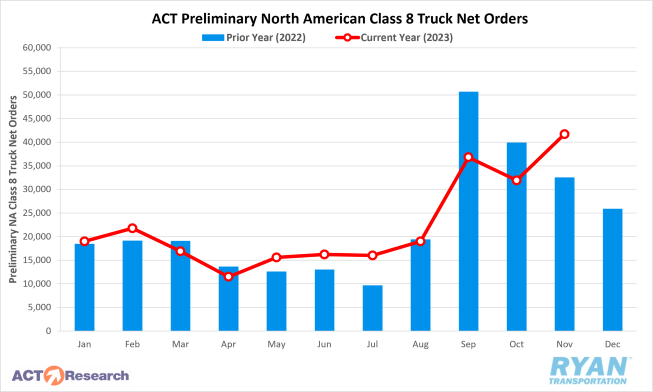
- Depending on the estimate, preliminary North American Class 8 orders ranged from 36,750 per FTR’s report to 41,700 according to ACT Research’s analysis
Summary
November saw another decline in the net carrier population with 2,519 carriers exiting the market, just shy of October's 2,574. This marks the 13th month of decline in the past 14 months and highlights the ongoing trend of carrier exits. However, compared to last year, the pace of net revocations has slowed with November's figure falling short of last year's by 1,235 carriers. This is largely attributed to a decrease in new entrants, which fell by just under 500 compared to October and over 2,100 compared to the same period last year.
Despite the continued decline in the carrier population, Class 8 truck orders experienced a significant surge in November, registering their best month in over a year with 41,700 units ordered. Seasonally adjusted, this translates to 40,100 units, making it the best "real" order month since September 2022. This represents a 32% increase MoM and a 2% increase YoY, defying the overall weakness in the freight market. FTR reported that build slots for 2024 continue to be filled at a healthy rate as fleets remain willing to order new equipment, despite prolonged weakness in the overall freight market and weak truck utilization.
However, despite the strong order activity, active truck utilization remains around 88%, which is well below the 10-year average of 92%. FTR estimates that utilization will remain below average throughout much of 2024, with a full point drop in projections compared to previous forecasts. This suggests that the current oversupply in the trucking market is likely to persist for some time, despite the decrease in the carrier population.
Why It Matters:
While November's continued decline in the carrier population is a positive sign for market rebalancing, the current pace remains insufficient to achieve a balanced state. The primary concern is that net revocations, despite being elevated, are still far below the rapid growth rates experienced in 2020 and 2021.
FTR speculates that a portion of November's high exit figures stems from the FMCSA's stricter enforcement of the legal representative requirement in each state. Many carriers utilize "blanket companies" for this purpose, but a recent crackdown identified several companies lacking effective representation across all states. This left many carriers scrambling for new solutions or facing revocation. According to FTR, roughly 1,000 of the 2,500 revocations during the Thanksgiving week were linked to these unauthorized blanket companies.
FreightWaves suggests seasonality and the early removal of "fluff" capacity contribute to the apparent slowdown in revocations compared to last year. In other words, weaker carriers were forced to leave the market earlier.
Fuel Prices
Key Points
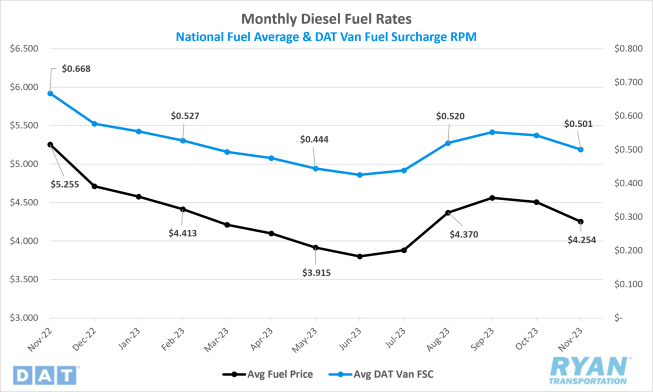
- The national average fuel price recorded by the U.S. Department of Energy (DOE) was $4.254 in November, a 5.6% decline from October’s average of $4.507.
- The average price of diesel across the U.S. in November was just over $1.00, or 19.1%, below the average recorded in November 2022.
- Builds on commercial crude inventories continued to outpace draws for the second consecutive month, increasing by 27.77M barrels (bbls) vs the 1.76M bbls consensus between the weeks ending November 3 and November 24.
Summary
November saw a consistent decline in national average diesel prices, culminating in a total drop of $0.308 by the end of the month. This marks the eighth decline in the past 10 weeks, following a nine-week period of consecutive increases. Compared to the same month last year, the average benchmark price has fallen by just over $1.00.
The sharp price drop can be attributed to a significant surge in crude oil inventories in November, driven primarily by an increase of 13.87 million barrels in the week ending November 3rd. This represents the largest WoW increase since February 10 and the third largest increase year-to-date. November also marks the second largest monthly inventory build since January 2023, when inventories rose by over 32 million barrels. The November builds came at a time when U.S. producers ramped up production activity. After falling to their lowest level (494) since January in the second week of the month, the active drill rig count saw six additional rigs come back online by the end of the month, according to the most recent Baker Hughes report.
As crude oil inventories rose sharply, future prices continued their downward trend. After opening the month above $80 per barrel, West Texas Intermediate prices settled at their lowest level ($75.33) since mid-July following the release of the Energy Information Administration's (EIA) weekly petroleum status report.
Why It Matters:
The global oil market continued to be characterized by unusual circumstances and responses in November, highlighting the ongoing volatility and uncertainty.
Throughout most of the year, demand issues have been the primary driver in price declines. After reopening late last year, China's economy has made little progress this year in returning to the titan of global economies it once was. Further dampening the demand outlook falls on the uncertainties surrounding the future health of the U.S. economy and the Federal Reserve's tightening on monetary policy. Both factors, topped off by weak economic outlooks across Europe for 2024, look to extend the losses in oil prices.
Though much of the focus remains on future demand, supply levels have also played a significant role in the downturn of oil this year. The initial production cuts announced by the OPEC+ member nations early in the year. followed by the additional cuts announced by Saudi Arabia, had the intended impact of increasing prices but not for the intended duration. This has extended the timeline of reduced production by OPEC+ and Saudi Arabia through till at least Q1 2024. Recently, however, uncertainty has started to grow about the influence of power the Organization of the Petroleum Exporting Countries has, following disagreements among member states of the size and distribution of the production cuts that led to the group delaying its end of November meeting.
Meanwhile, as OPEC+ continues to pullback daily supply levels, U.S. production has ramped up significantly to position itself as a swing producer that sets the tone for the market. Despite U.S. producers pledging commitments to fiscal responsibility and shareholder returns earlier this year, crude exports have reached all-time highs for both Europe and Asia alike.
Dry Van Overview
Dry Van Spot Rates
Key Points
- Average dry van spot rates excl. fuel registered slightly higher MoM in November, increasing 0.9%, or $0.014.
- Compared to 2022, dry van spot rates excl. fuel were 8.8% lower and sit 19.5% below the 5-year average.
- Average contract linehaul rates for dry vans saw similar MoM increases as spot rates, rising 0.6% in November.
Dry Van Load-to-Truck Ratio
Key Points
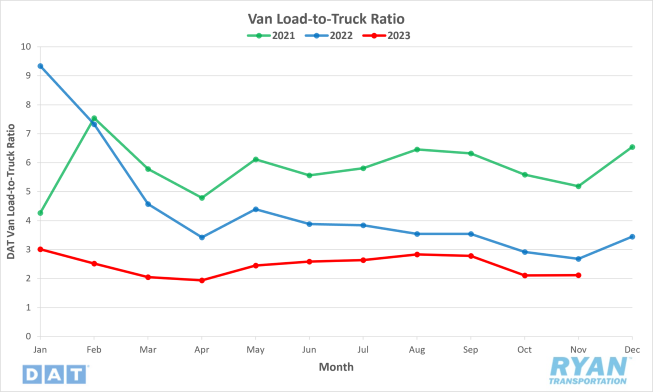
- The dry van load-to-truck ratio (LTR) increased 0.5% MoM in November to 2.12 but remains well below the previous year’s levels, down roughly 20.9%.
Dry Van Market Conditions
Dry Van Summary
The American Trucking Association's (ATA) For-Hire Truck Tonnage Index experienced a 1.1% decline in September, following a 0.2% increase in August. On an annual basis, the index dropped by 4.1%, marking the seventh consecutive YoY decrease, the largest over this period. ATA Chief Economist Bob Costello noted that while there was a rebound in tonnage in the preceding months, September's decline erased half of those gains. The freight market remains volatile, and though it's likely a bottom has been reached, choppy waters may persist. ATA's For-Hire Truck Tonnage Index, which primarily reflects contract freight, serves as a key indicator of the U.S. economy, representing 72.6% of all domestic freight transportation tonnage.
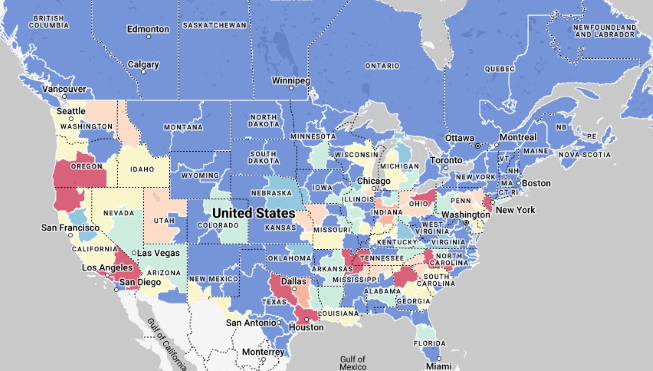
In California, outbound dry van linehaul rates increased to $2.01/mile, reflecting a $0.02/mile rise from the previous year. The state's spot rates have been climbing steadily since mid-September, driven by a resurgence in West Coast import volumes. There may be potential changes in import patterns, with speculation that import volumes may shift back to the West Coast due to ongoing drought conditions in the Panama Canal as well as labor contract renewals on the East Coast. In the spot market, there were fluctuations in linehaul rates across different states. Notably, the Pacific Northwest reported solid gains in outbound rates, driven by the Fall produce and Christmas tree shipping seasons.
Despite the approaching peak season in trucking, the Trucking Ton-Mile Index suggests uncertainty in demand. Professor Jason Miller notes a marginal increase in demand in September but remains cautious about a significant volume surge. Intermodal rail capacity and privately operated fleets are contributing to a soft truckload freight market. Dry van linehaul rates continue to track closely with the 2019 market in the top five spot market states. The JOC Intermodal Savings Index indicates shippers' ongoing preference for intermodal rail over trucking, with significant cost savings.
There was a decrease in dry van spot market load post volume during Thanksgiving week, along with a corresponding decrease in the load-to-truck ratio. Dry van linehaul rates, after remaining flat for over two months, experienced a slight increase.
Reefer Overview
Reefer Spot Rates
Key Points
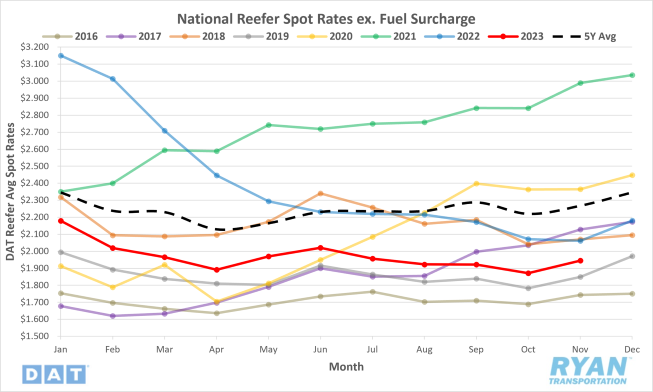
- The national average reefer spot rate excl. fuel rose 3.9% MoM, or $0.073, in November.
- Average reefer linehaul spot rates in November were 10.7% below 2022 levels and sit 14.2% below the 5-year average.
- Average contract rates excl. fuel fell in November, dropping 1.8% MoM and sitting 9.8% below the same time last year.
Reefer Load-to-Truck Ratio
Key Points
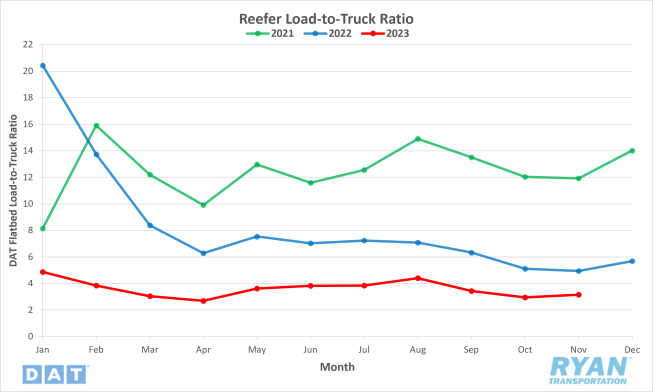
- The reefer LTR increased 7.1% MoM in November to 3.16 but remains 36.2% below November 2022 levels.
Reefer Market Conditions
Reefer Summary
In November, the national average reefer spot rate excl. fuel increased by 3.9% MoM, equivalent to a $0.073 rise. However, average reefer linehaul spot rates for the same period were 10.7% below 2022 levels and 14.2% below the 5-year average. Contrastingly, average contract rates excluding fuel experienced a decline in November, dropping by 1.8% MoM. These rates are now 9.8% below the levels recorded at the same time last year. The reefer load-to-truck ratio (LTR) saw a notable increase of 7.1% MoM in November, reaching 3.16. Despite this increase, the LTR remains substantially lower, sitting at 36.2% below the levels observed in November 2022. These metrics collectively suggest a mixed landscape in the reefer transportation sector, with a monthly uptick in spot rates but continued challenges in comparison to previous years, both in terms of linehaul rates and load-to-truck ratios.
November saw the tomato harvest in the Sacramento Valley conclude along with other late-harvested crops. Despite the substantial increase in tomato volumes, total reefer volumes in California are down 18% compared to last year. Reefer rates were minimally affected due to an adequate supply of trucks reported by the USDA. Spot rates in essential pork- and fresh turkey-producing states were mixed, with some states experiencing lower rates compared to the same time last year. Reefer LTR remains the lowest it has been in seven years, indicating truckload overcapacity. Drought conditions in cattle-ranching states like Texas and Kansas are leading to higher frozen beef shipments. The production of leafy greens moved to California’s Coachella Valley and Arizona’s Imperial Valley. Imperial Valley grows a variety of crops, meeting 90% of lettuce demand between November and March each year. Produce imports from Mexico showed a decrease in November, while Canadian imports are higher than the same time last year.
Reefer spot rates and volumes have fluctuated in recent weeks, with an overall increase during the month. Despite the recent increase, rates remain lower than last year but higher than 2019 levels. Fall produce season, combined with holiday festivities, typically boost reefer volumes and rates. However, this year’s national truckload volumes trail last year’s, especially in California.
Flatbed Overview
Flatbed Spot Rates
Key Points
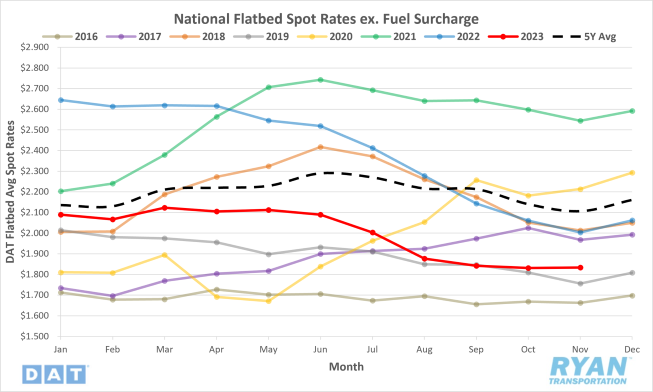
- The national average flatbed spot rate excl. fuel was virtually flat in November MoM, increasing just 0.1%, or $0.003.
- Flatbed linehaul spot rates in November were 8.5% below 2022 levels and are 12.9% below the 5-year average.
- Average contract rates excl. fuel for flatbed carriers registered a 3.1% MoM increase in November, but were 9.4% below the average November 2022 flatbed contract rate.
Flatbed Load-to-Truck Ratio
Key Points
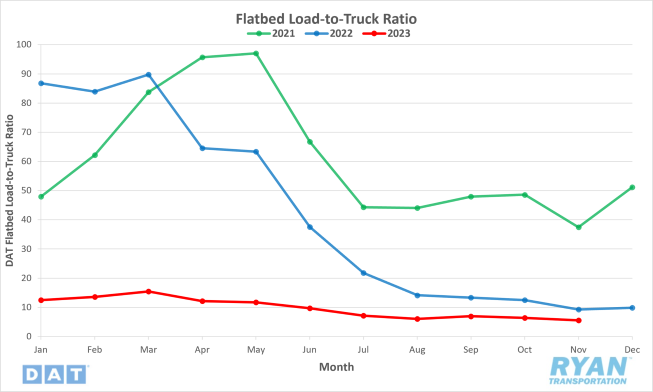
- The flatbed LTR declined further in November, falling 13.2% MoM to 5.52 and remains 40.7% below the previous year's levels.
Flatbed Market Conditions
Flatbed Summary
The flatbed market is considered one of the softest in recent years. Market conditions are being affected by inflationary headwinds, oversupply and seasonal rate softening. The national flatbed spot rate showed minimal change in November. Spot rates were 8.5% lower than in 2022 and sit 12.9% below the 5-year average. On the other hand, contract rates experienced a 3.1% MoM increase in November. However, these rates are still 9.4% below the average recorded in November 2022. Flatbed LTR saw a MoM decline of 13.2%. The LTR of 5.52 is 40.7% below the levels observed at the same time last year. This decrease in LTR may indicate a surplus capacity in the flatbed market.
The American Iron and Steel Institute (AISI) reported a 0.2% WoW increase in steel production, a positive for flatbed demand. Compared to prior years, however, raw steel production numbers are low, especially compared to 2018. The U.S. Census Bureau’s report indicates that construction spending in September increased by 0.4% compared to August and is 8.7% higher than the same time last year. Highway and street construction are the largest contributors, accounting for 12% of spending and increasing 10.4% YoY. Residential homebuilding rates dropped by 7.2% in September, placing further strain on flatbed carriers involved in single-family home construction. The “lock-in” effect, like the 1980s, is slowing the sale of existing homes and impacting demand.
The flatbed market faces challenges, with demand tracking like 2019, which was considered a poor year for carriers. Daseke, Inc., the nation’s largest flatbed carrier, has had to adapt to the challenges. Daseke delivered positive results in Q3, maintaining margins and operating ratios like their record-setting Q3 2022. Like many carriers, Daseke does not expect it will benefit from a recovery until sometime in 2024.
Intermodal
Intermodal Spot Rates
Key Points
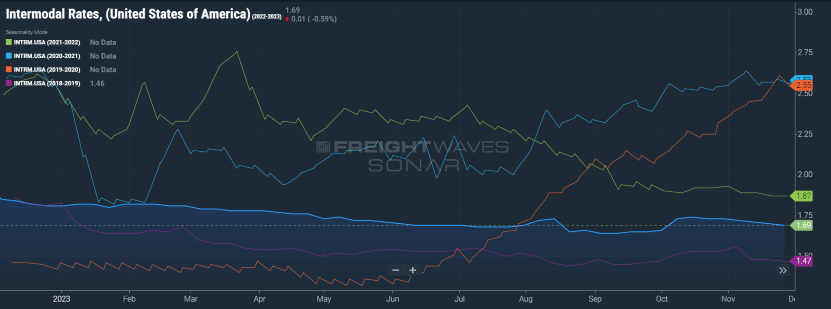
- The FreightWaves SONAR Intermodal Rates Index (INTRM.USA), which measures the average weekly all-in, door-to-door intermodal spot rate for 53’ dry vans across a majority of origin-destination pairings, declined 2.3%, or $0.04, MoM in November.
- Compared to November 2022, intermodal spot rates were down 9.6% and sit 17.4% below the 5-year average.
Intermodal Volumes
Key Points
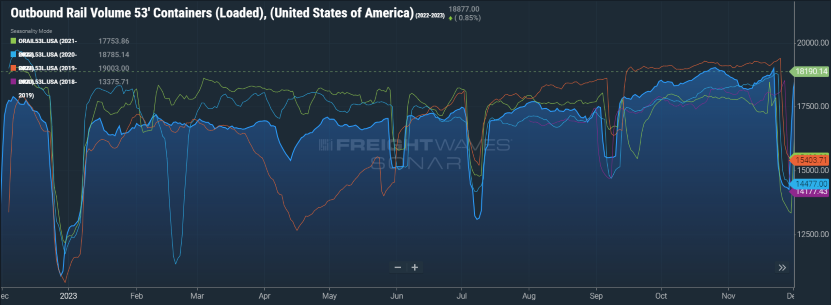
- Total loaded volumes for 53’ containers from all domestic markets, measured by the FreightWaves SONAR Loaded Outbound Rail Volume Index (ORAIL53L.USA), fell roughly 12.0% MoM in November.
- Despite significant MoM declines, total volumes remain elevated compared to 2022 levels, registering 23.8% above the same time last year and 11.5% above the 5-year average.
Intermodal Summary
Intermodal volumes continued to gain traction in November despite its traditional peak season now being over. Total loaded volumes, recorded by the FreightWaves SONAR ORAIL53L.USA index, peaked in the days leading up to Thanksgiving followed by a traditional lull in activity both on and immediately following the holiday. At its peak, volumes were up 0.4% from the month prior and just 0.1% below the peak recorded in October. Though overall volumes were lower in November than in October, on a quarterly basis, Q4 is shaping up to be the best quarter for the year from a volume perspective.
Rates, on the other hand, continue to trend negatively as competition with the truckload sector remains headwind number one. According to the FreightWaves SONAR Intermodal Contract Savings Index (IMCSI.USA), a measure of the discount that intermodal presents compared to dry van, sending freight via the rails isn’t as advantageous as it has been in past cycles. Throughout November, the IMCSI dropped 92 basis points to end the month at 8.76%, nearing the historic lows recorded in May and July.
As demand wanes over the next few months, the intermodal sector is facing an environment of little to no growth, as the slowing economy and merely steady rail service do little to encourage additional volumes to move via rail. As service levels have improved back near historical average standards, the modest outlook has many carriers slowing or ending their hiring programs altogether. Forecasts for 2024 project volumes remaining relatively flat to declining slightly but show chances for growth returning in 2025.
Further Reading
- Holiday inventories remain balanced as shoppers show strength, NRF says - FreightWaves
- Preliminary North American Class 8 orders see gains - Logistics Management
- US-Mexico Trade Trends Indicate Nearshoring Has Momentum - Transport Topics