
Executive Summary
With the first quarter of 2023 now in the books, there remains no sign the market has reached an inflection point. Excess capacity continues to put downward pressure on rates despite consecutive monthly increases in overall volumes. Declining fuel prices have shielded smaller carriers from the deteriorating spot market conditions and extended the timeline of a mass exodus to rebalance the market. U.S. imports saw signs of life as the monthly total in March increased 6.9% over February but still remained down 27.5% over the year. “Nearshoring/friend-shoring” tactics promoted by the White House appear to be working as imports from China fell 41.6% from the highs of August 2022, while total imports fell 26.7% during that same time period. Economic uncertainty heightened following a brief period of financial instability within the banking sector, making the Federal Reserve's goal of tamping down inflation, which remains more than double its target level, much more difficult. Navigating a soft landing is becoming less likely as strong employment numbers and recent CPI figures continue to call for rate increases while simultaneously creating further exposure across financial industries.
Main Takeaways
- Spot rate declines continue to outpace contract rates, as the contract-to-spot spread remains elevated above normal levels at $0.579.
- Manufacturing activity slows as demand remains low and increases economic uncertainty for the back half of the year.
- Capacity surplus reversed its negative trend in March with more newly authorized carriers entering the market than the number of authorities revoked.
- Dry van and refrigerated markets remain weak as increased construction activity boosted flatbed volumes and rates.
Economy
United States ISM Manufacturing PMI
Key Points
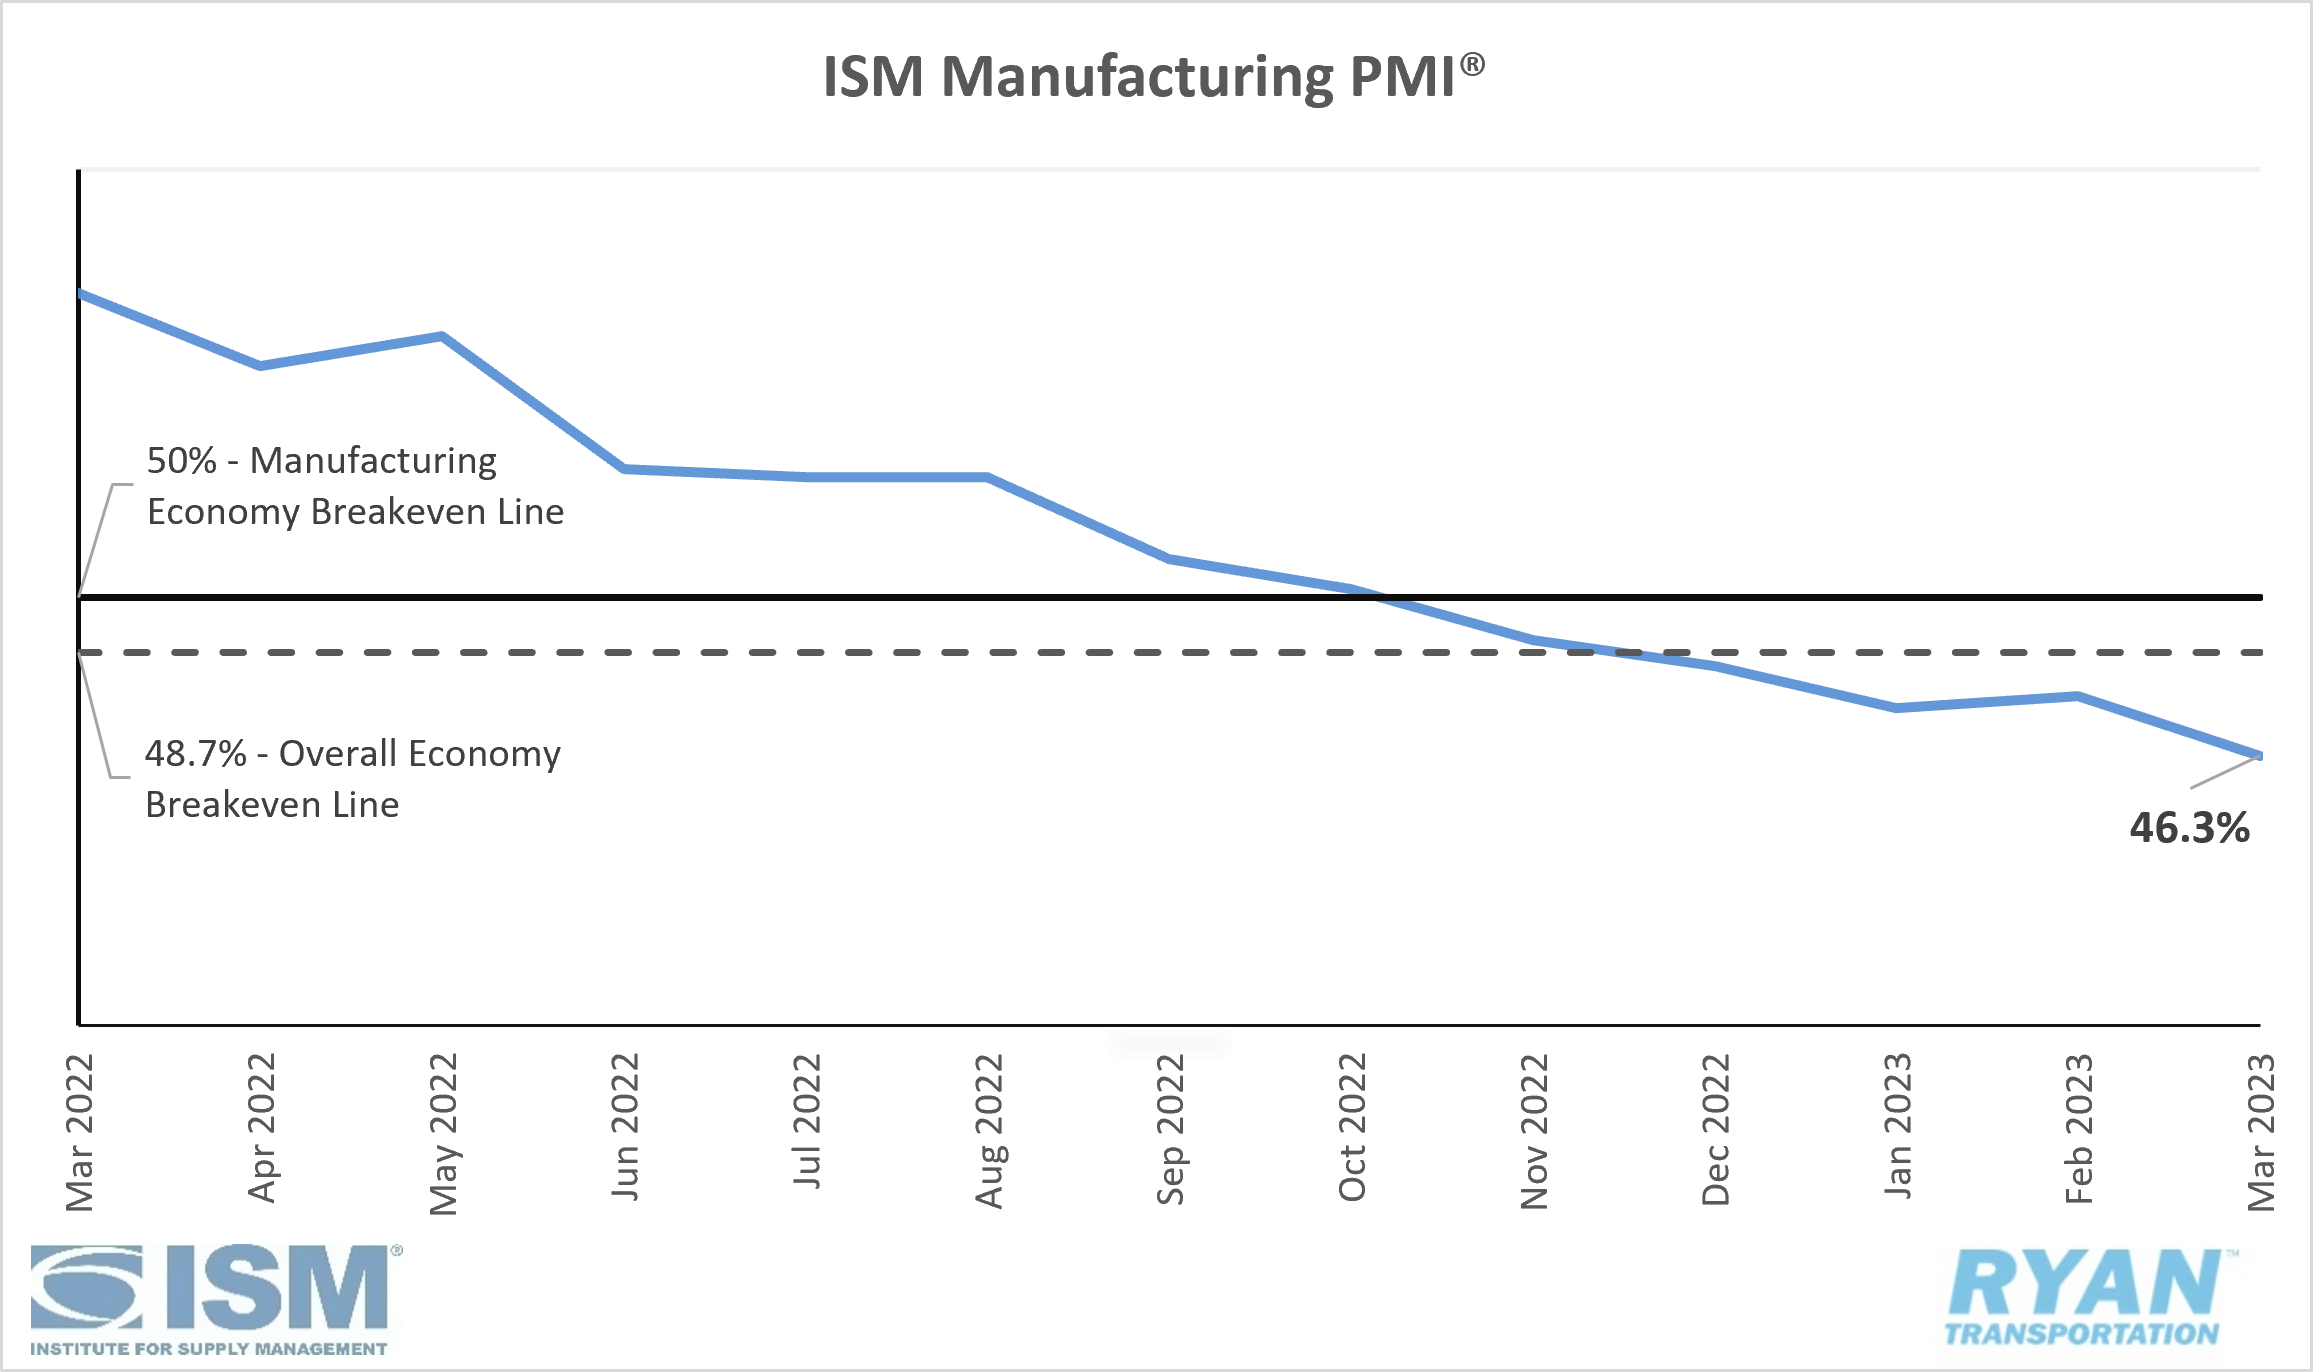
- The ISM Manufacturing PMI® contracted for the fifth consecutive month in March, registering 46.3%, 1.4 percentage points lower than February's reading of 47.7%. In the last three months, the Manufacturing PMI® has recorded its lowest reading since May of 2020, when it registered 43.5%.
- All five subindexes that directly factor into the Manufacturing PMI® (New Orders, Production, Employment, Supplier Deliveries and Inventories) registered in contraction territory in March.
- The Inventories Index moved from growth into contraction territory after falling 2.6 percentage points to 47.5% in March.
- The New Orders Index contracted further in March at 44.3%, 2.7 percentage points lower than February's reading of 47%.
- The Production Index remained in contraction territory but saw a 0.5 percentage point increase from February, registering 47.8%.
- The Supplier Deliveries Index registered 0.4 percentage points lower in March than February, with a 44.8% reading. This is the lowest reading since March 2009 when it registered 43.2%.
Summary
The contraction of the ISM Manufacturing PMI® shows that overall constraints in the supply chain continue to remain downstream, as companies are slowing outputs to match the soft demand environment but expecting growth to ramp up in the back half of the year. Breaking down the demand components of the PMI® further, customers’ inventories are around the high end of a ‘just right’ level, eliminating New Orders as it has over the past 10 months. This is forcing the backlog of orders to sag and move further into contraction, creating a negative outlook on future production levels, according to the Institute for Supply Management. So far in 2023, companies have remained positive regarding growth momentum in the latter part of the year, however, the contraction in the Employment Index in March signals that confidence is beginning to waver.
Why it Matters: The near-term outlook for manufacturing activity continues to remain soft as previously expected, through at least Q2 of 2023. The long-term outlook has become less clear, however, as the once-positive signals for expansion in Q3 and Q4 of this year are starting to show cracks. Price instability is one factor muddying the picture. As mentioned in our last update, the reduction of new orders likely stemmed from pricing disagreements between buyers and suppliers. Had all things remained constant from February to March, the contraction in prices would have been a catalyst for expansion in new orders and supported the positive notion of growth driven by future production. However, the continued softening of demand paired with suppliers clearing order backlogs has put inventory levels at more than manageable levels, putting downward pressure on new orders and eliminating future production.
Macro Impacts
- In its March meeting, the Federal Reserve announced another round of interest rate hikes to continue its fight against inflation, increasing rates by 25 basis points to the current level of 4.75% - 5.00%.
- The most recent adjustment came at the heels of economic uncertainty from a banking crisis after the initial run on Silicon Valley Bank.
- Expectations for another 25-basis-point increase at the next Fed meeting remained low, around a 43% probability, prior to the most recent jobs report release but have now jumped up to a 68.5% probability following strong employment numbers, according to the CME FedWatch Tool.
- Nonfarm payroll employment rose by 236,000 in March, according to the Jobs Report released by the Bureau of Labor Statistics (BLS).
- After a slight increase in February, the unemployment rate fell by 0.1% in March to 3.5%.
- Total transportation and warehousing jobs increased by just over 10,000, with truck transportation adding around 5,700 jobs while warehousing and storage reported a decline of just under 12,000 jobs.
- The Headline Consumer Price Index (CPI) rose 5.0% in March on an annual basis while Core CPI (all items minus food and energy) increased 5.6% in March according to the March CPI report from the BLS.
- The All Items Index rose 0.1% in March after increasing 0.4% in February on a seasonally adjusted basis.
- The seasonally adjusted index for all items minus food and energy rose 0.4% in March after a 0.5% increase in February.
- The Energy Index declined by 3.5% in March with the Food Index remaining flat, however, the Shelter Index offset the decline in Energy as it remains the largest contributor driving the increases.
Industry Overview
March Key Figures (YoY)
| Truck Data Points | YoY% Change |
|---|---|
| DAT Spot Rates (incl. fuel) | -27.9 |
| Fuel Prices | -17.5 |
| ACT Class 8 Preliminary Orders | -10.6 |
| ATA NSA Truck Tonnage | +1.2 |
| Cass Freight Index | -9.6 |
| Cass Freight Expenditures | -12.0 |
| Cass Freight Shipments | -4.0 |
Spot Rates
Key Points
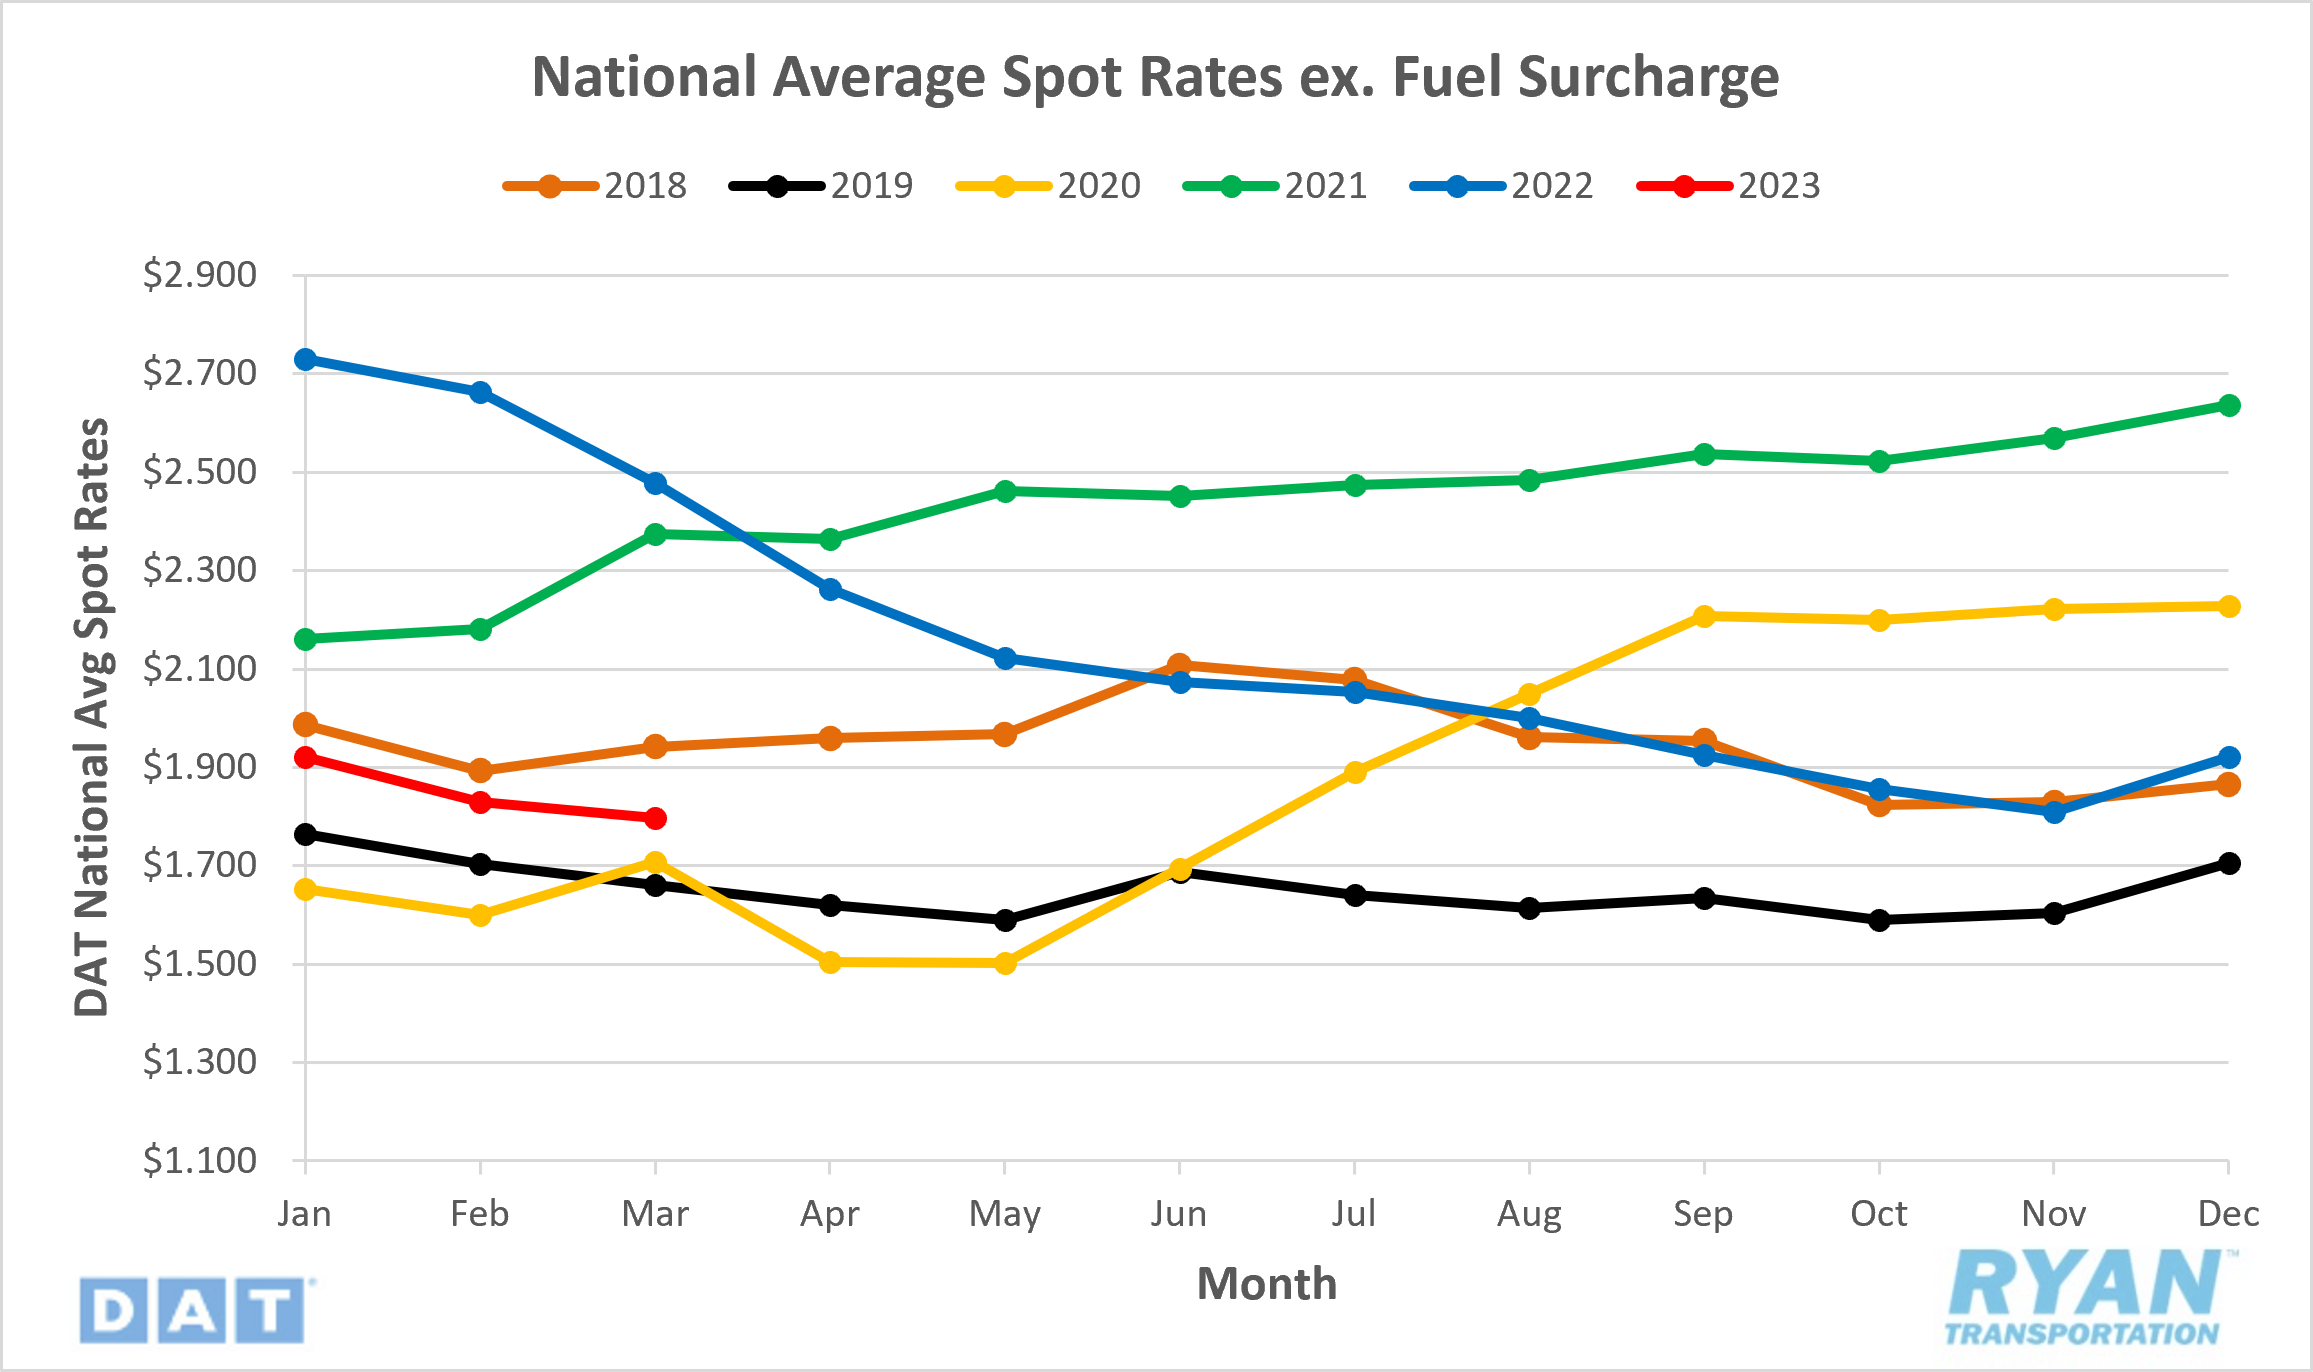
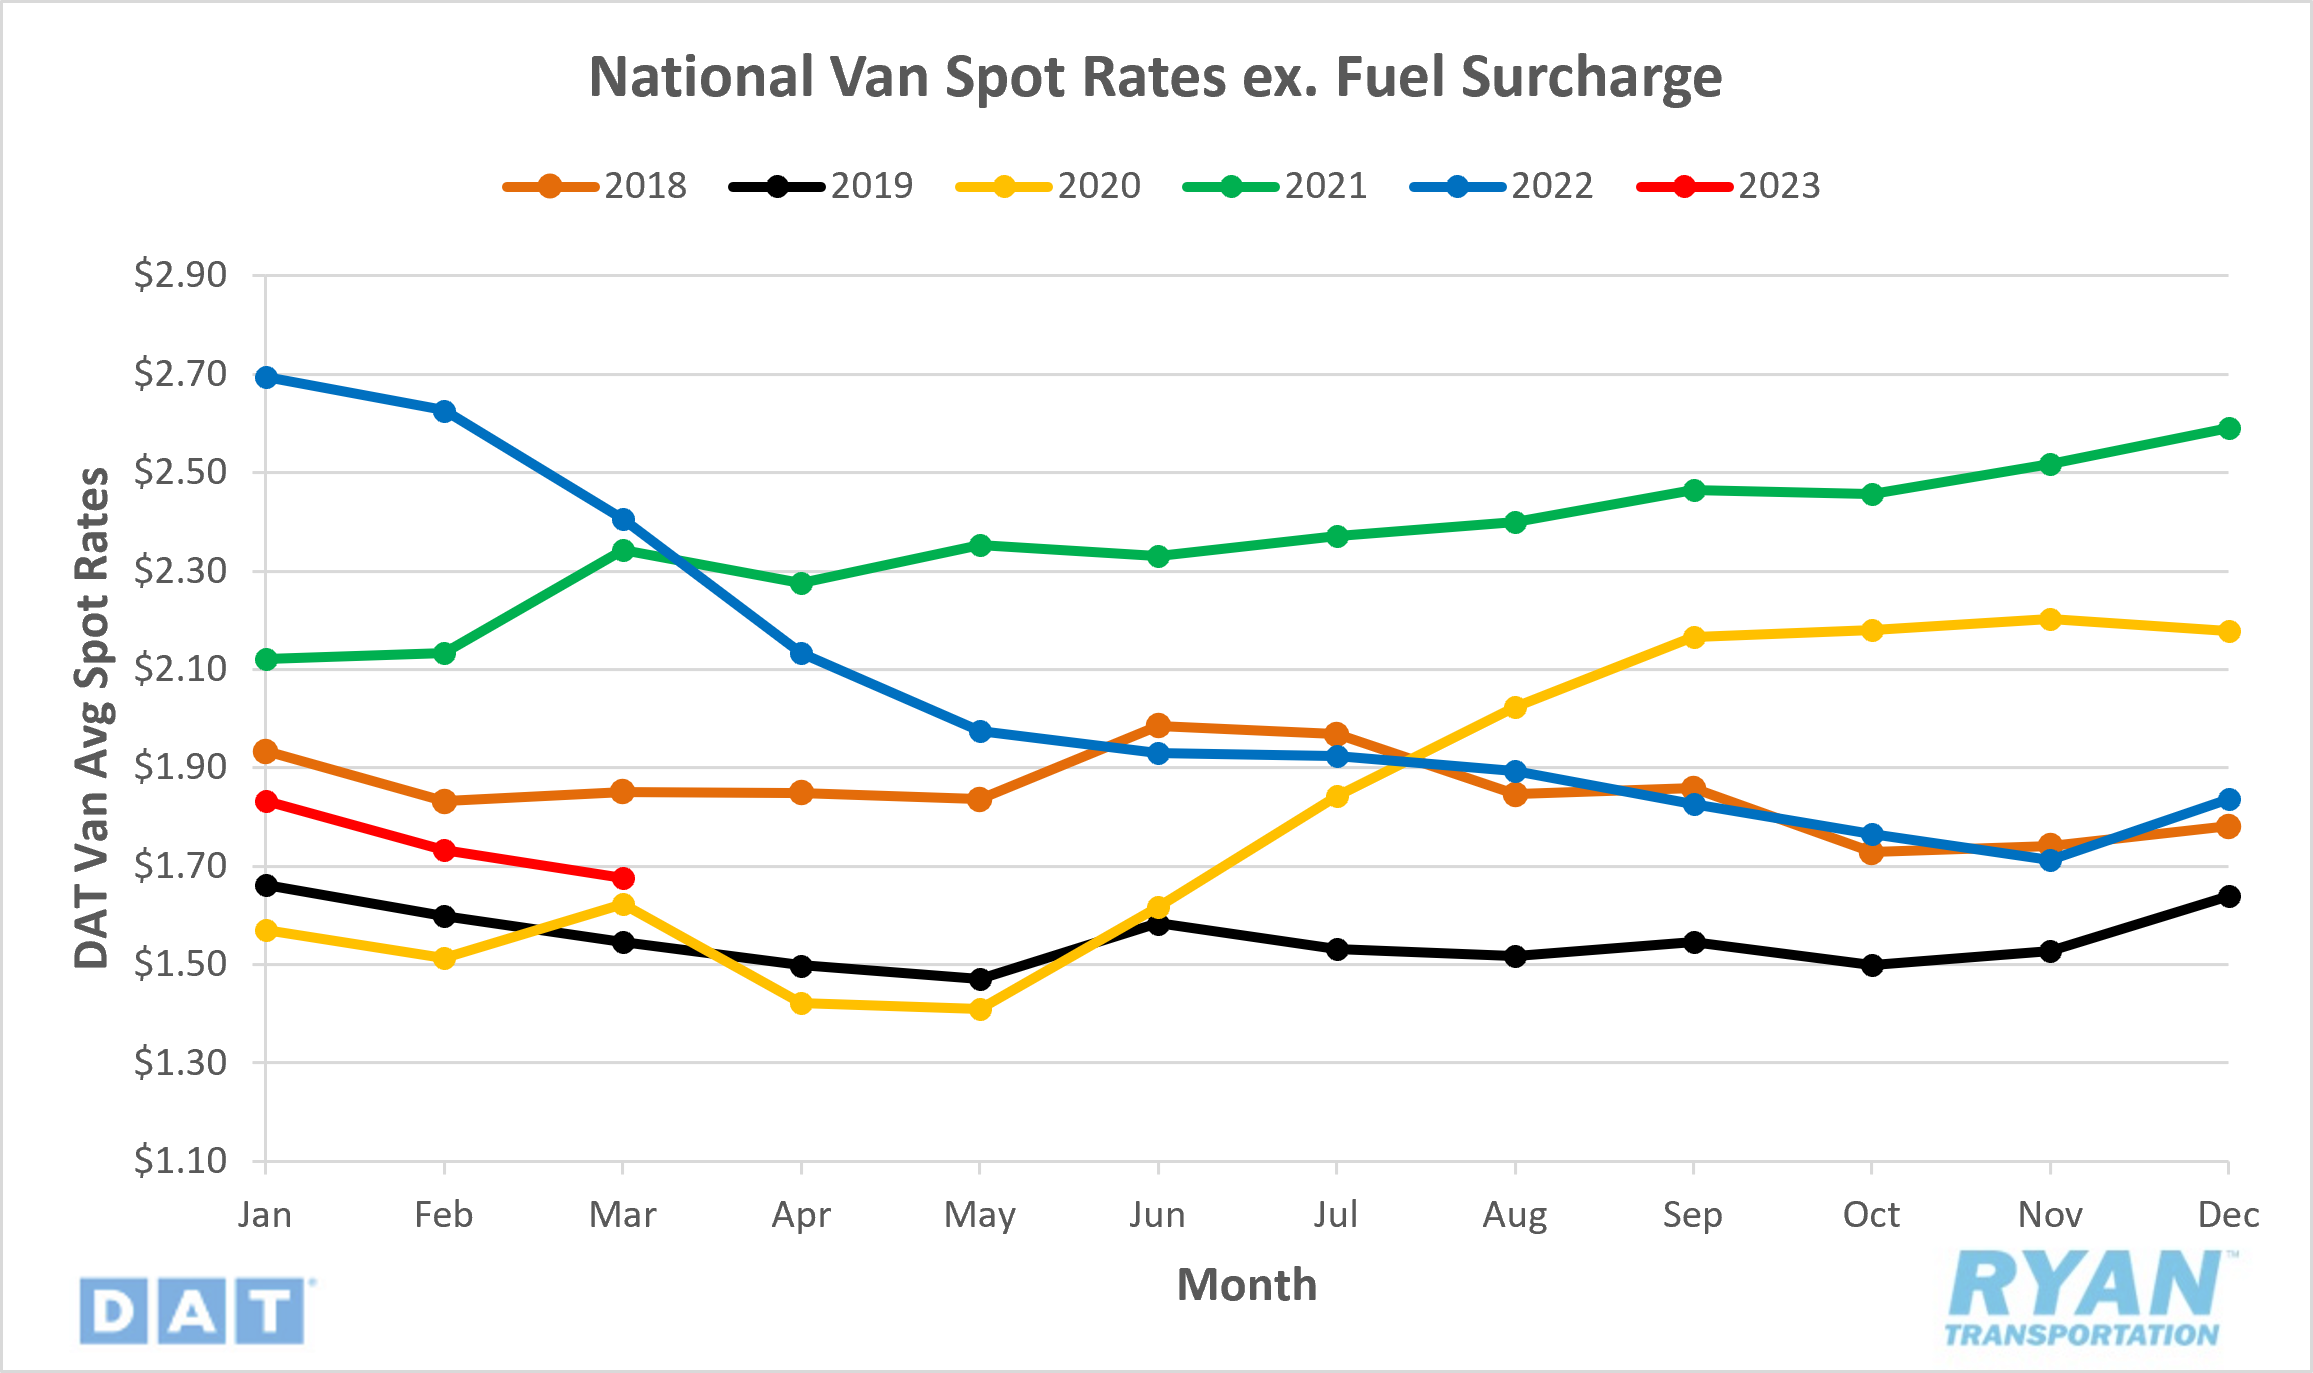
- National spot rates excl. fuel surcharge declined 1.8% MoM in March, ending the month 27.5% below the same time last year.
- Spot rates remain below the 5-year average for the sixth consecutive month, registering 10.6% below in March.
Contract Rates
Key Points
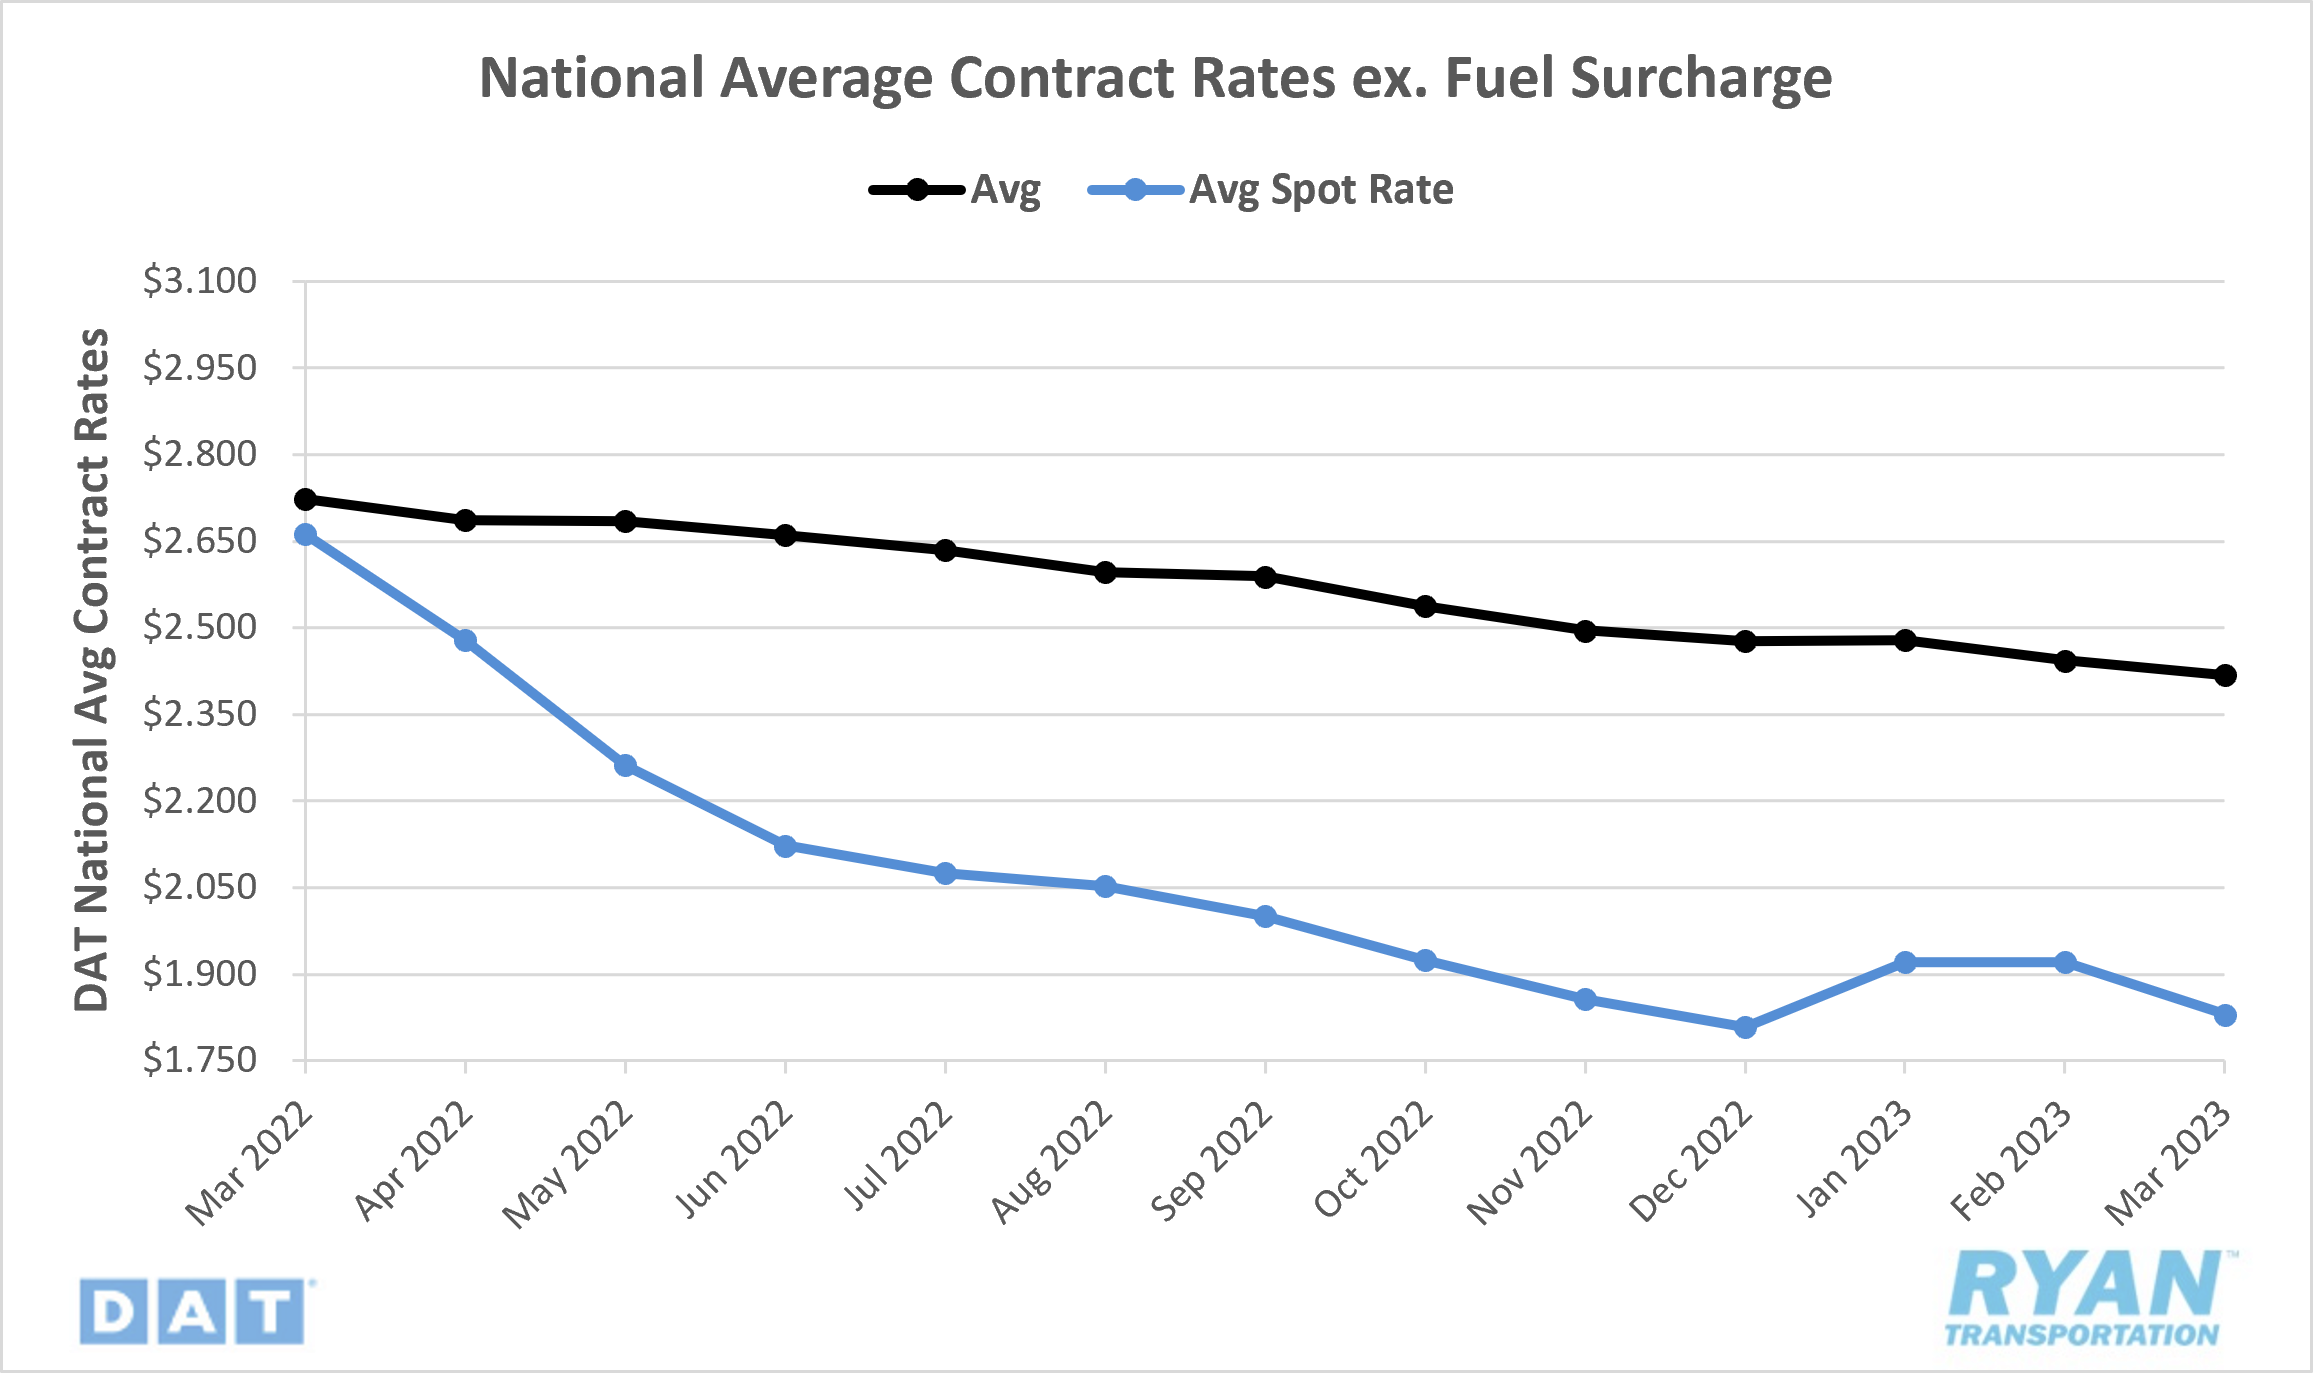
- National contract rates excl. fuel fell 1.7% MoM in March, ending the month 11.6% below last year's levels.
- The contract-to-spot rate spread remains slightly elevated above the normal range at $0.579.
Summary
Rates provided little relief for carriers in March, ending the month down a little over 18% or -$0.39 from where they started the year, as the market continues to search for a floor. While demand is generally weakest in Q1 for the year, March is generally the turning point following normal seasonality as construction activity ramps up and trucking capacity shifts in anticipation of the upcoming produce season. Comparing the linehaul spot rate trend to pre-pandemic years, rates increased 2.6% between February and March in 2018, the last year of noted typical seasonality trends, while they decreased 2.6% during the same time frame in the oversaturated market of 2019. That oversupply of capacity in relation to the demand levels that drove the industry into a recession in 2019 is similar to what is happening in today’s market. Capacity remains readily available, despite declining demand. However, one difference worth noting is that while the linehaul spot rate declines in March 2019 took a toll on all three major truckload transportation modes, last month's declines only impacted the dry van and refrigerated sectors, as flatbed carriers saw increases in both volumes and spot rates excl. fuel. The sample size remains small, but it does provide some support for the theory of a return to seasonality at some point this year.
Truckload Demand
Key Points
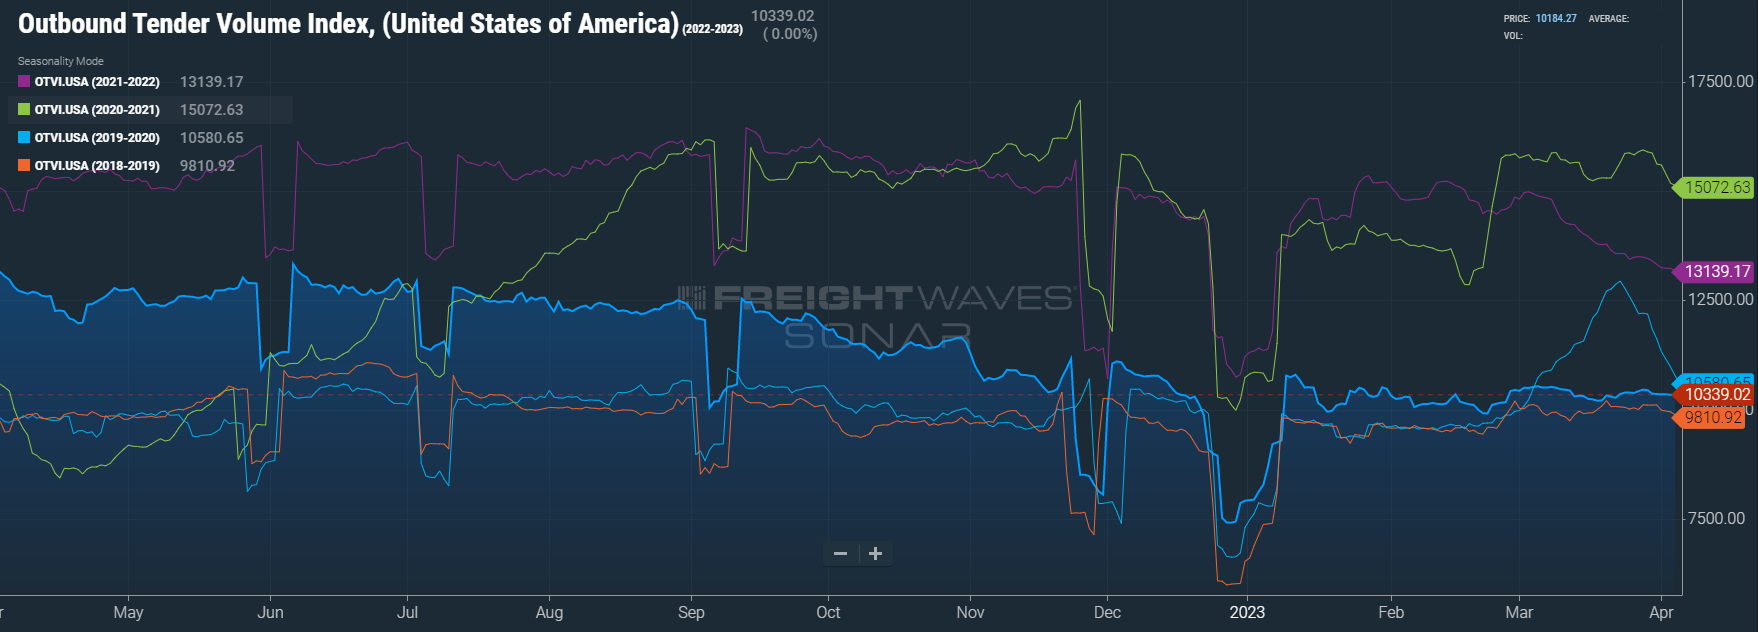
- The FreightWaves SONAR Outbound Tender Volume Index (OTVI), which measures contract tender volumes across all modes, increased for the third consecutive month in March, registering 2.2% above February's levels. Year over year, however, the OTVI was down 26.4% from March 2022 and was well below the 5-year average at -26.9%.
- The Cass Freight Index, which analyzes the number of freight shipments in North America and the total dollar value spent on freight shipments, reported decreases in March YoY levels for both shipments and expenditures of 4% and 12%, respectively.
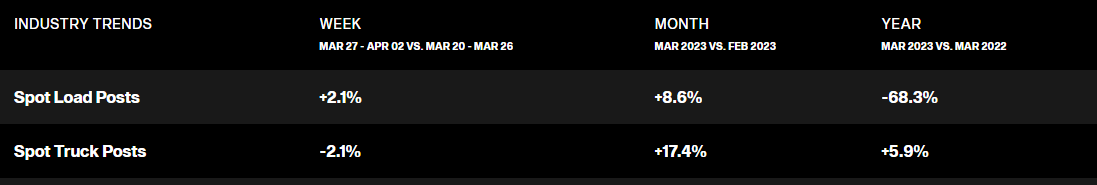
- Spot market volumes were down 68.3% YoY in March, according to DAT, while MoM volumes increased 8.6%.
Summary
March marked the one year point of when the deflationary stage of the market cycle began as softening demand levels eroded away the record high volumes and rates set in January 2022. Through the first three months of the year, overall volumes have reversed the downward trend established throughout 2022 but still remain within only a few points of pre-pandemic levels. Spot market activity saw a nominal increase MoM in March, likely a result of customers and shippers pushing volume before the end of the quarter. The contract market, which has been the main beneficiary of the deteriorating spot market, registered a 2.1% increase MoM in March according to Freightwaves SONAR Contract Loads Volumes Index (CLAV), which measures load volumes accepted by carriers under contracted obligations.
Truckload Supply
Key Points
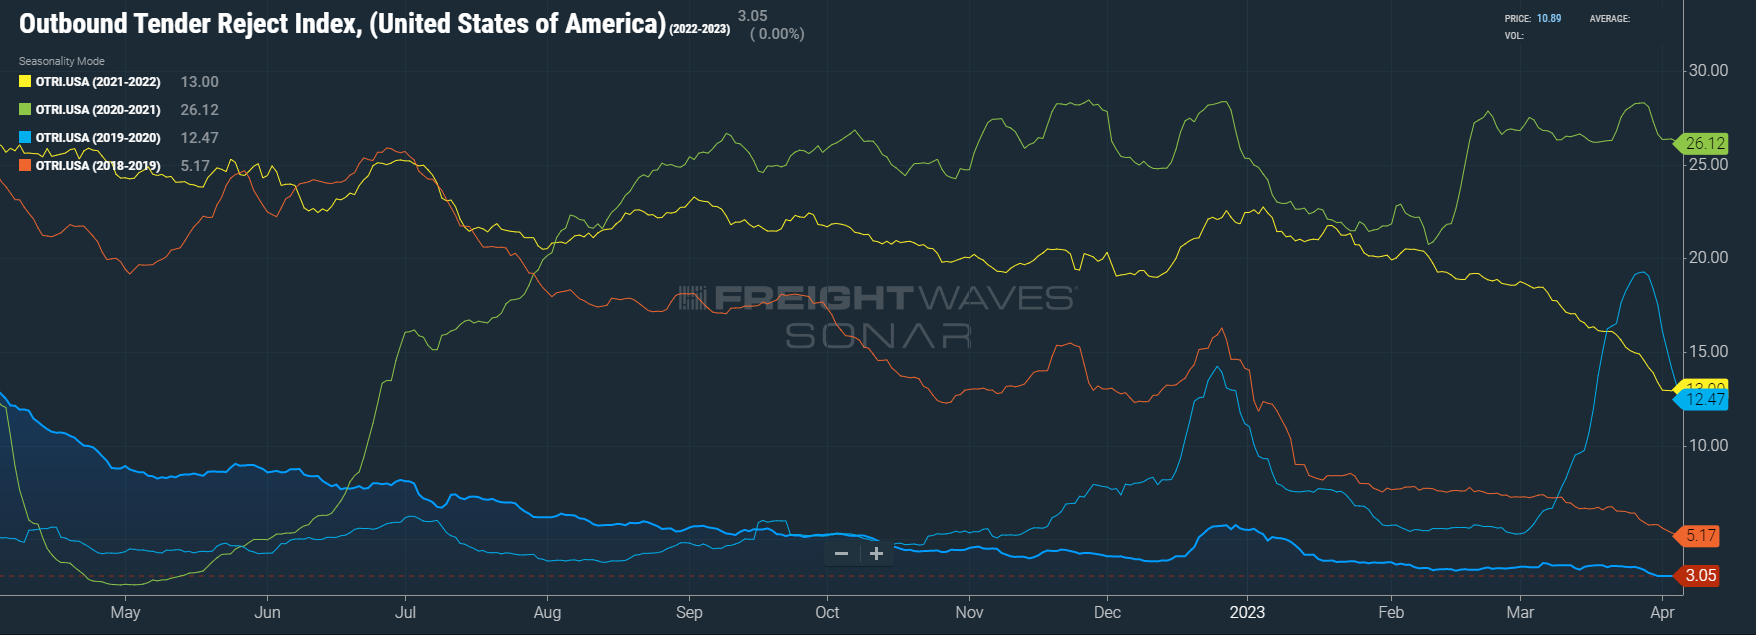
- The Freightwaves Outbound Tender Rejection Index (OTRI), which measures the number of loads rejected by carriers that are under contract as a percentage, registered 78.7% below March 2022 levels and was up 1.2% MoM from February.
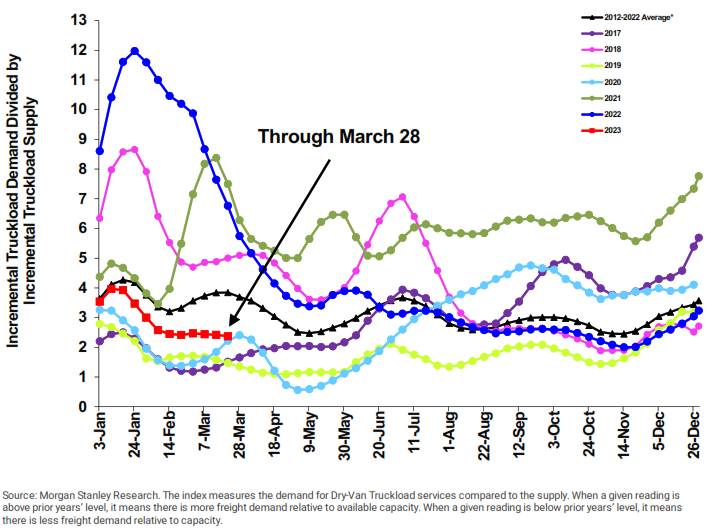
- The Morgan Stanley Truckload Freight Index (MSTLFI) remained flat for most of March before slightly declining in the final week of the month. This is the 12th sequential week that the index has underperformed against seasonality. It remains below the long-term average (the black line in the chart below), and has since mid-August of last year.
Summary
As we previously mentioned above, truckload supply continues to outpace demand through the first three months of the year. While rejection rates of contracted load volumes increased in March after nine consecutive months of declines, it was a nominal increase relative to the rise in overall volumes. March's data continues to reflect the importance carriers are putting on gaining and retaining market share by providing further lane discounts and meeting service level requirements on awarded contracts. Active utilization remains well below the 10-year average of 92% and is projected to hold between 86% and 87% through Q2 of 2024 before starting to rise again, according to FTR Intelligence. The increase in demand levels in March provided a two-point bump to the outlook for Q4 of this year, now forecasted to finish the year around 86%.
Truckload Capacity Outlook
Key Points
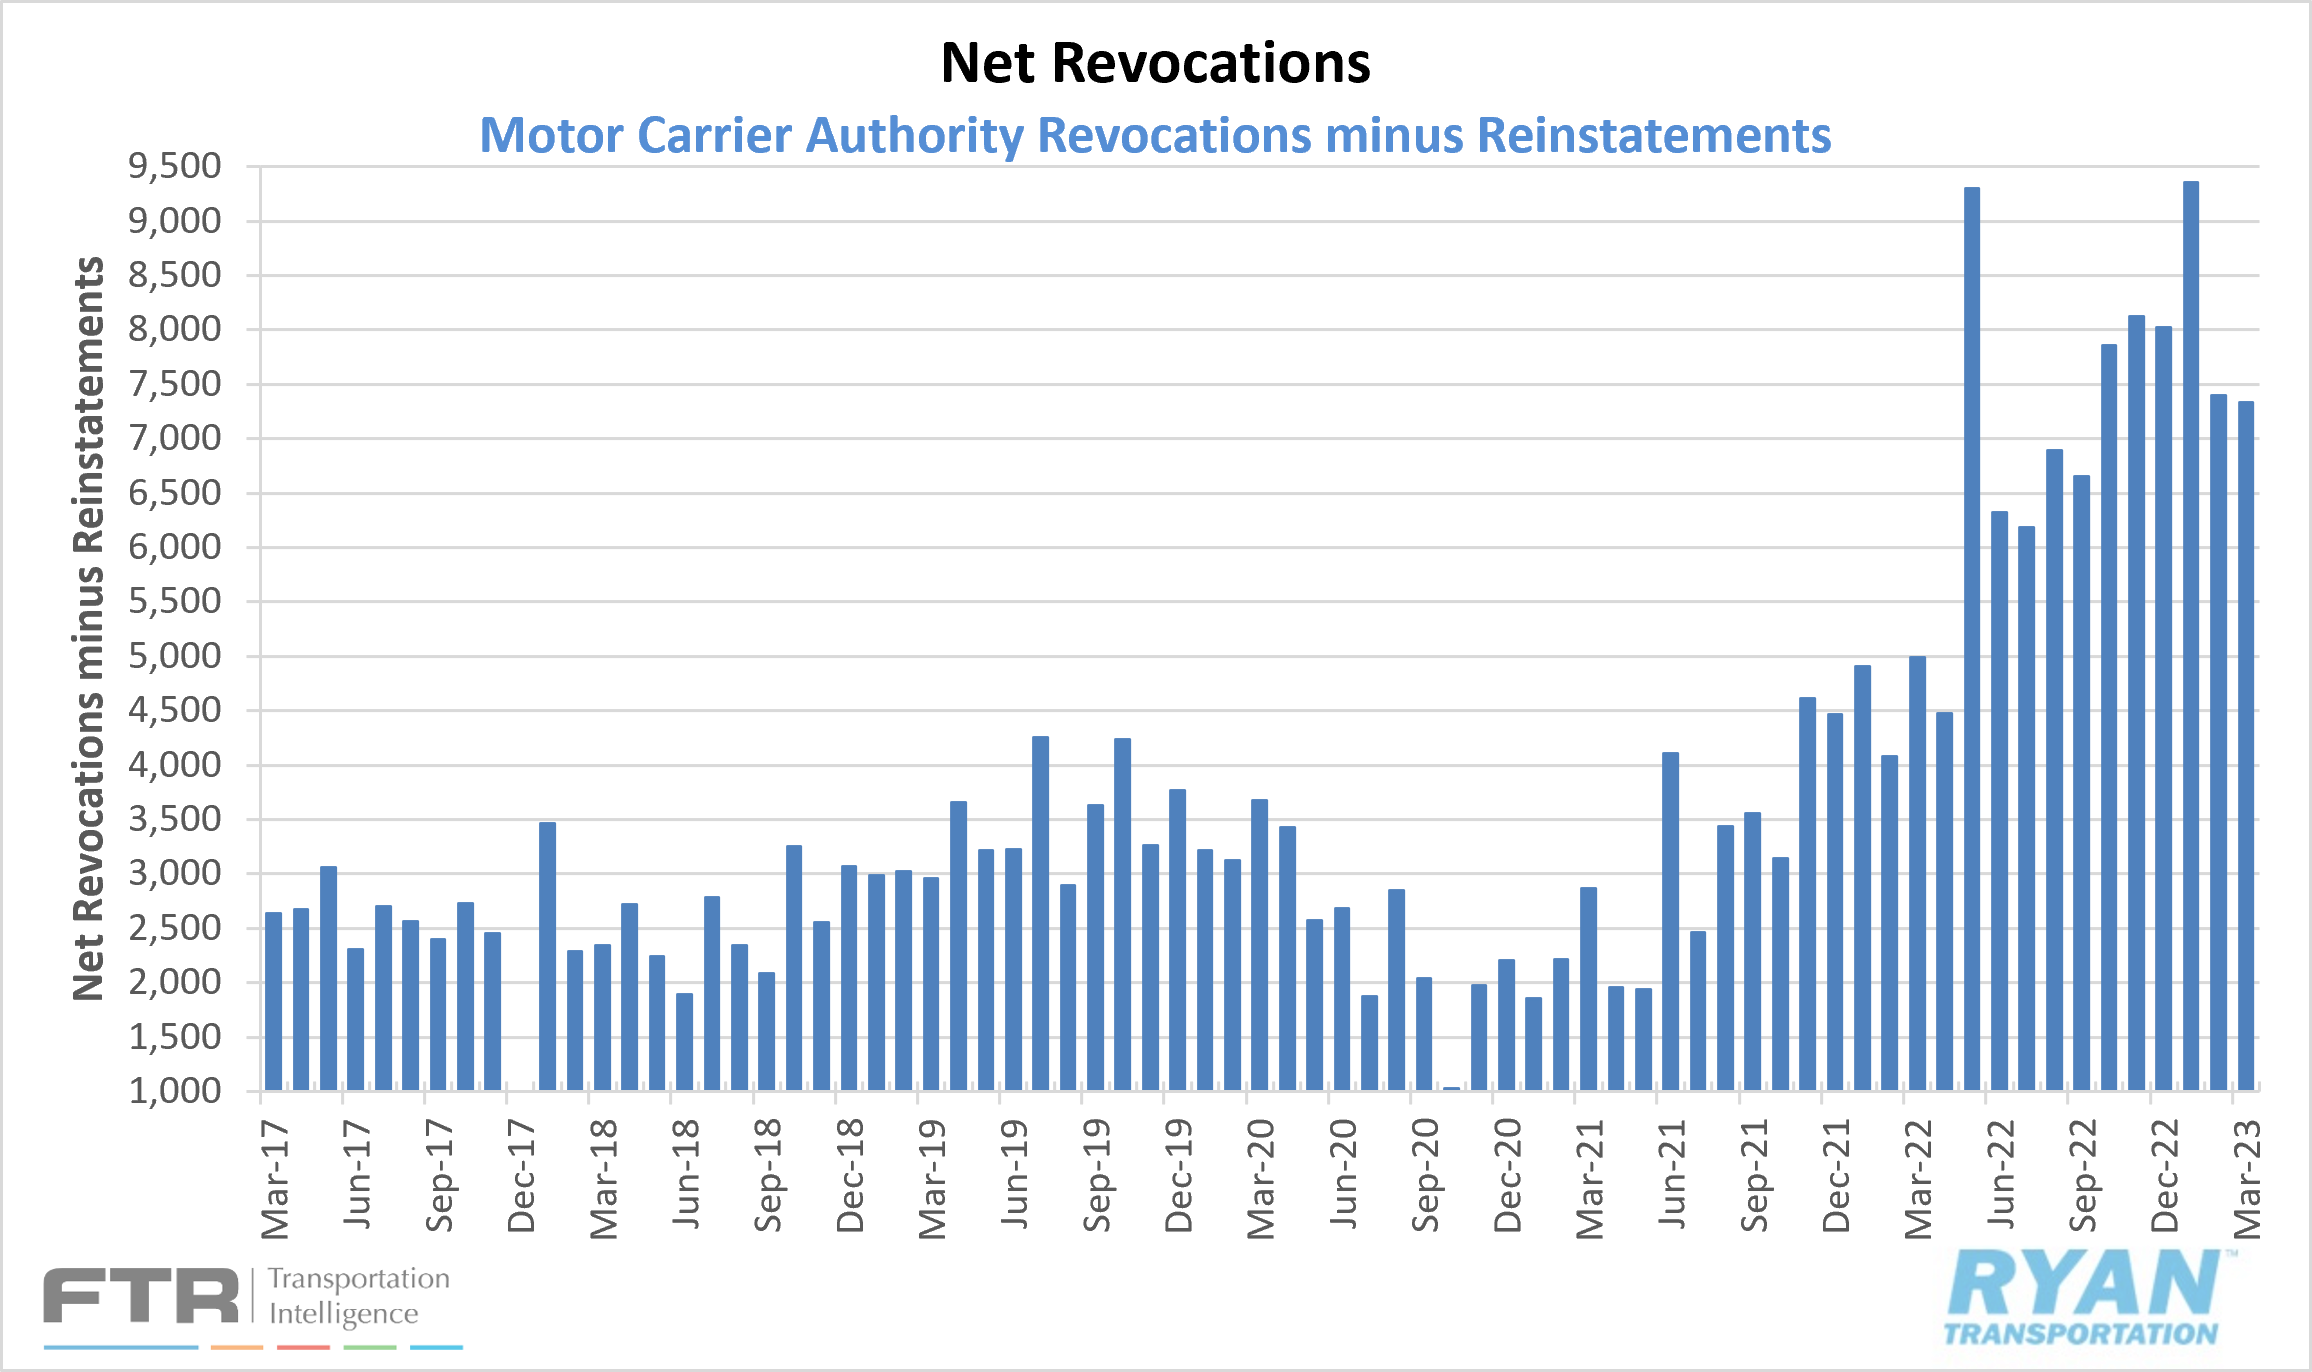
- FTRs preliminary analysis of the Federal Motor Carrier Safety Administration (FMCSA) data indicates net revocations, which are revocations of operating authority minus reinstatements, totaled 7,336 in March, registering 57 lower than February's total.
- Newly authorized for-hire trucking companies increased for the second consecutive month in March, totaling 7,478, the highest since September of last year and nearly 1,200 more than February, according to FTR.
- Preliminary Class 8 orders fell in March to 19,000, a 16.7% decrease in order activity from the month prior and 10.6% decrease from the same time last year according to FTR.
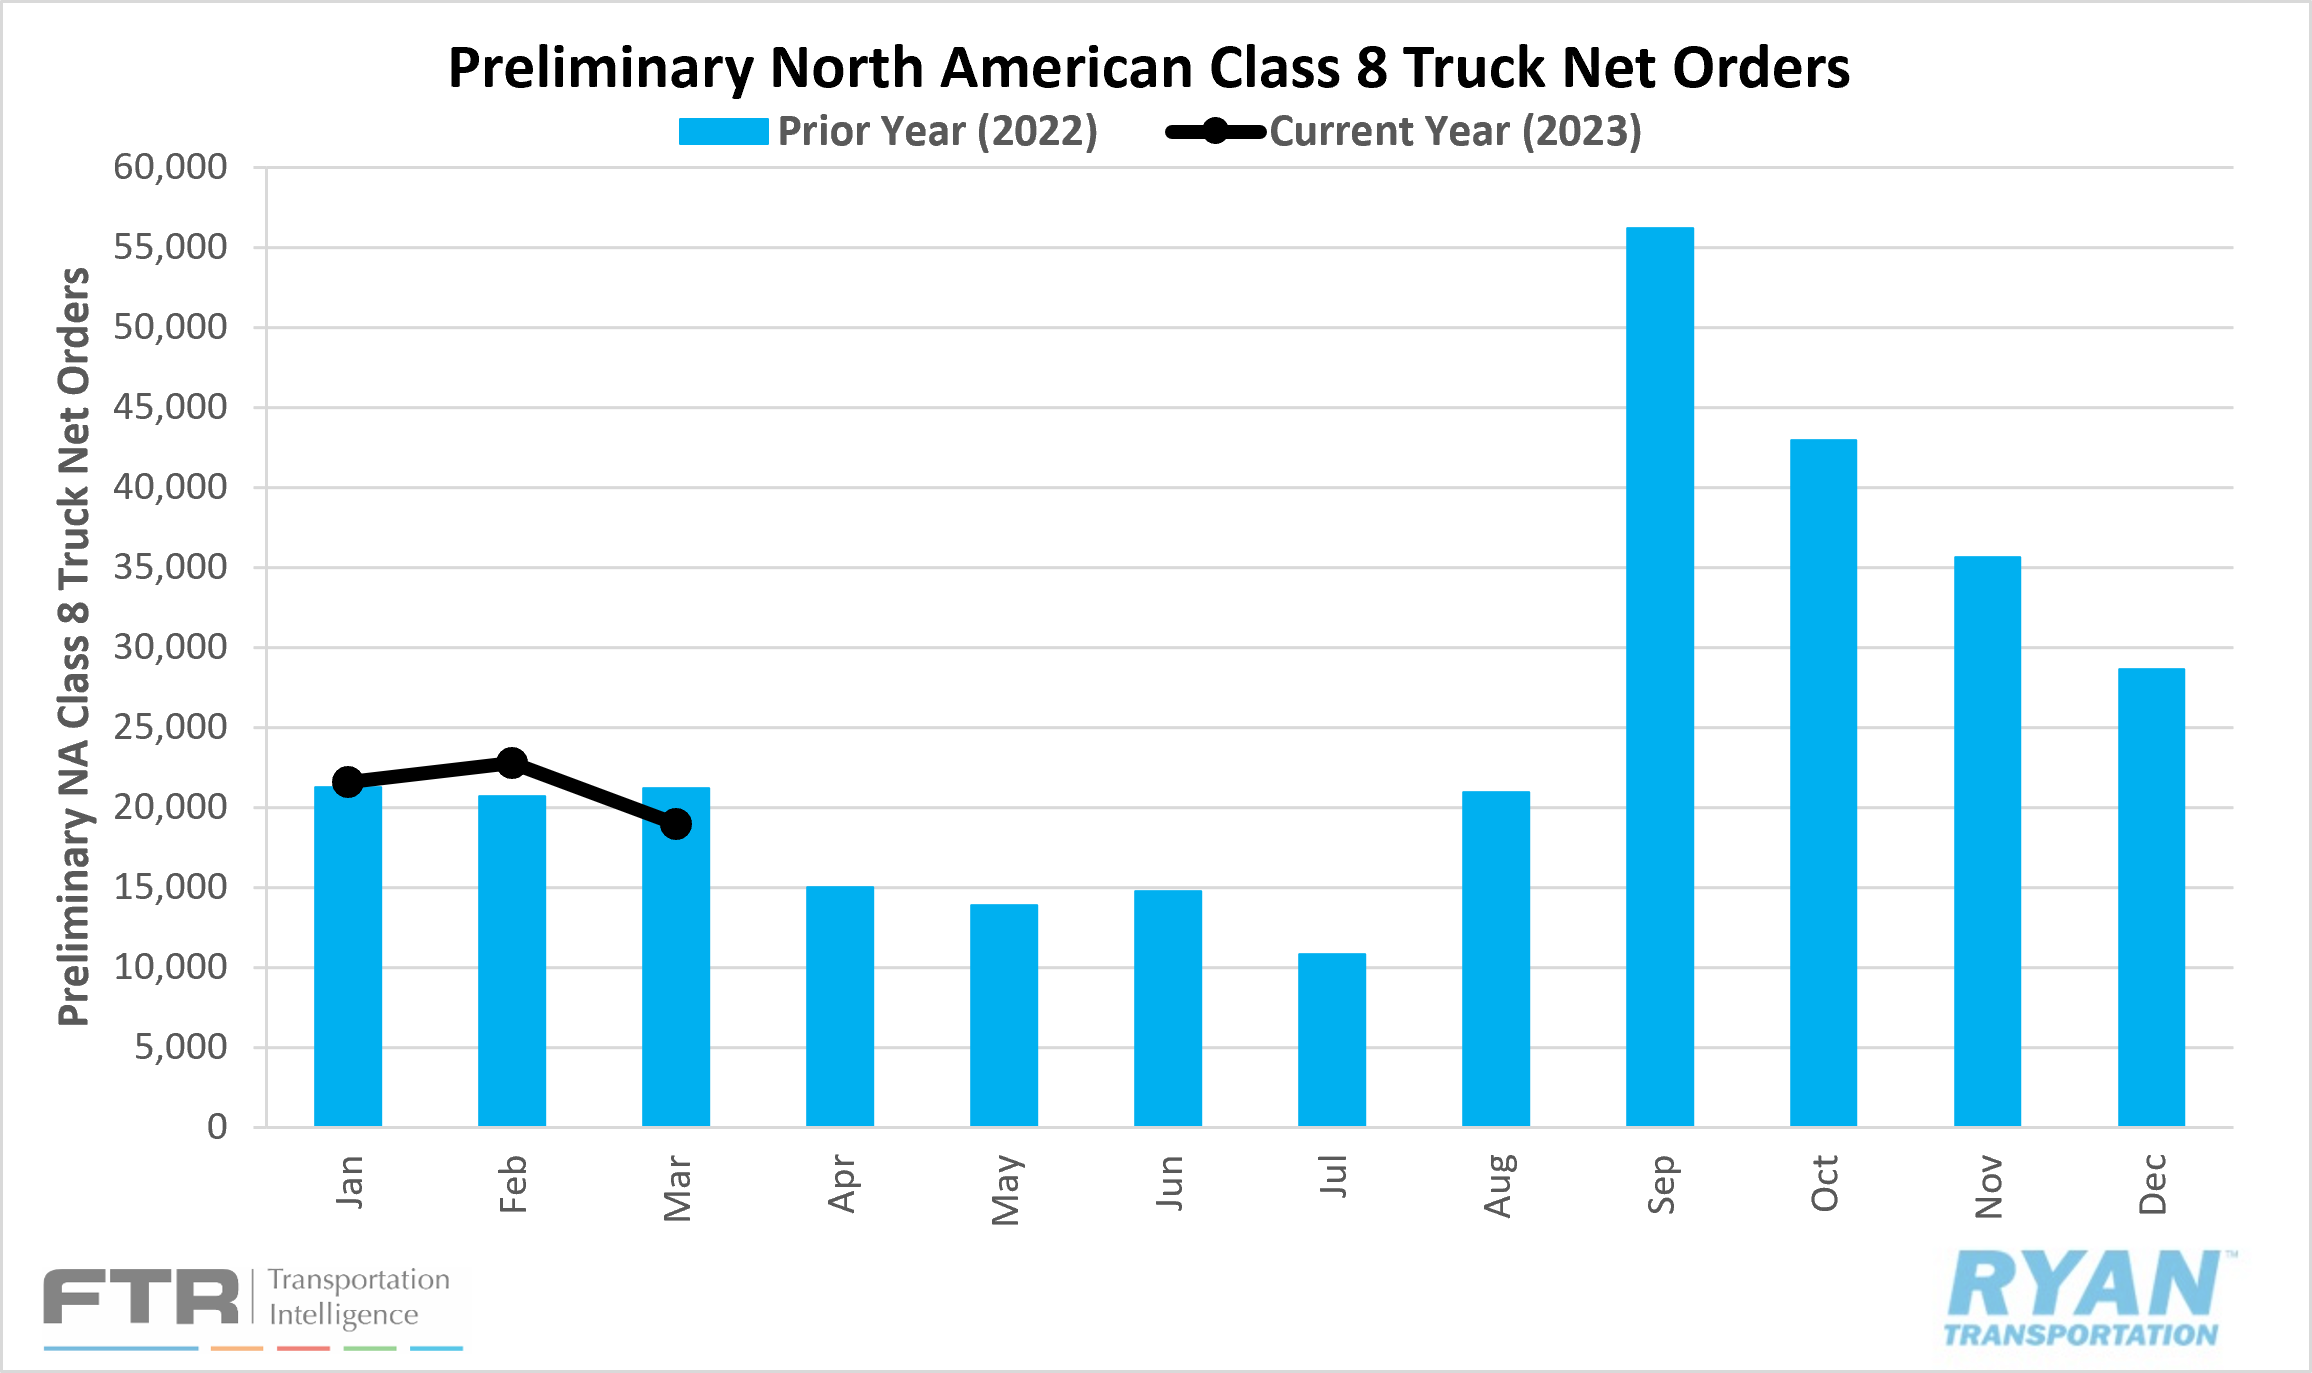
Summary
After five consecutive months of declines, the most since the Great Recession according to FTR, the net change in the carrier population grew by 142 carriers in March. Based on the current market conditions, the growth is surprising and there isn’t one clear explanation to tie directly back to it. A few theories cite falling used truck prices, though they’re still much higher than before the pandemic, and improved technology across freight platforms that improve operations for smaller fleets. Another major factor, according to FTR, is the enforcement of AB5 in California, as the state accounted for just over 12% of new carriers nationwide in March.
Fuel Prices
Key Points
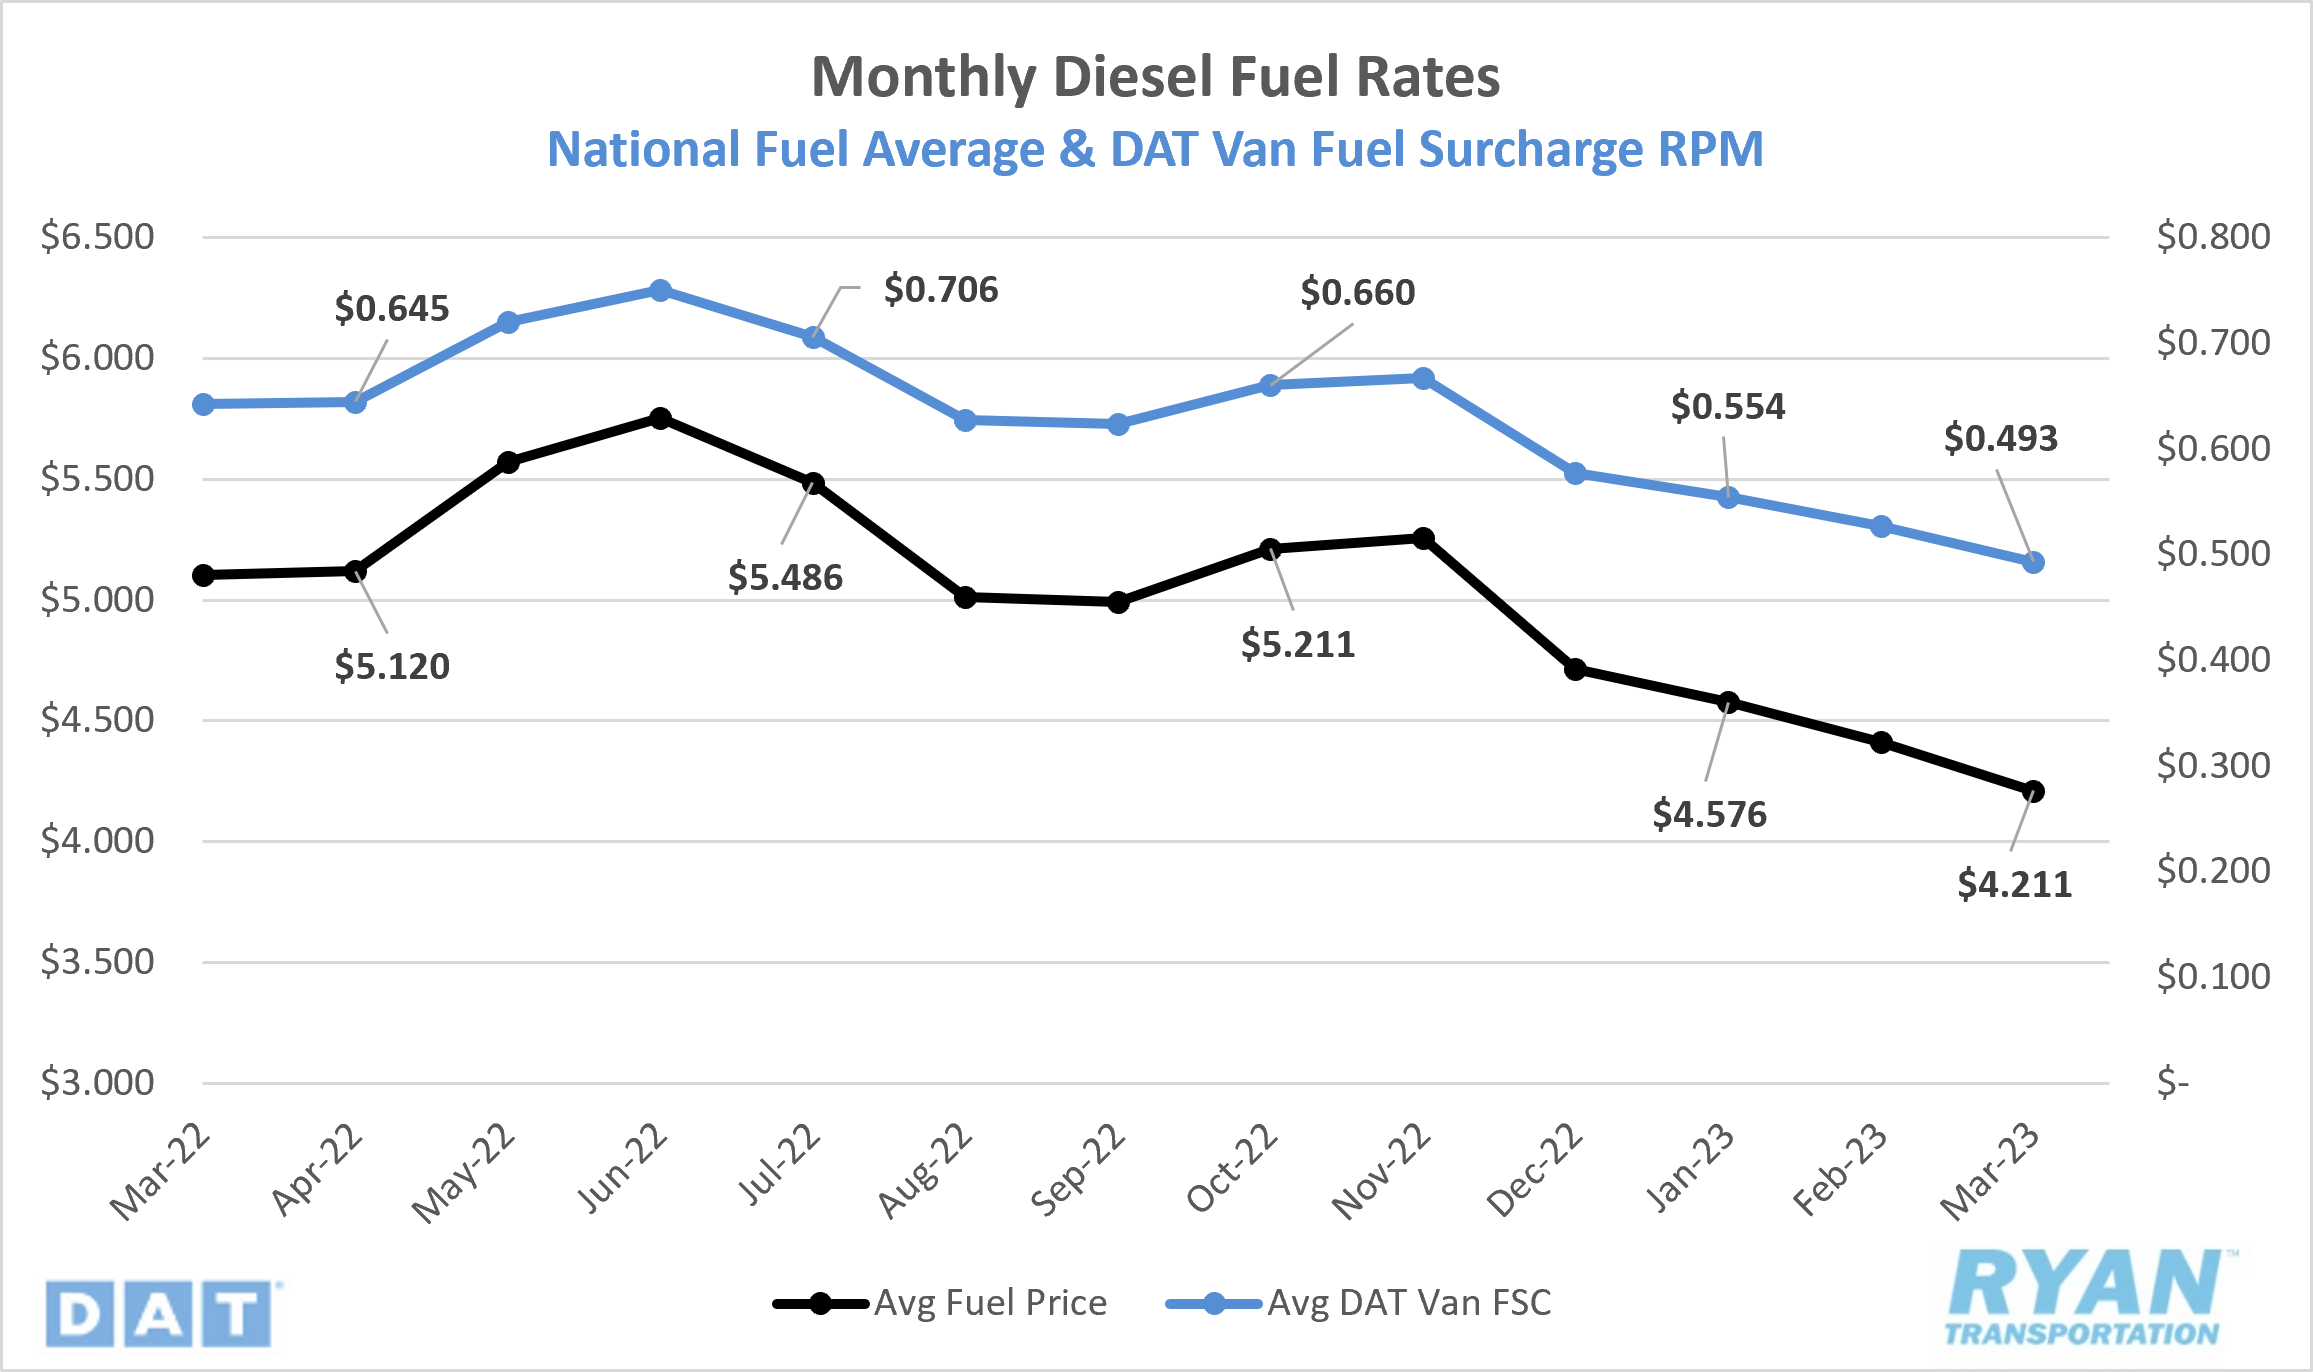
- The national fuel price average has now sequentially declined for nine straight weeks since the last week of January, ending the month -$0.177, or 4.1% down from where it started in March.
- The 4.6% MoM decrease makes March the fifth consecutive month of declines in fuel prices, however, it is the first month since the Russian invasion of Ukraine that fuel prices have been below YoY levels, ending the month 17.5% below March 2022 prices.
- Crude inventories dropped by 8.5M barrels vs. the -5.6M consensus between the weeks ending March 10 and March 31, according to EIA reports.
Summary
After setting record-level highs over the last 12 months, the national average fuel price YoY levels have finally turned negative. The uncertainty of supply levels that drove demand to never-before-seen levels has been tamed after crude inventory growth outpaced expectations 4-to-1 in February. The continued decline in prices appears to have sparked demand again as crude draws in March outpaced expectations. On the global demand level, several OPEC+ countries announced further cuts to production levels, totaling roughly 1.16M barrels per day (bpd) starting in May and lasting through the end of 2023. This is the second cut to production levels announced by OPEC+, the first being in October of last year, which now brings their total reduction to roughly 3.66M bpd for 2023. Following the announcement, Russia confirmed they will continue the approximate 500k bpd output reduction through the end of 2023 that went into effect in February. Oil price futures surged following the announcement from OPEC+, with several Wall Street analysts increasing their price per barrel benchmark forecasts to just under $100/bbl by the end of this year.
Why it Matters: OPEC+ has significantly more pricing power now, relative to the past, so the reduction in global supply can be viewed as a strategy to drive up the price of oil in the near term. However, the uncertainty of supply levels remains muted, indicating the market is nowhere near the $100/bbl price point and likely won’t be for some time. According to Morgan Stanley analysts, who actually dropped their Q3 and Q4 benchmark forecasts for 2023, the recent announcement by OPEC+ reveals a weak outlook for demand in the global oil market. On the opposite side of the argument, there still remains the potential that a floor has been reached or is nearing. As China's economy continues to recover and with Saudi Arabia’s recent price increase on exports to Asian countries, there is still a scenario at play for global prices to surge, especially as we enter the warmer driving months.
Dry Van Overview
Spot Rates
Key Points
- The national average dry van spot rate excl. fuel surcharge ended February at $1.677/mile, a 3.2% decline from February.
- Van spot rates declined 30.3% YoY in March and remain 13.0% below the 5-year average.
Load-to-Truck Ratio
Key Points
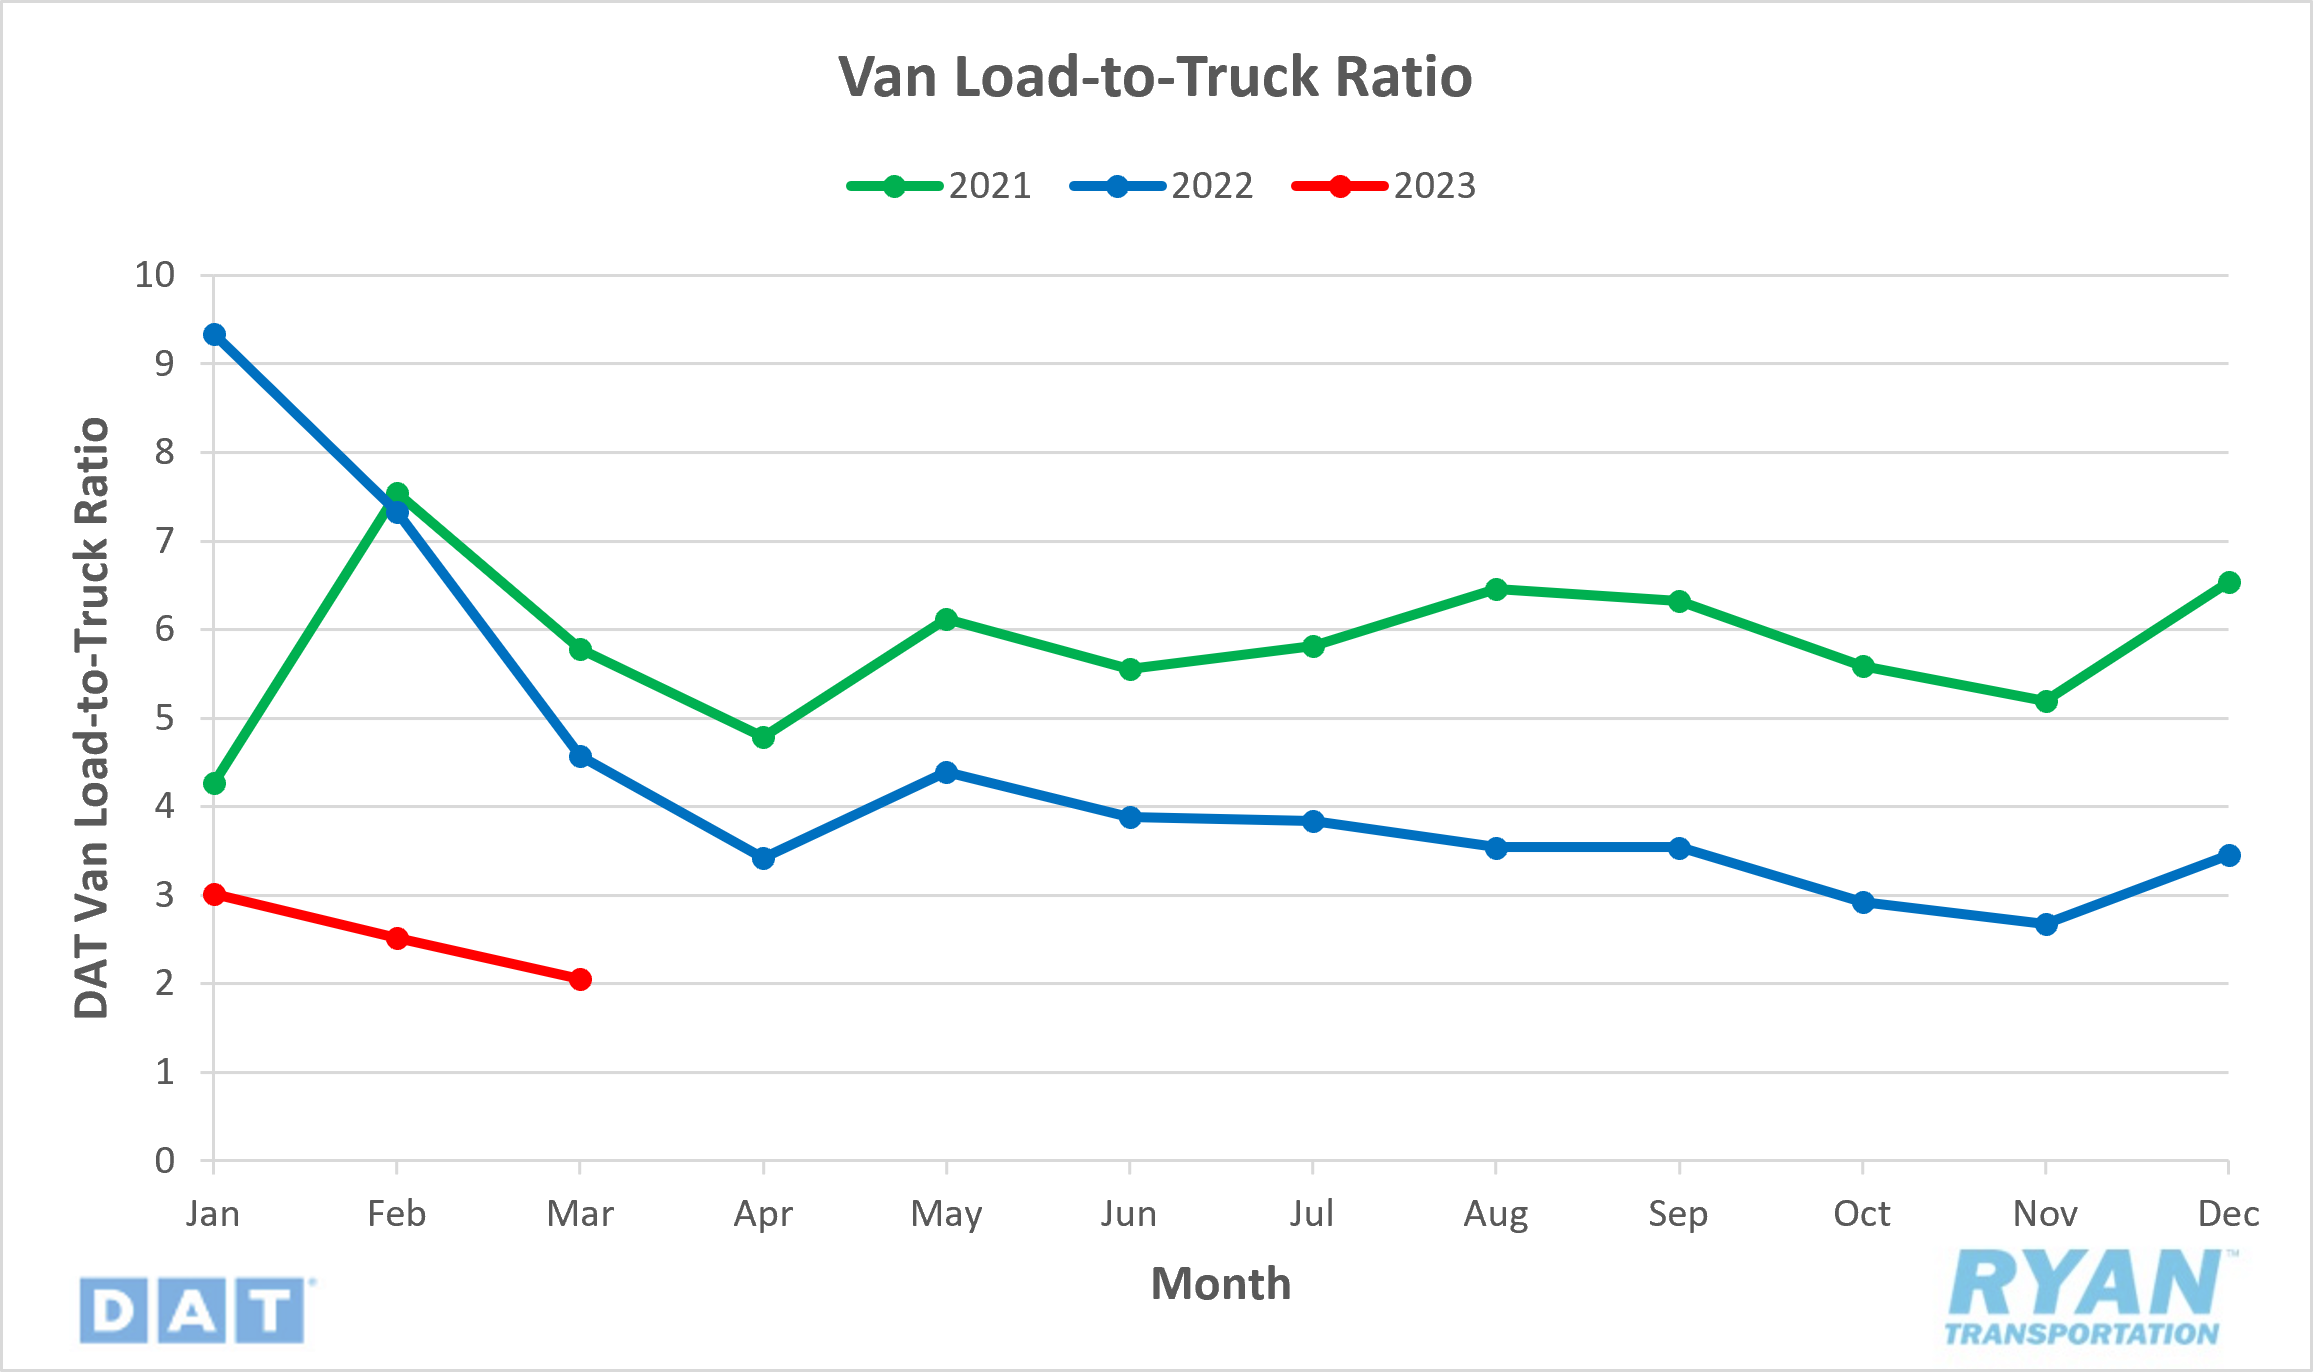
- The Dry Van Load-to-Truck ratio dropped 18.7% MoM in March and was down 55.1% from the same time last year.
Market Conditions
Dry Van Summary
Dry van spot rates for the last week of March have now fallen just more than $0.47 or -23.3% from where they started the year. The dry van market continues to drive the declines for both rates and volumes, as it accounts for roughly 60 - 70% of all truckload volume moved across the three major modes. While the roughly 55% YoY decline in dry van volumes was the least impacted across the three major modes in March, it is also the least impacted on a seasonally-adjusted basis as the refrigerated or flatbed markets are this time of year.
Reefer Overview
Spot Rates
Key Points
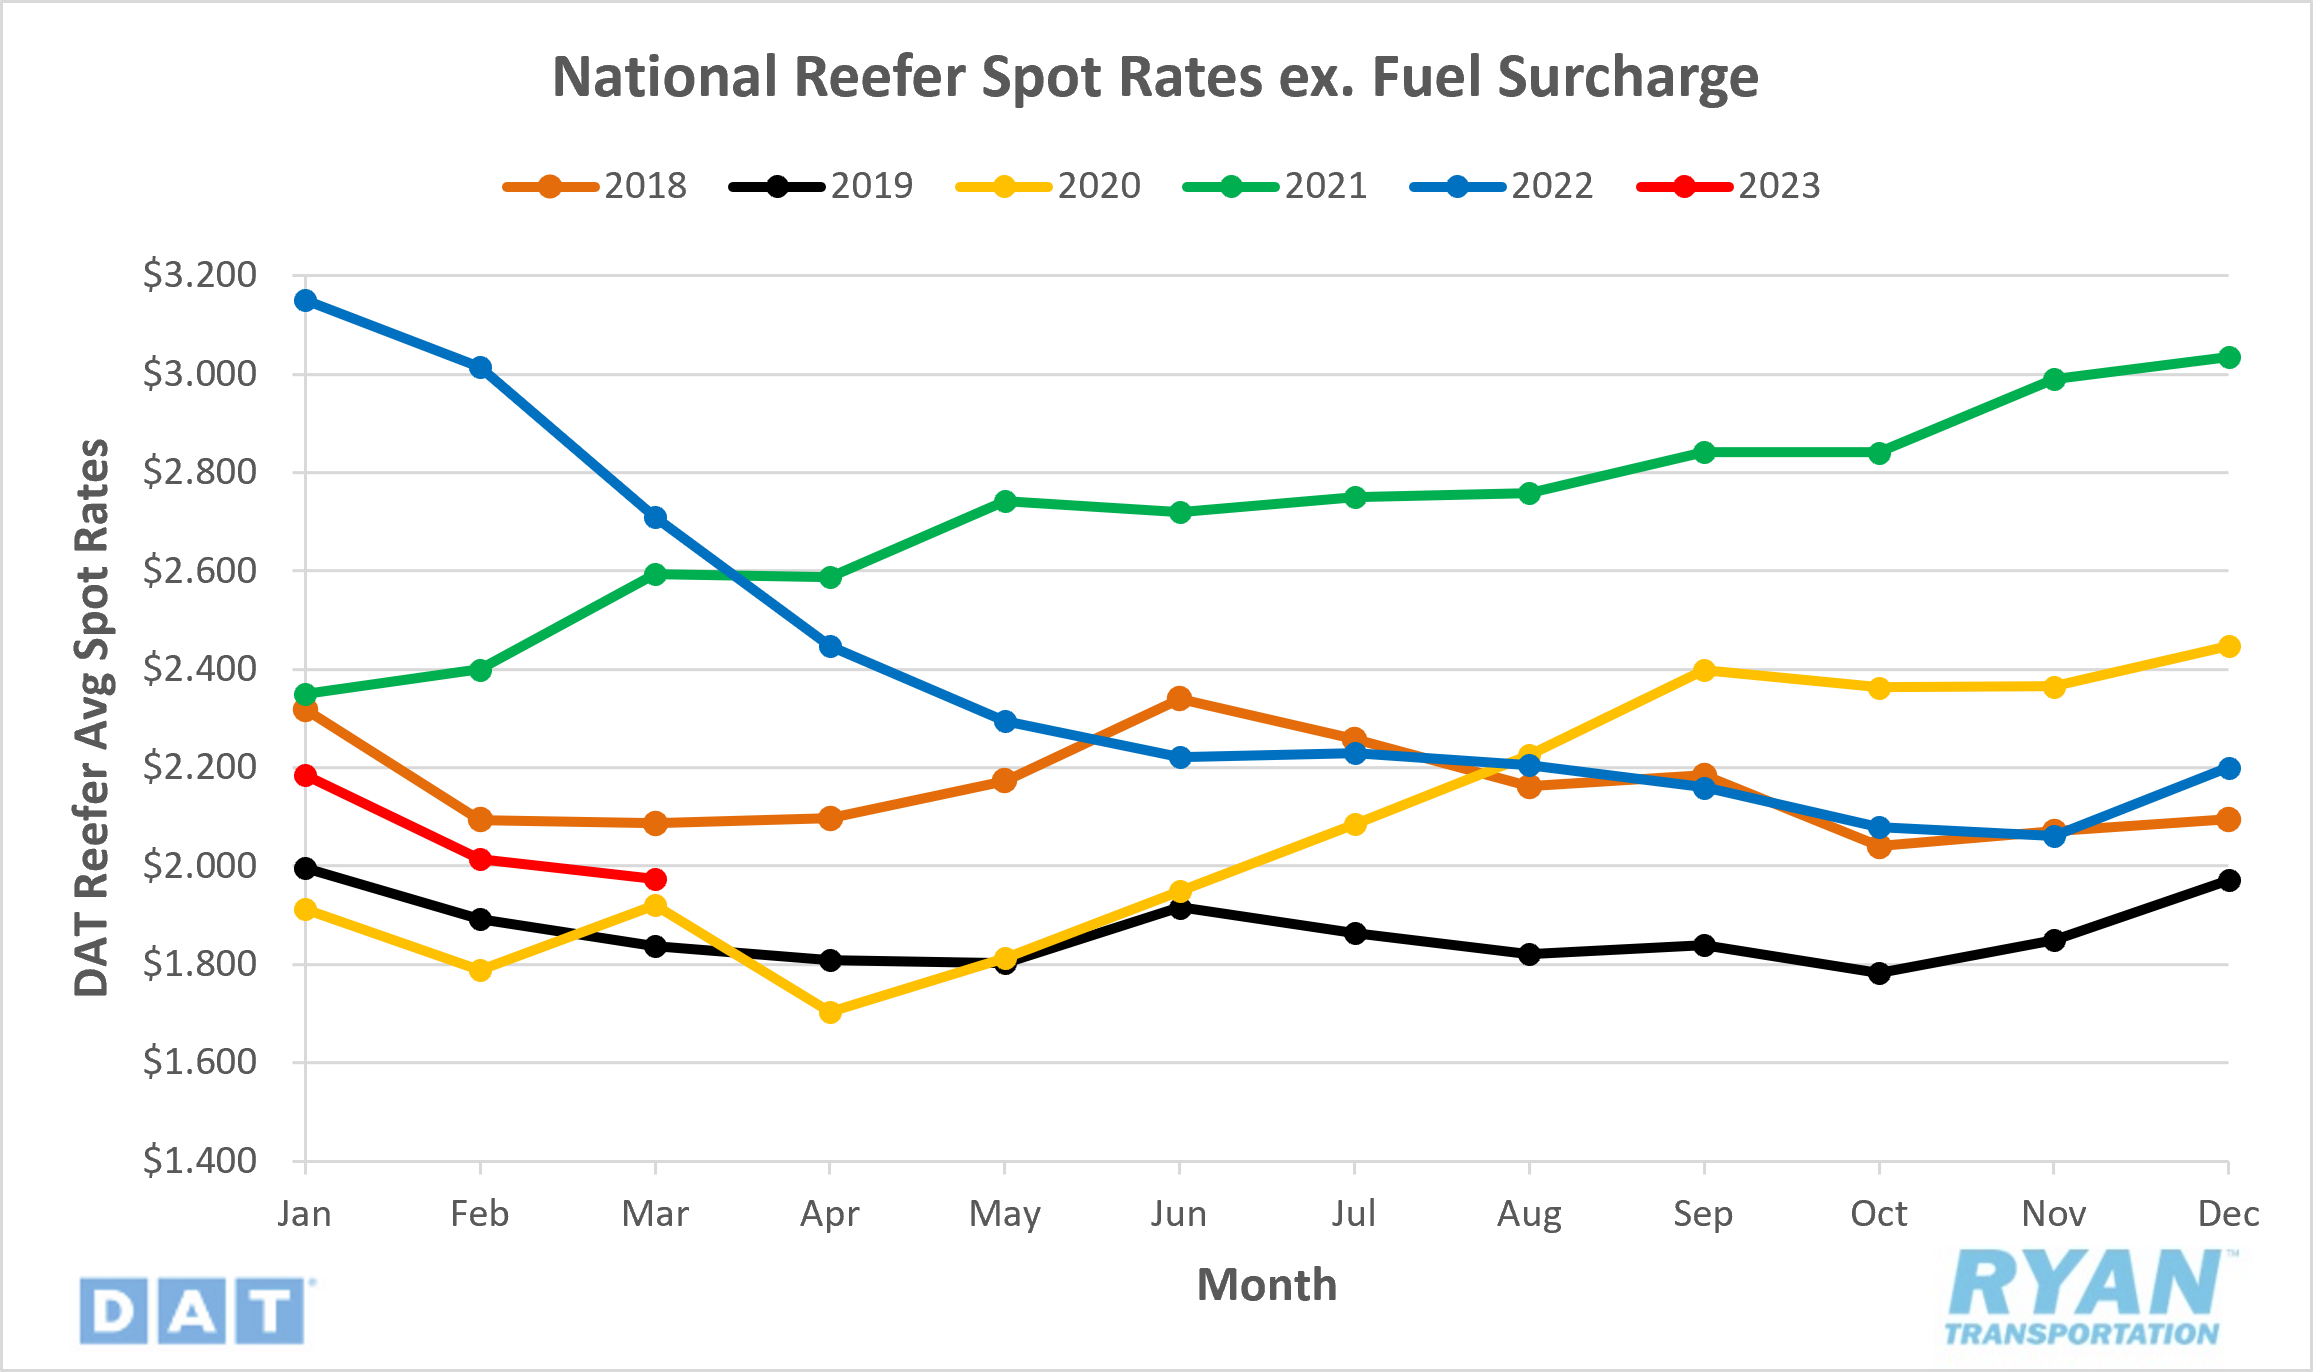
- The national average reefer spot rate excl. fuel surcharge in March was $1.975, falling 2.0% from the previous month.
- Reefer rates in March were 27.1% below 2022 levels and 11.9% below the 5-year average.
Load-to-Truck Ratio
Key Points
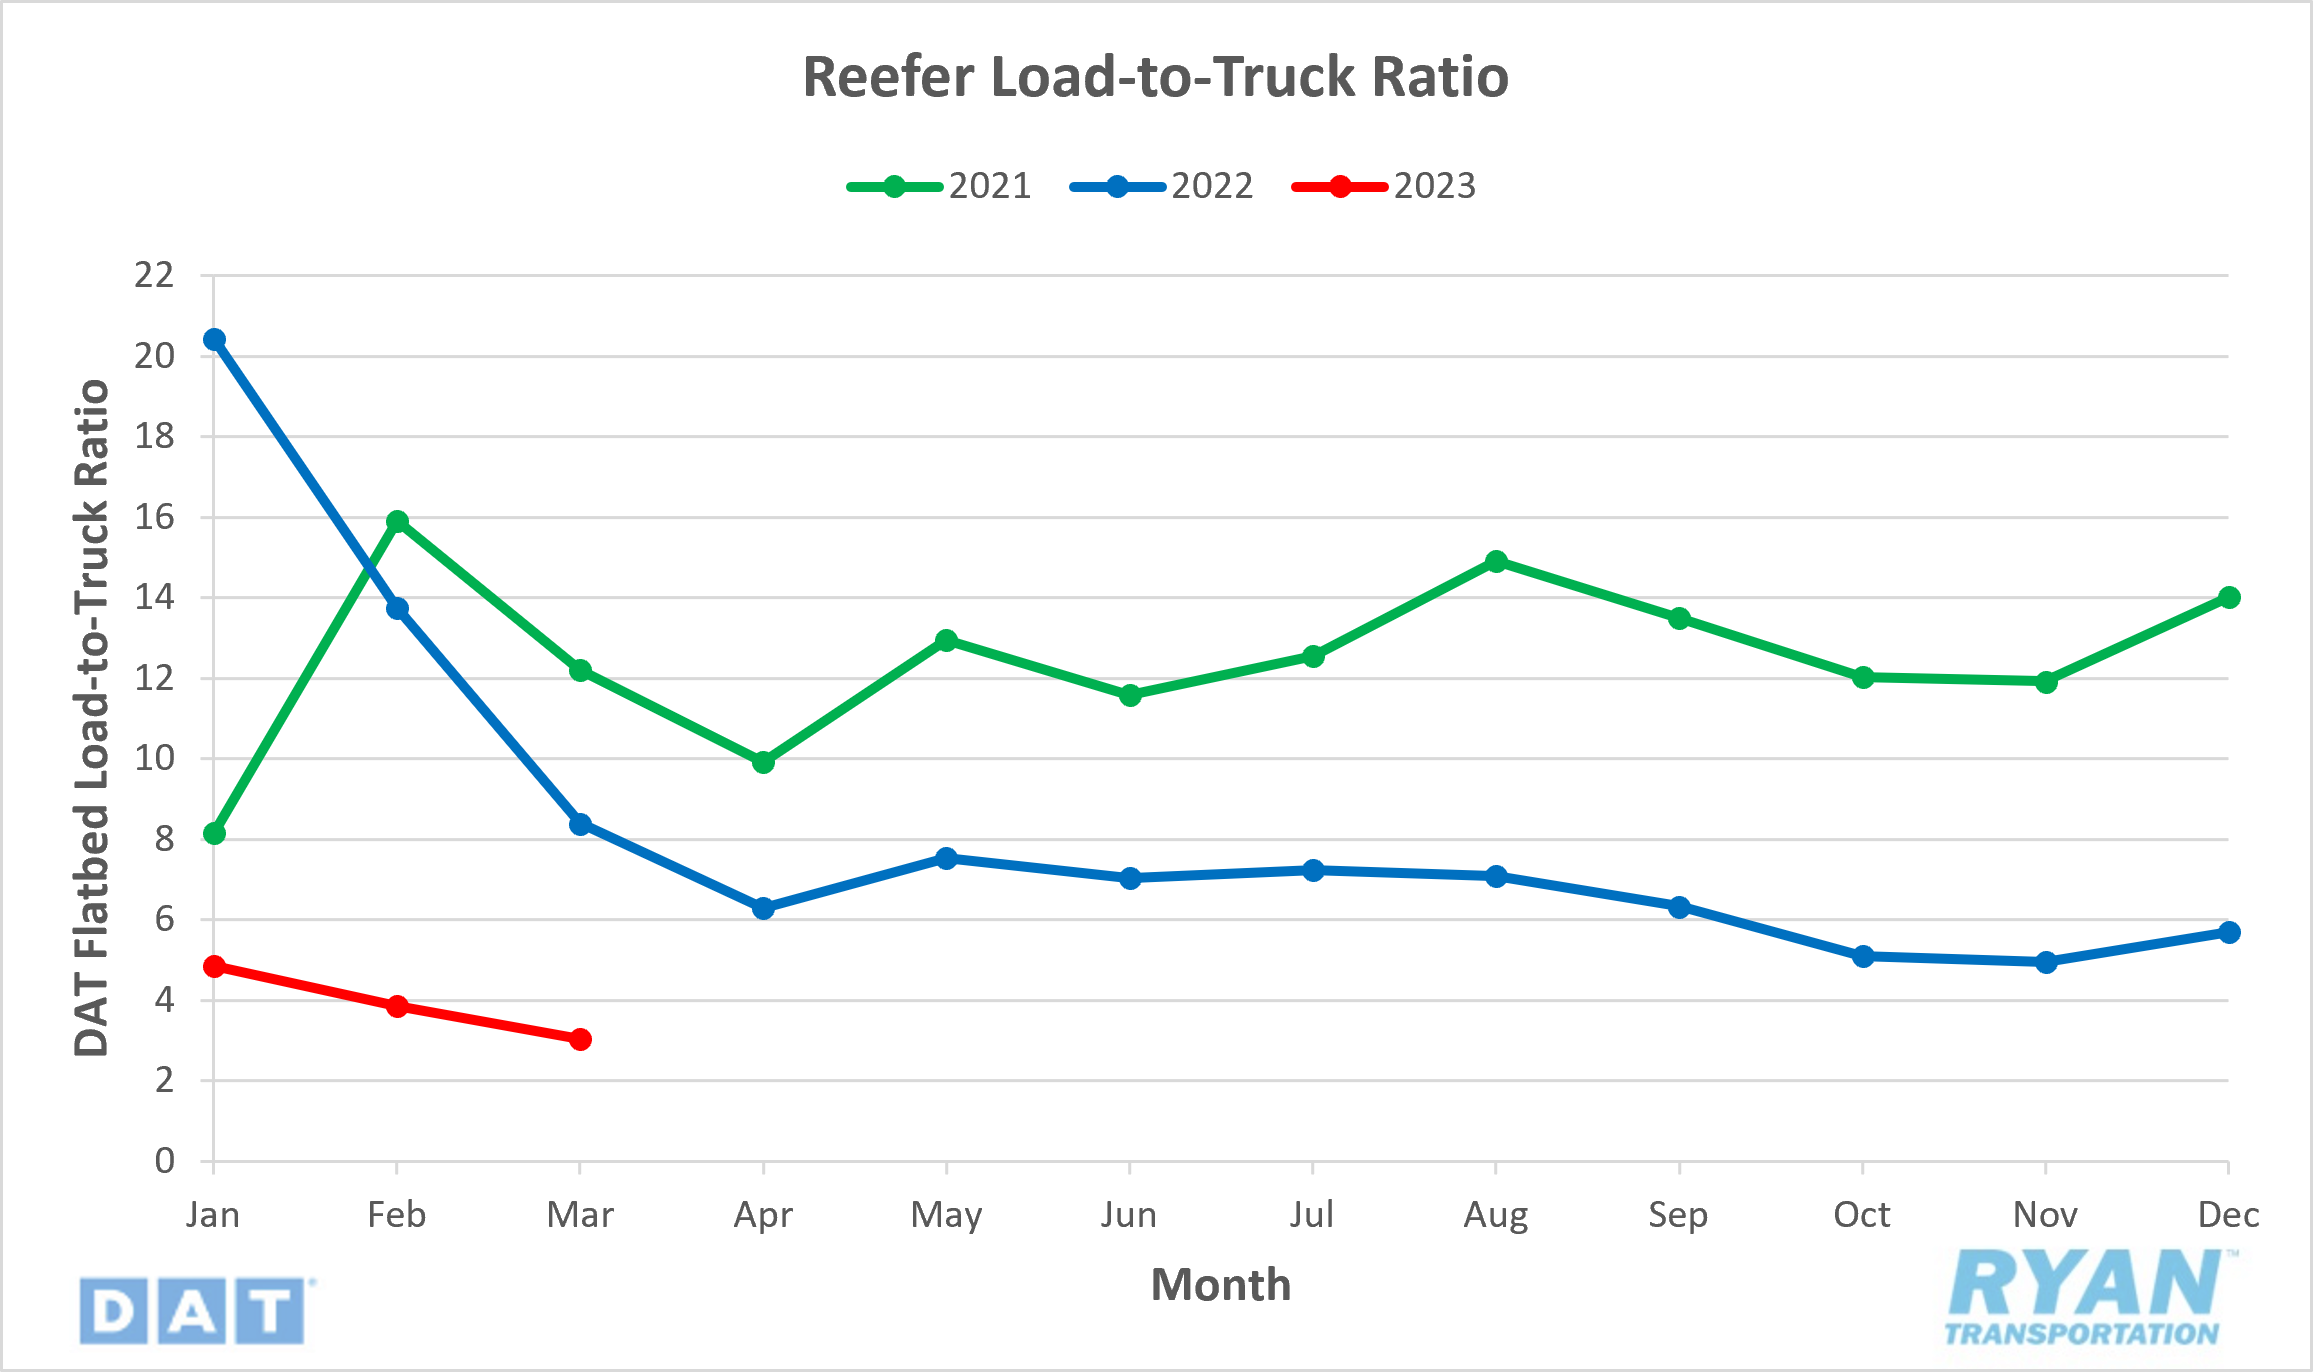
- The reefer load-to-truck ratio fell 21.0% MoM in March and 63.8% below 2022 levels.
Market Conditions
Reefer Summary
The refrigerated market continues to run parallel to the dry van market declines. Refrigerated rates have fallen the most from the highs seen at the start of the year, dropping $0.53 or -21.1% through the last week of March. While the ramp-up of produce shipping does not typically start until April, there is still a significant shift in carrier capacity in the final weeks of March to transport produce to demand-heavy areas, forcing a squeeze in overall rates. With overall volumes retreating to the extent that they have so far this year, the capacity shift in anticipation was not enough to create any positive momentum in relation to rates. While the areas with the highest produce distribution needs will see a tightening in capacity and surge in prices, it is becoming more likely that the added volume typically seen by produce will not be enough to shift overall pricing power back to carriers this season.
Flatbed Overview
Spot Rates
Key Points
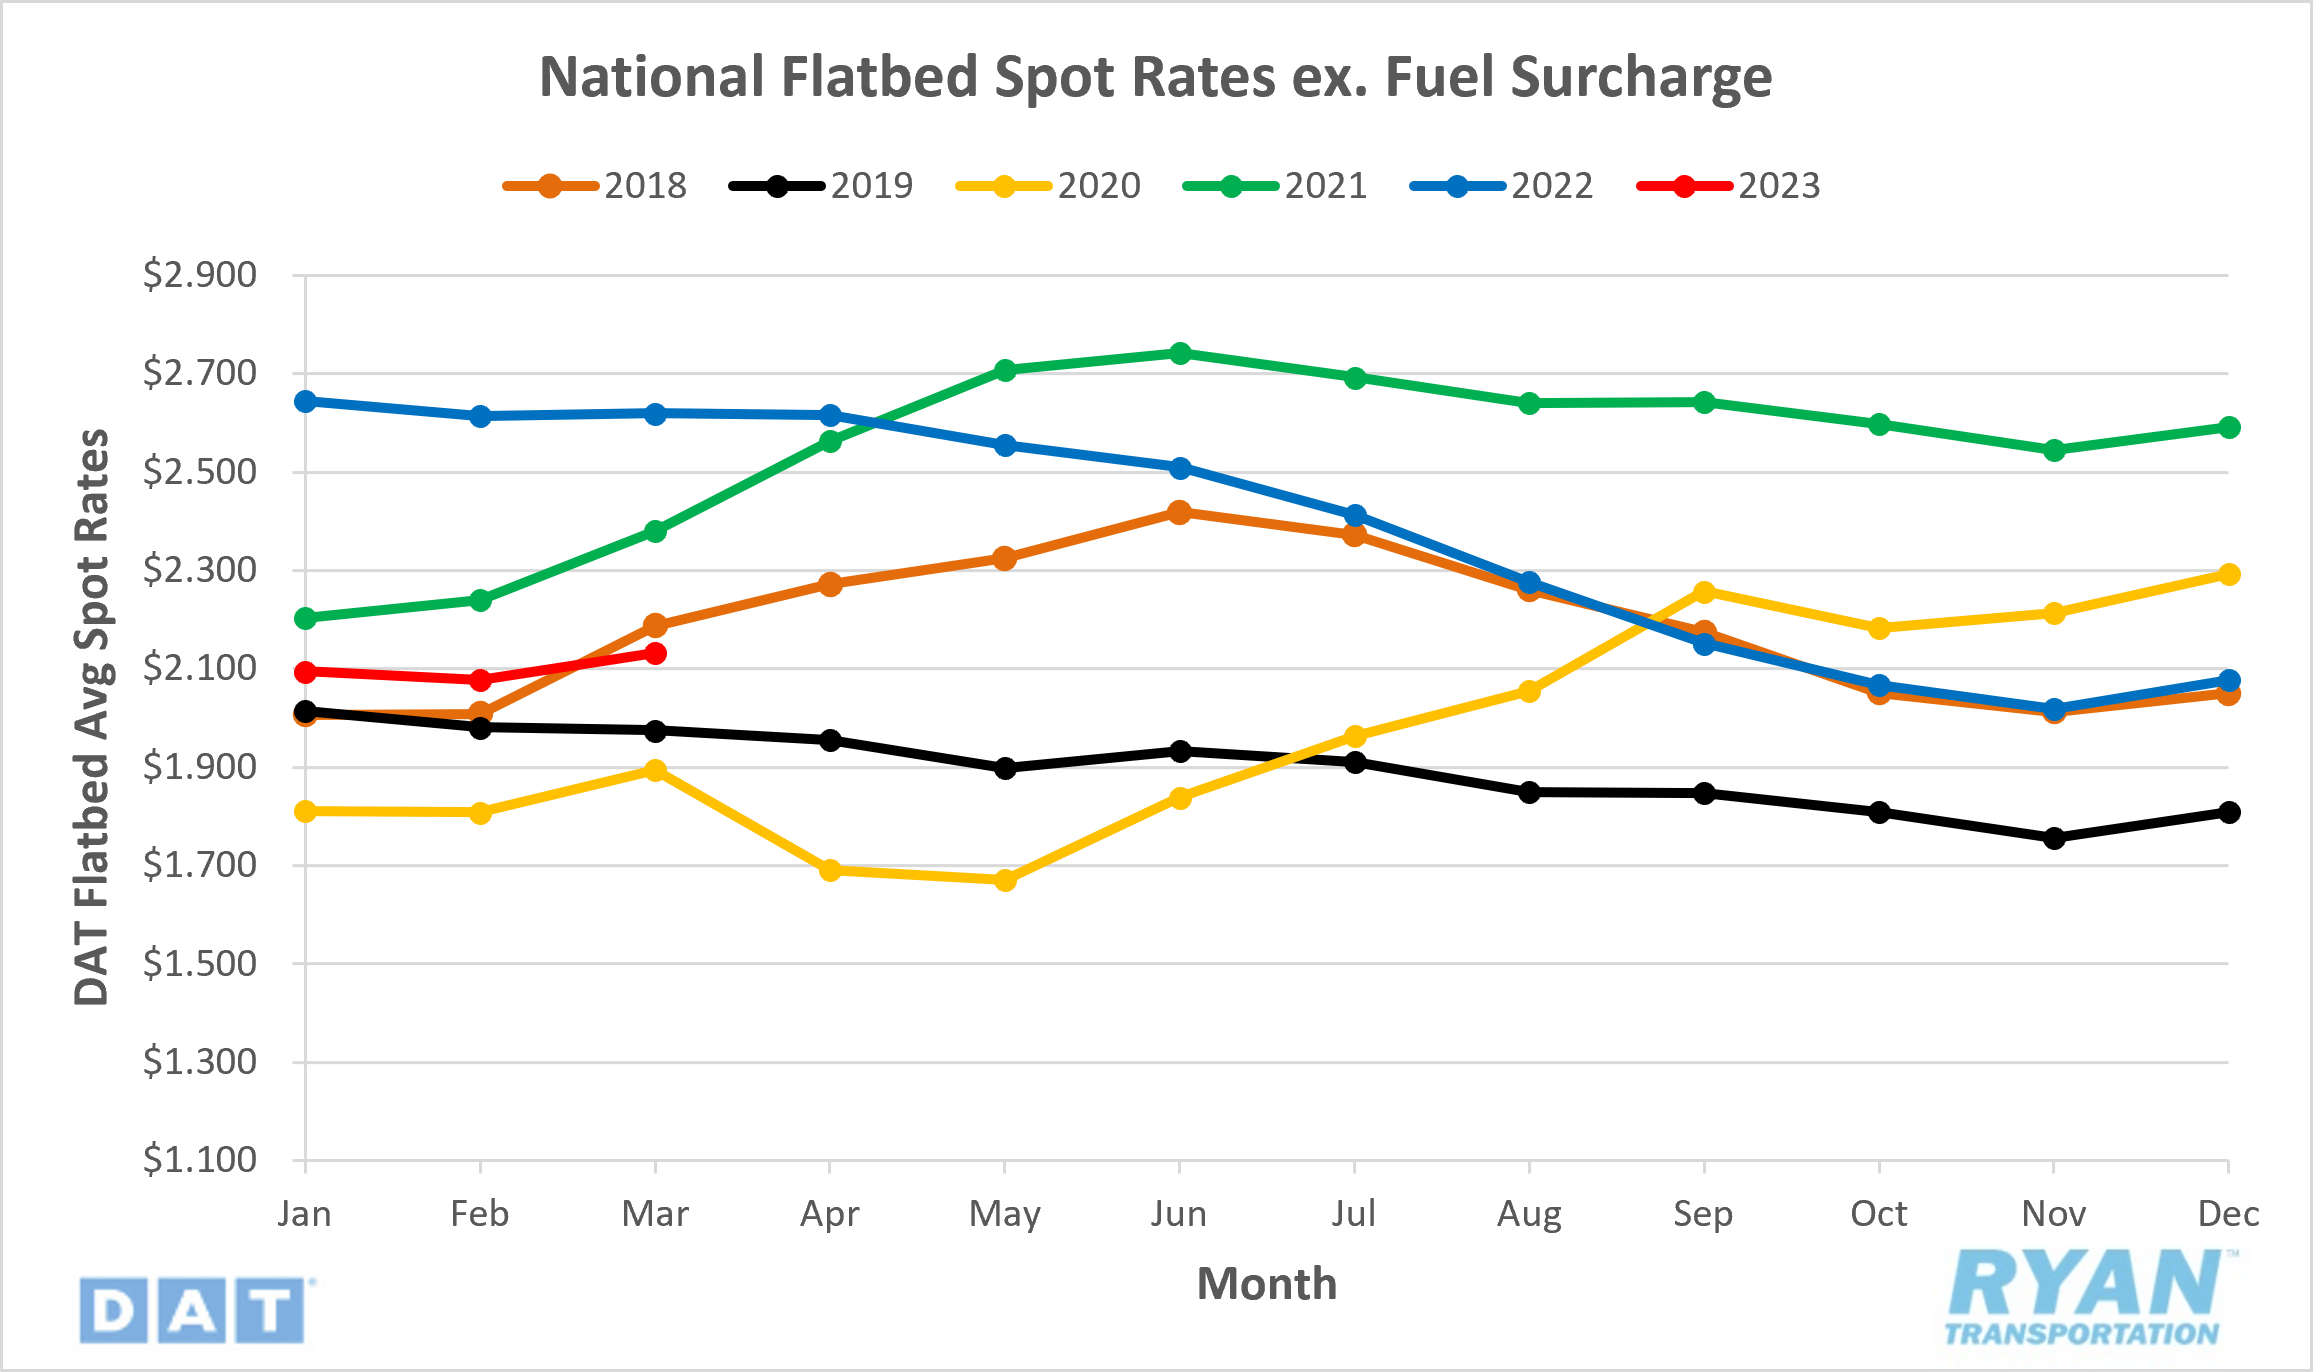
- The national average flatbed spot rate excl. fuel surcharge in March was $2.132, a 2.6% increase from February.
- Flatbed spot rates in March were down 18.6% YoY, sitting just 2.92% below the 5-year average.
Load-to-Truck Ratio
Key Points
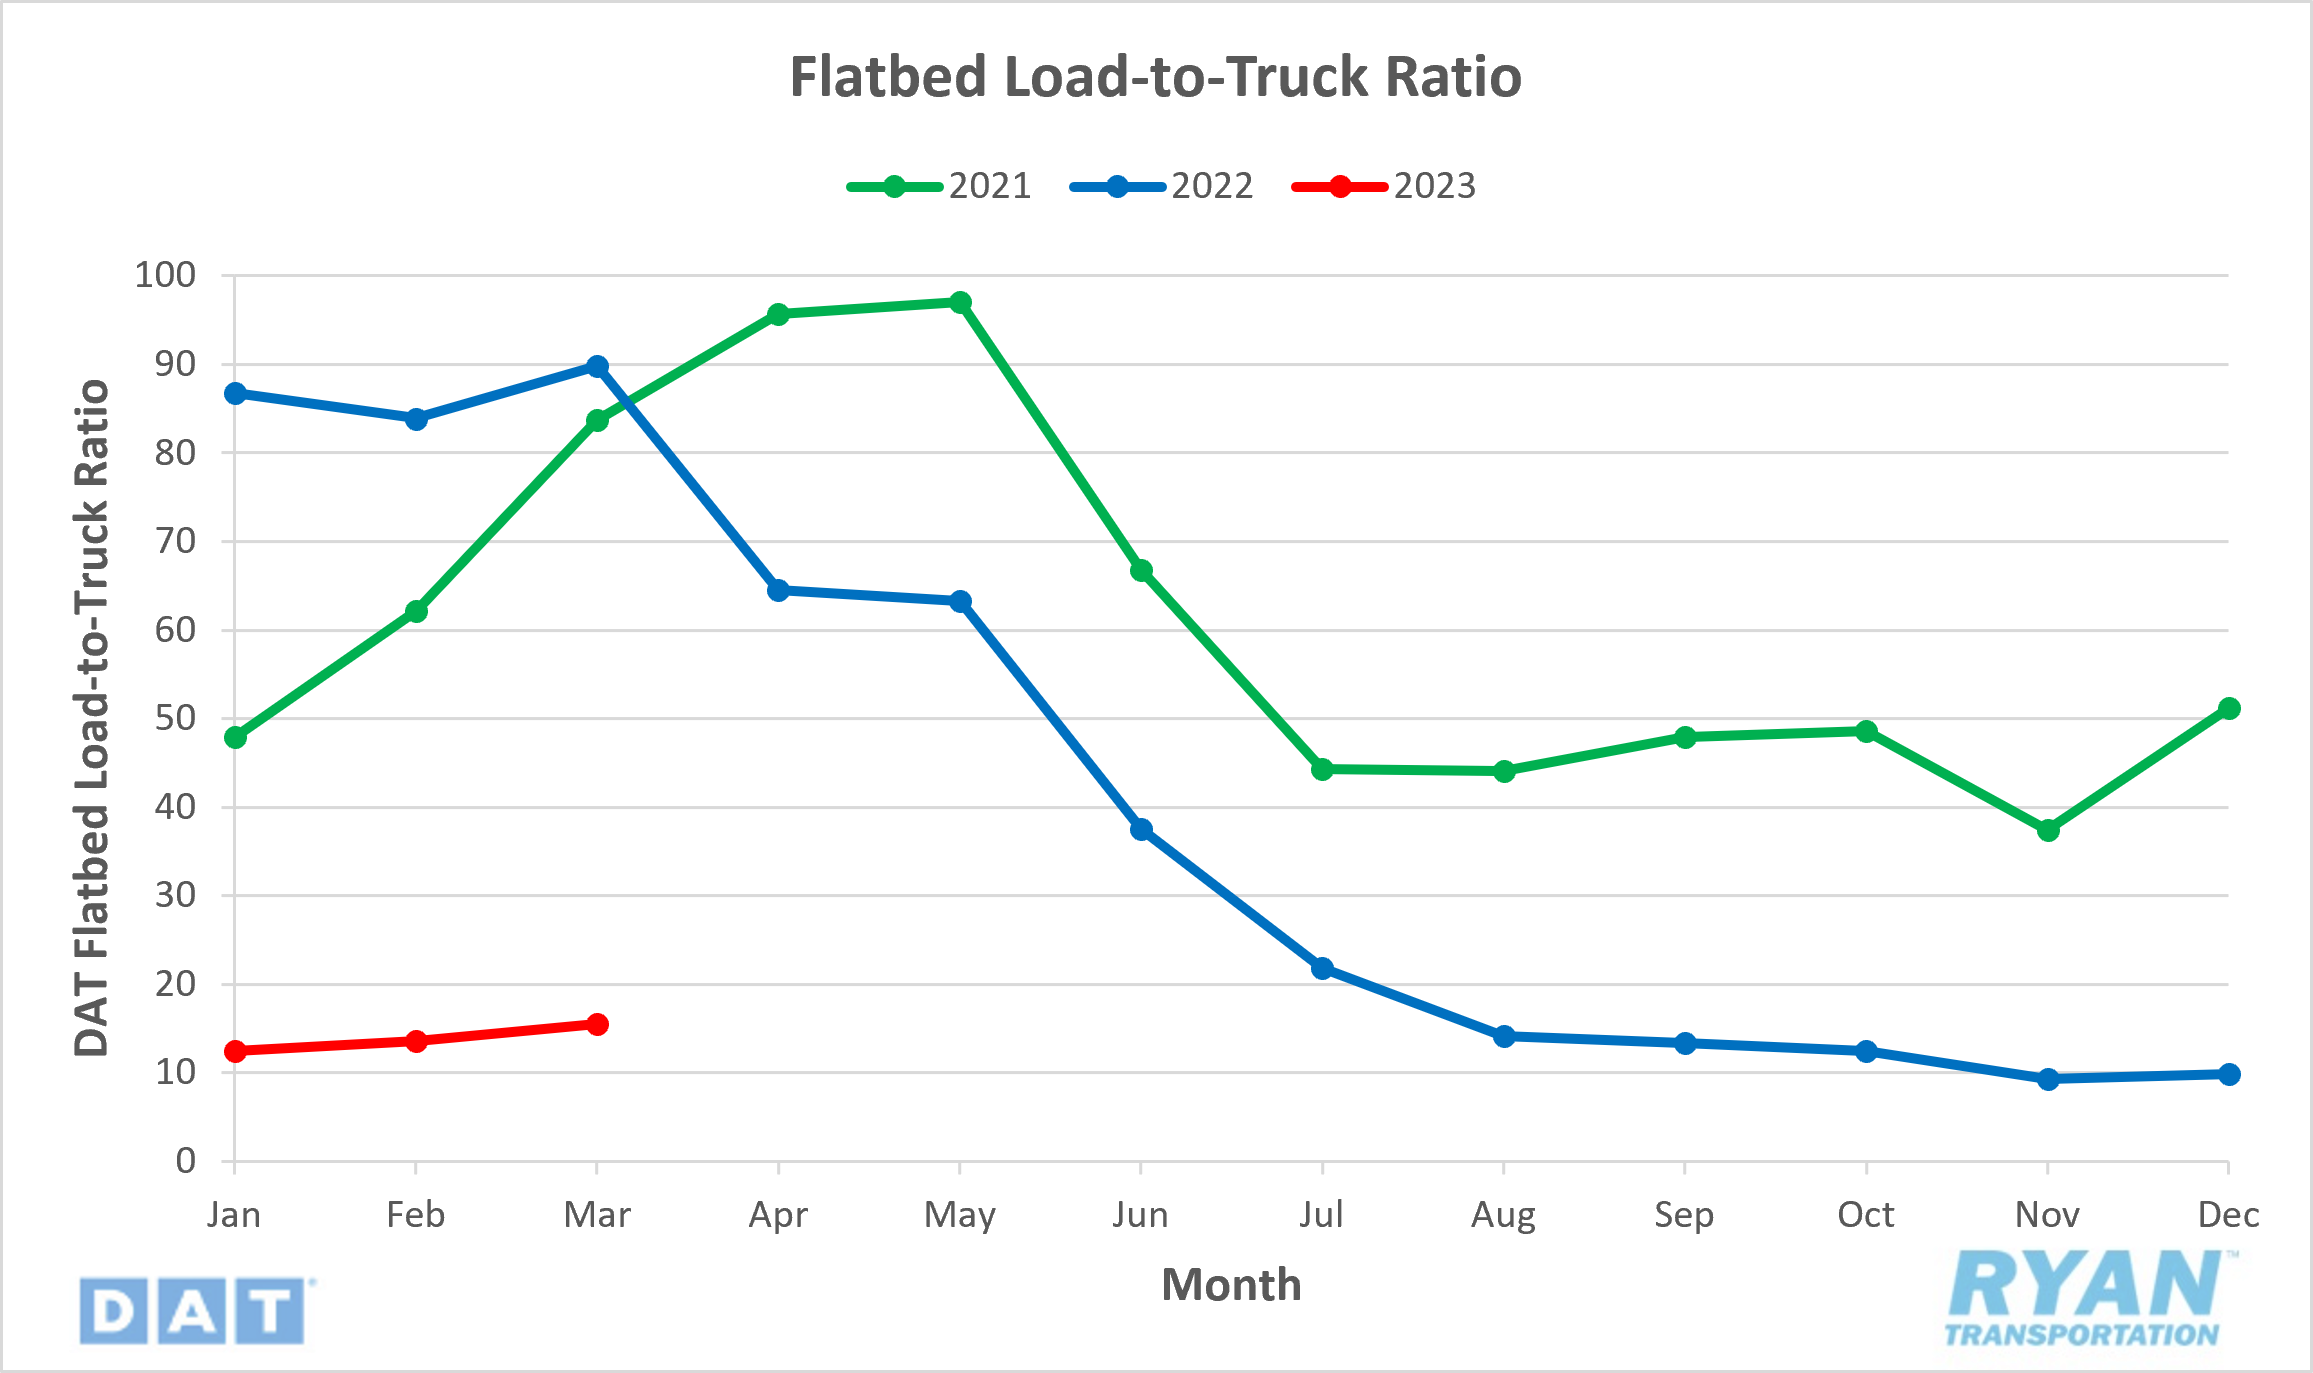
- The flatbed load-to-truck ratio declined 82.8% YoY but saw a MoM increase of 13.7% from February.
Market Conditions
Flatbed Summary
Of the three major truckload modes, the flatbed sector performed the best in March, as activity in the construction and heavy machinery industries is starting to heat up. Flatbed rates were up 2.6% MoM in March as a response to the 13.7% increase in load volumes. Although it underperformed typical seasonality, the flatbed market was the only mode to move in line with what is generally expected this time each year. On a YoY comparison, volume levels performed the worst across all three modes. However, looking back to March of last year when the industry began its downward descent, both the van and refrigerated markets were already showing signs of decline as flatbed volumes saw one final increase thanks to its seasonality. Future building permits and housing starts both saw sharp increases MoM in February, indicating a potential steady increase in demand levels through Q2 and Q3 this year.
Intermodal
Spot Rates
Key Points
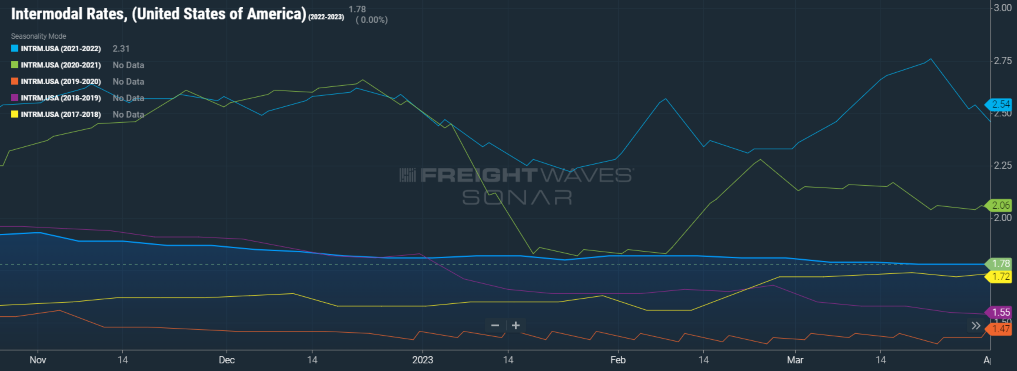
- Freightwaves SONAR Intermodal Rates Index (INTRM.USA), which measures the average weekly all-in, door-to-door intermodal spot rate for 53’ dry vans across a majority of origin-destination pairings, remained flat MoM in March and down 32.3% from the same time last year.
Volumes
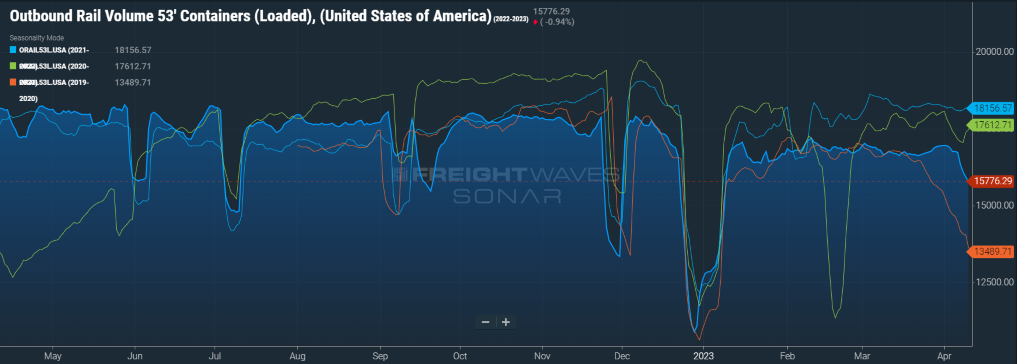
Key Points
- Total loaded volumes for 53’ containers from all domestic markets, measured by Freightwaves SONAR Loaded Outbound Rail Volume Index (ORAIL53L.USA), shows volume levels remaining relatively flat MoM and registering 7.6% below March 2022 levels.
Summary
Intermodal carriers continue to see considerable declines in volumes and steep discounts in rates as demand levels shrink and truckload rates narrow in on the once significant spread between the two. Heading into March, the spread between intermodal and truckload contract rates favored intermodal carriers by a little over 10.3%. However, as truckload rates continued to deteriorate through March, that spread is now down to single digits, sitting just over 9.8%. Over the course of the last year, as inventory levels remained elevated, many shippers and customers opted for the longer transit time via the rail as a means of storage while they tried to work through the current inventory glut. As inventory levels have neared more manageable levels with truckload rates reaching historic lows, many of those contracts have returned to their original over-the-road plan, further reducing rail volumes.
Further Reading
- Empty wallets threaten seasonal growth – FreightWaves
- March Class 8 Orders Stumble – Transport Topics
- Don’t call this recovery of freight volumes a comeback – Supply Chain Management Review