Back to September 2025 Industry Update
September 2025 Industry Update: Truckload Capacity Outlook
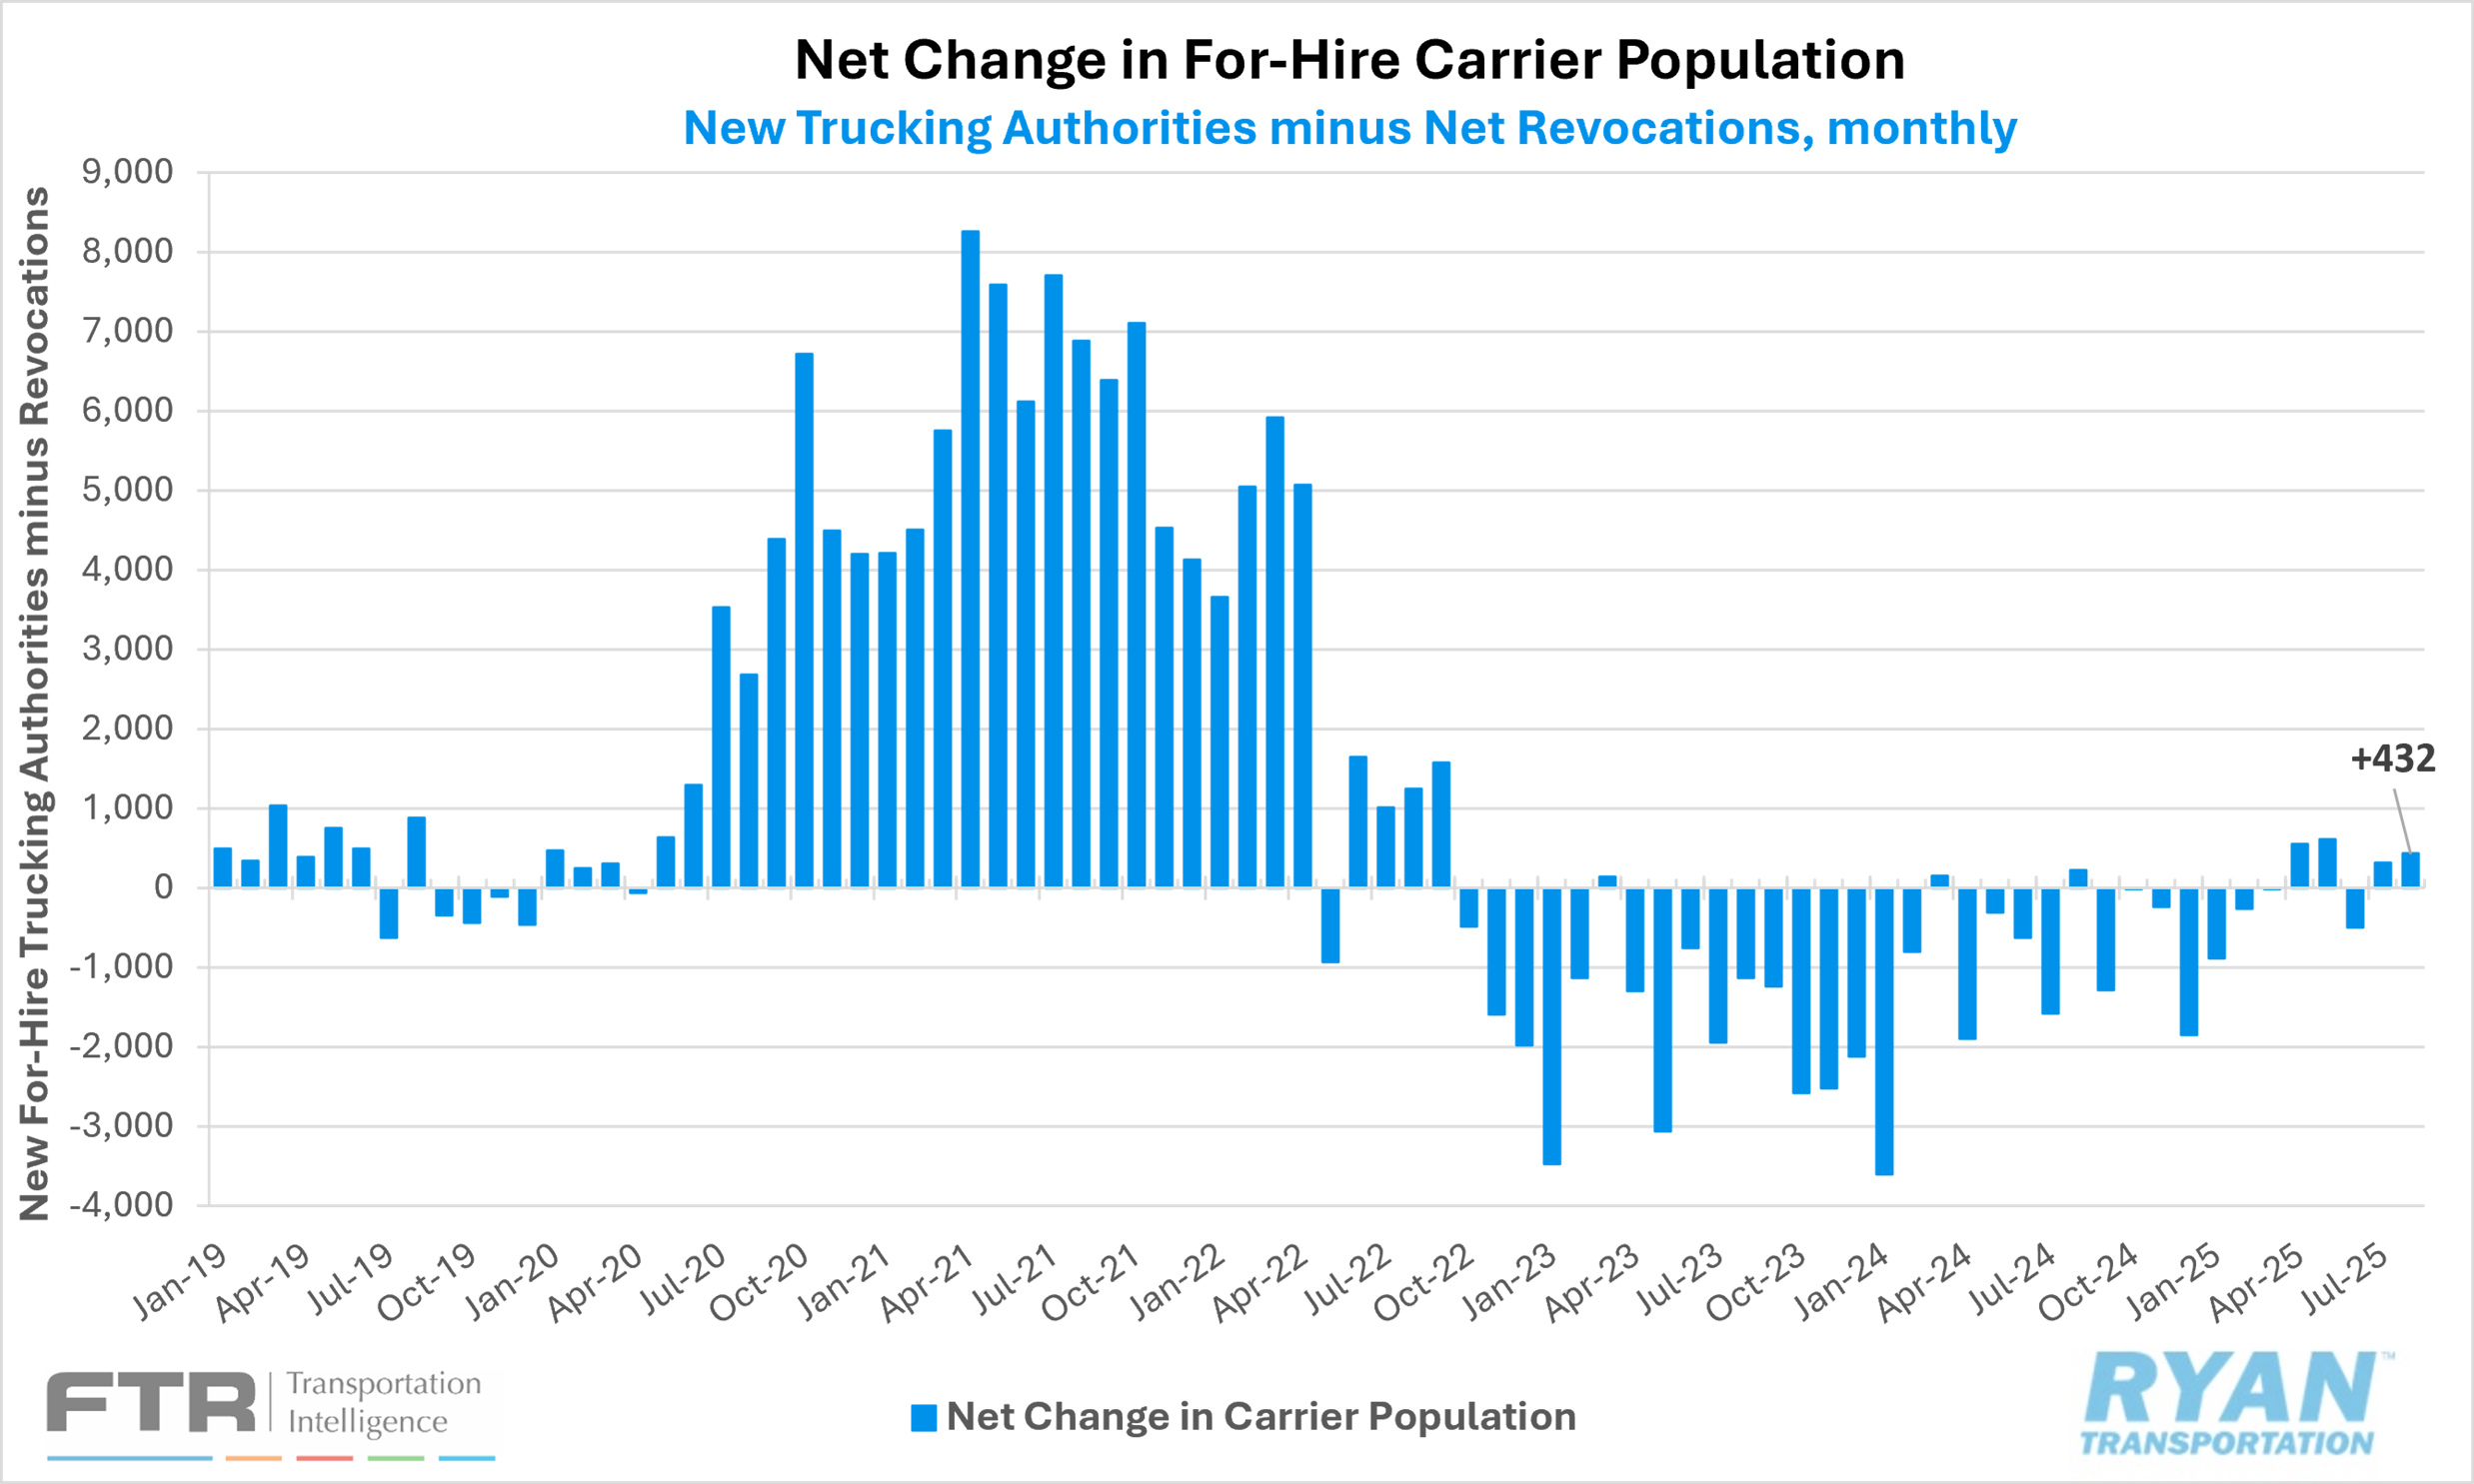
The for-hire carrier population expanded moderately as capacity exits continued to slow, while new entrants have stabilized.
Key Points
- Total net revocations, a measure of total authority rejections minus reinstatements, declined by roughly 240 carriers MoM in August, falling from 4,747 in July to 4,498 in August, according to FTR’s preliminary analysis of the Federal Motor Carrier Safety Administration (FMCSA) data.
- Per FTR, the number of newly authorized for-hire trucking firms declined in August, with the FMCSA authorizing 4,930 new for-hire carriers, 133 fewer than the 5,063 new authorizations in July.
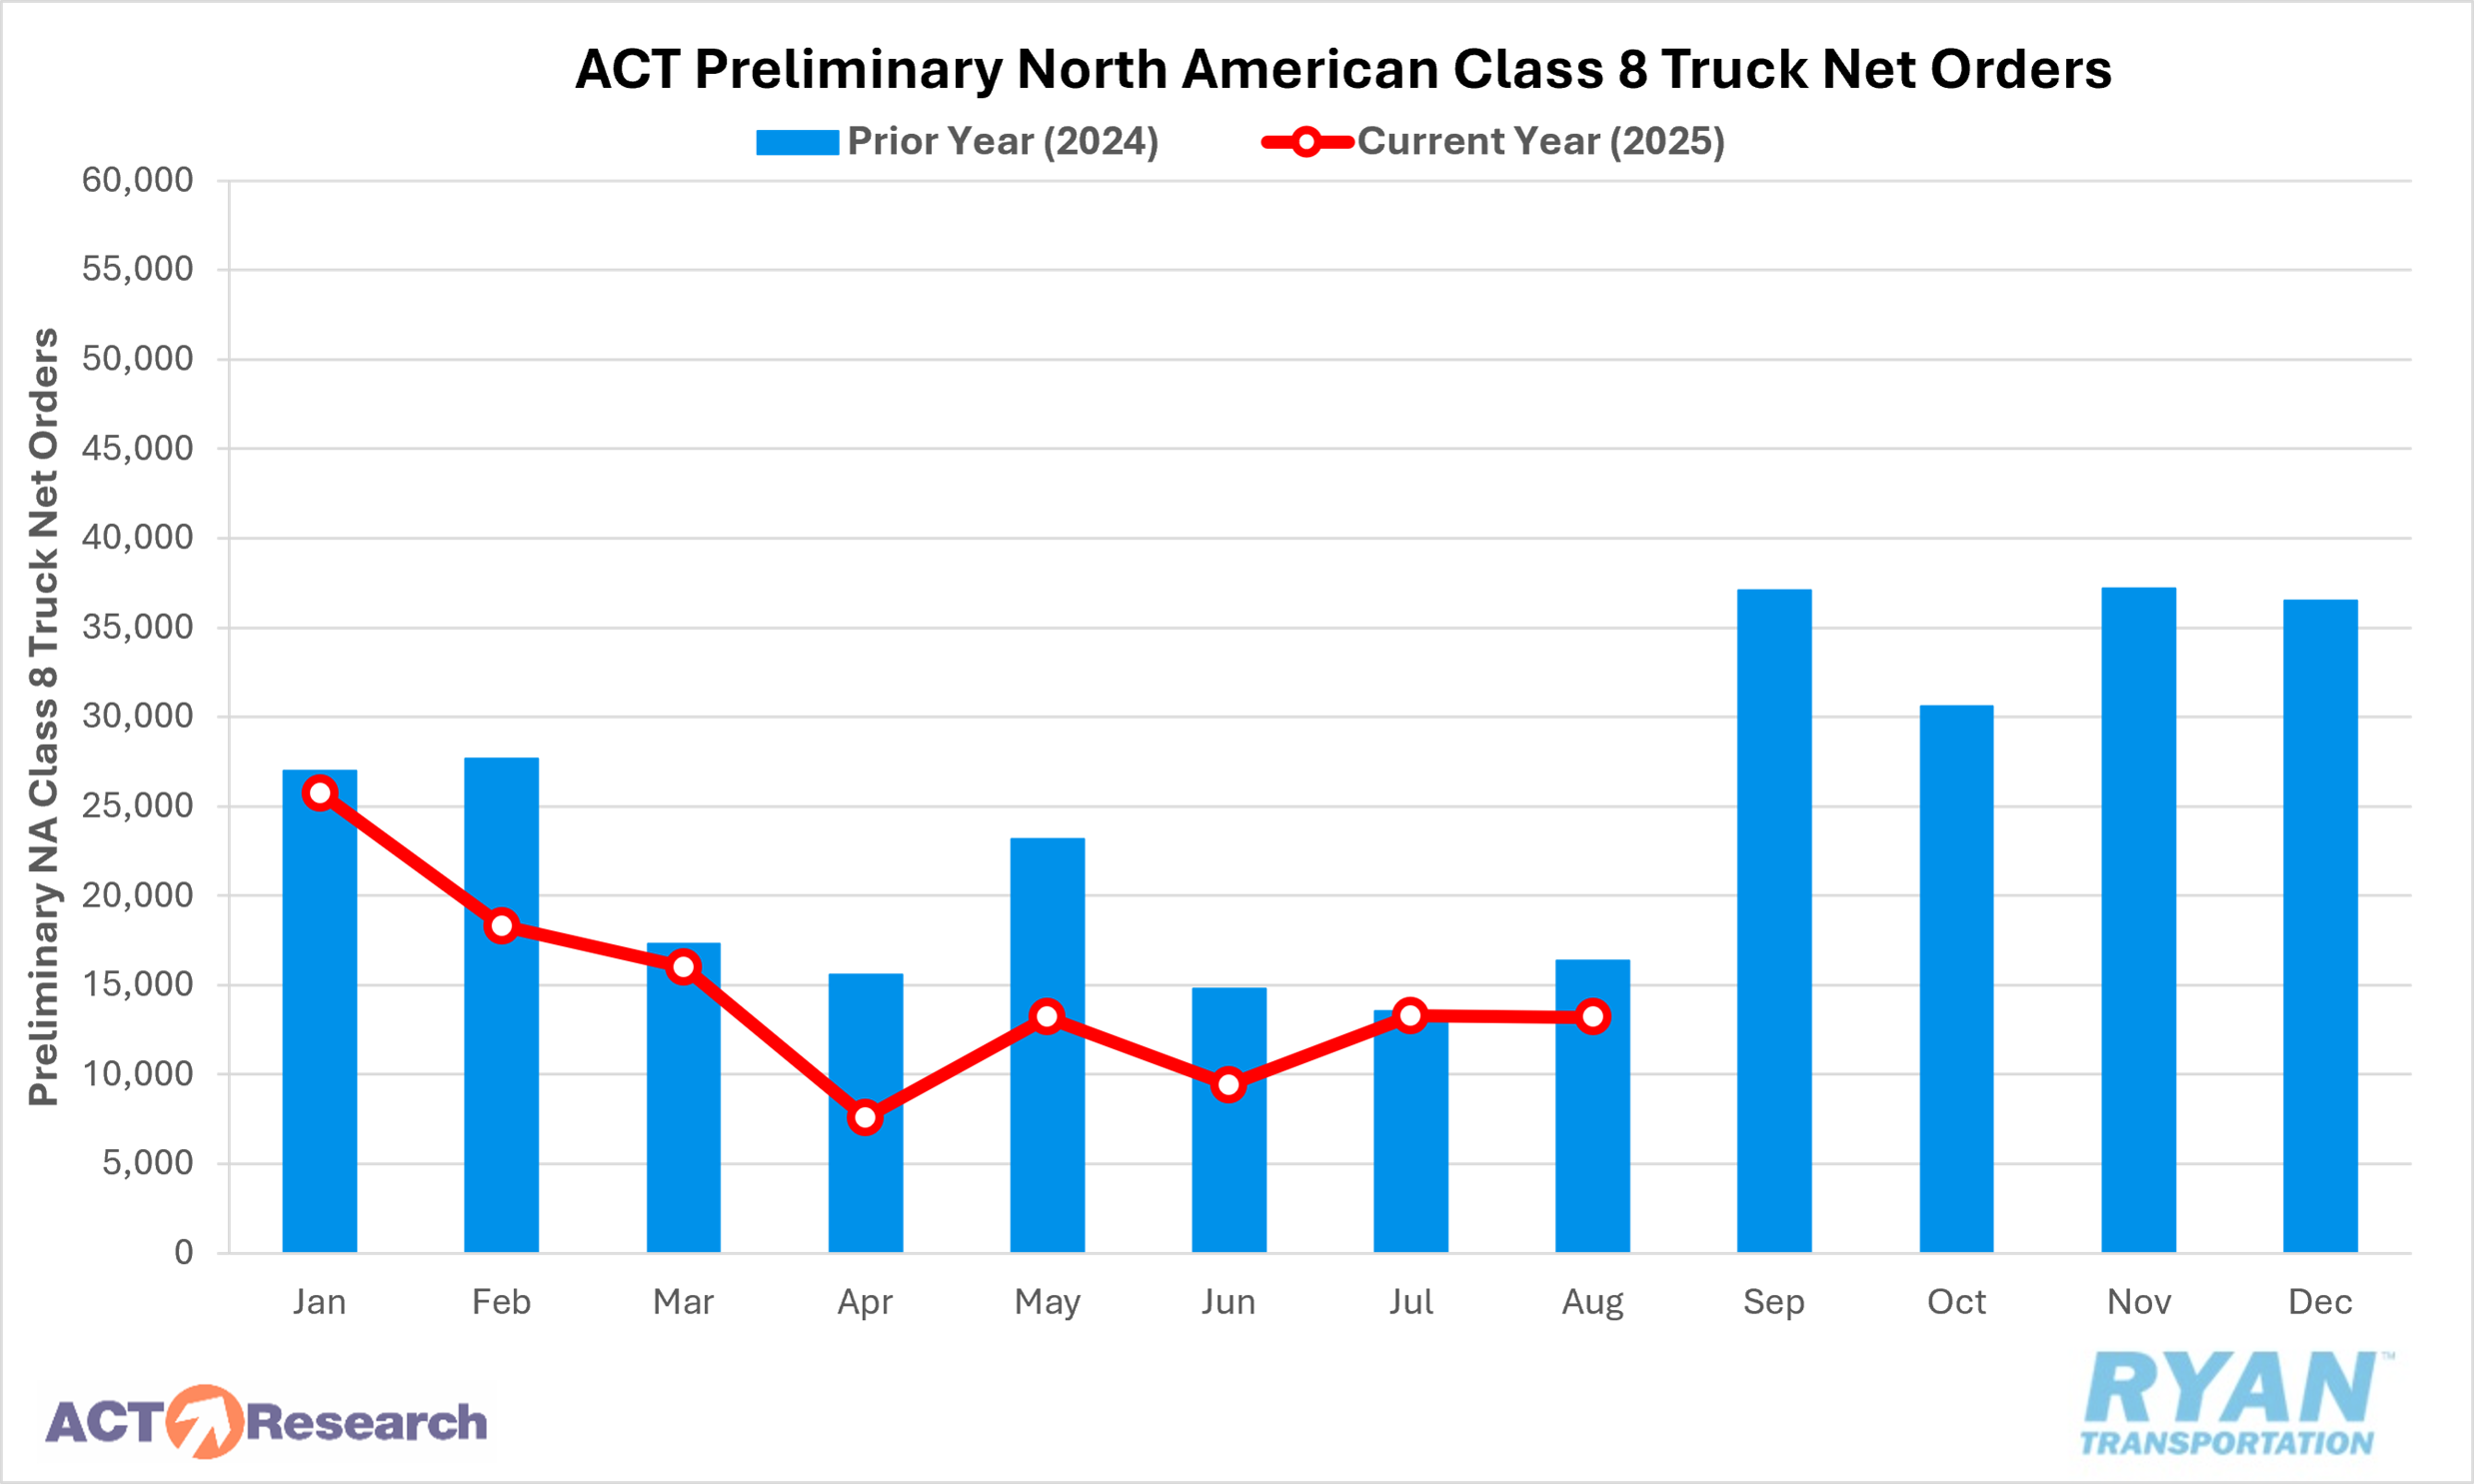
- Preliminary North American Class 8 net order estimates ranged from 13,000 units, as reported by FTR, and 13,200 units per ACT Research in August, with both estimates registering lower YoY by 14.4% and 19.5%, respectively.
Summary
The for-hire trucking population expanded for the second consecutive month in August and for the fourth time in the past five months, with a net increase of 432 carriers MoM. This modest gain was driven primarily by a further slowdown in net authority revocations, which had reached a YTD high of 5,502 carriers in June. Since then, total revocations less reinstatements have fallen by just over 1,000 carriers, a level more than 350 below the monthly average recorded during the first seven months of 2025.
New entrants also declined in August, though to a far lesser extent relative to capacity exits. At 4,930, the number of newly authorized for-hire carriers fell to its lowest level since February. Nevertheless, despite the moderation, August’s total still exceeded both the 2025 monthly average of 4,770 YTD as well as the overall monthly average for 2024 of 4,636.
On the equipment side, preliminary Class 8 net order estimates for North America reflected mixed month-to-month performance. FTR reported a 4% MoM increase in August, while ACT Research recorded a modest 0.8% decline. On an annual basis, however, both estimates pointed to continued weakness, with August marking the eighth consecutive YoY decline. According to FTR, order volumes came in well below the 10-year August average of 23,135 units. Although both the vocational and on-highway segments registered modest sequential improvements, cumulative Class 8 net orders for the 2025 cycle (September 2024 through August 2025) are tracking 15% lower YoY compared with the same period in the prior cycle.
Why It Matters
As excess capacity continues to weigh on the for-hire trucking industry, the stabilization of new entrants amid ongoing contractions in carrier exits offers little clarity on the timing of a potential recovery. It is important to note, however, that fluctuations in the number of operating authorities do not necessarily translate into meaningful shifts in overall capacity. The majority of motor carriers are small fleets or independent owner-operators, and many newly authorized carriers previously operated as leased drivers or company employees. As such, increases in carrier counts do not inherently represent expansion of the driver pool.
Nevertheless, changes in carrier population remain a useful barometer for identifying structural and behavioral shifts within the market — particularly among smaller operators and independent drivers — though they represent only one component of broader supply-side dynamics. According to the latest Bureau of Labor Statistics (BLS) report, for-hire trucking companies shed 900 payroll jobs in August, following revisions to June and July estimates that netted a gain of 700 jobs. Compared to August 2024, industry employment levels were up 0.4% YoY and were also slightly higher than February 2020, the pre-pandemic baseline. More granular data, available only through July, indicated that the job gains in general freight truckload observed in April and May were largely offset by declines in June and July, effectively returning employment to February 2020 levels.
While authorities and employment levels have moderated — yet stabilized — over recent months, weakness in equipment orders is becoming increasingly significant for its potential long-term impact on capacity. The Class 8 market remains under pressure from tariffs, elevated inventories, regulatory uncertainty and soft freight demand. According to FTR, fleets are extending truck lifespans, incurring higher maintenance costs as a result. With little clarity on trade and regulatory policy, persistent softness is expected to carry through the 2026 order cycle when OEMs reopen their order books in September. This lower level of vehicle production could set the stage for tighter capacity and may eventually help shift demand back toward the for-hire market sometime next year.
Another potential contributor to capacity tightening is the enforcement of the English Language Proficiency (ELP) rule, which took effect on June 25. As discussed in last month’s industry update, during its first 30 days of implementation, the mandate — requiring stricter enforcement of ELP as an out-of-service (OOS) violation —translated to an annualized rate of fewer than 18,000 drivers being placed OOS, a relatively small share of the overall driver population. However, a fatal truck crash in Florida on August 12, involving a driver with a non-domiciled CDL who failed an ELP assessment, thrust the issue into the national spotlight and has become a rallying point for the current administration. In the aftermath, Secretary of State Marco Rubio announced a pause on all worker visas for commercial truck drivers as part of efforts to address immigrant driver participation. According to FTR’s analysis, data through August 25 reflected little change from the initial enforcement period, with 3,160 of 11,880 total violations (approximately 27%) resulting in drivers being placed OOS. That said, apparent delays in enforcement in some states, combined with increasing federal pressure on others, could lead to higher OOS figures in the near term.