Back to August 2025 Industry Update
August 2025 Industry Update: Truckload Supply
Rejection rates continued to trend above previous year’s levels despite weaker demand, indicating that market conditions continue to tighten.
Key Points
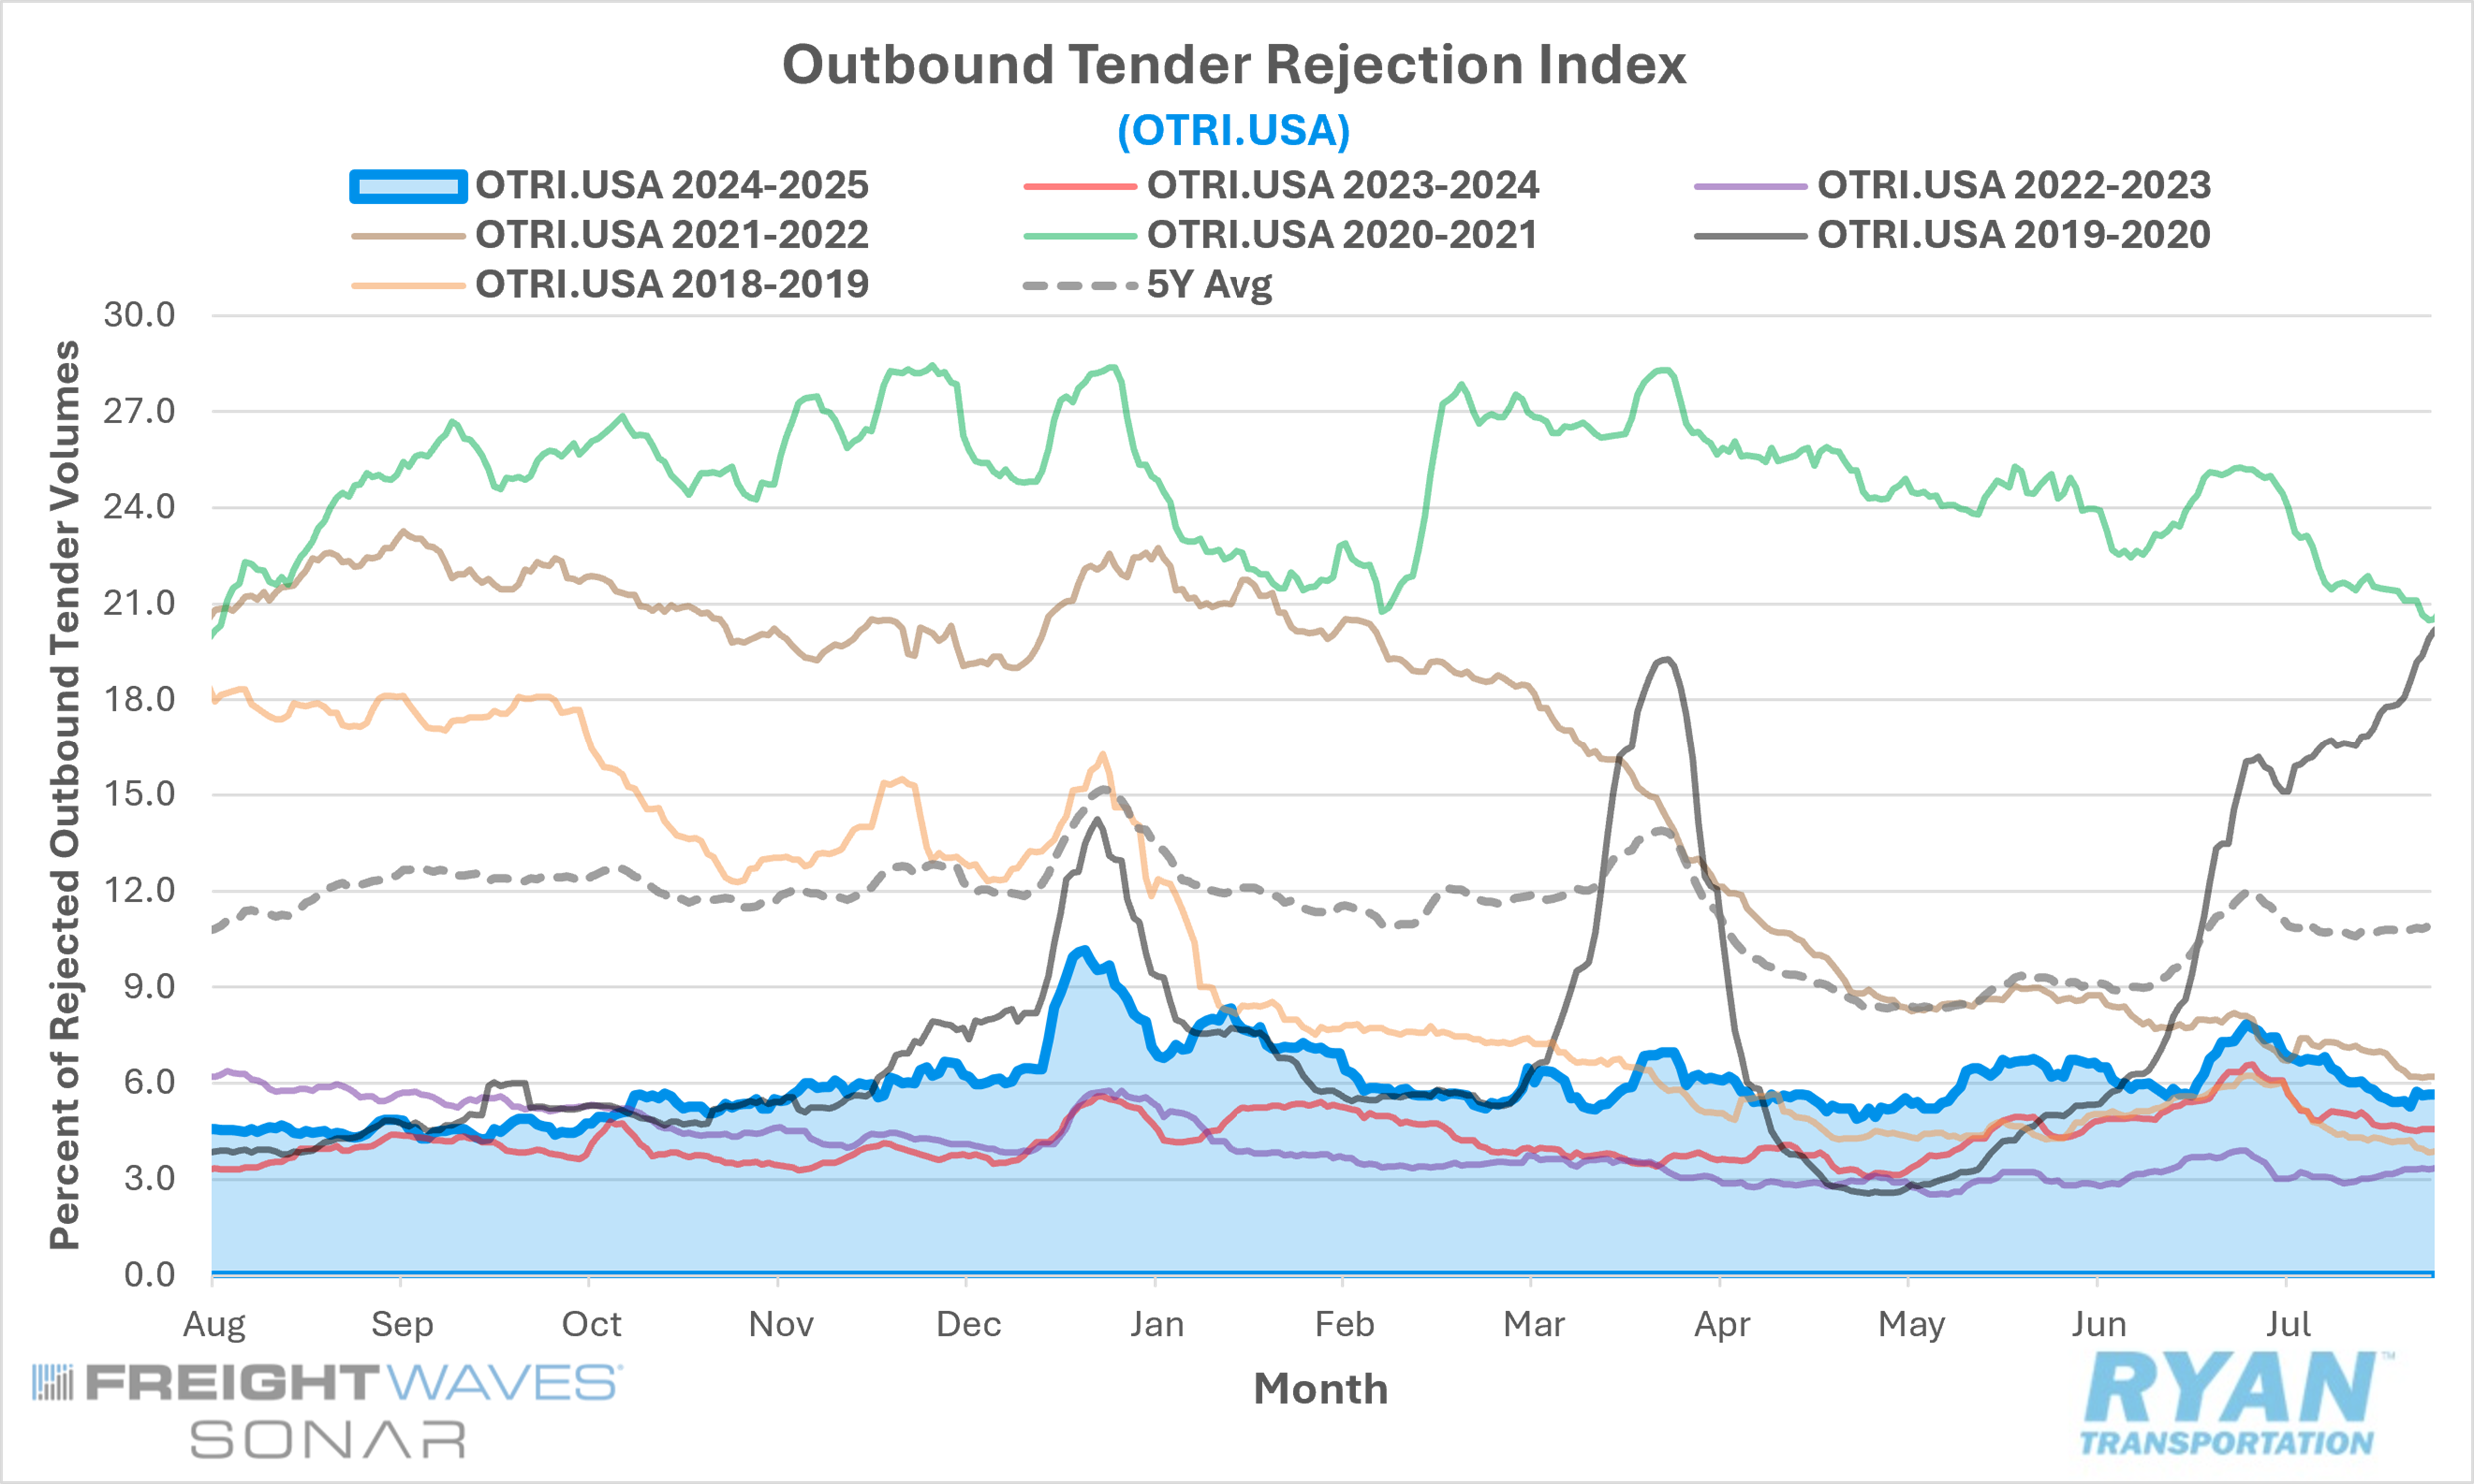
- Mid-month comparisons of the FreightWaves SONAR Outbound Tender Rejection Index (OTRI.USA), which measures relative capacity based on a carriers’ willingness to accept freight volumes under contract, reflected a 46 bps increase MoM in July compared to June.
- The monthly average of daily tender rejections changed little, registering just 6 bps higher MoM from 6.33% in June to 6.39% in July.
- On an annual basis, average daily tender rejections remained elevated by 1.2% YoY but remained 4.6% below the 5-year average.
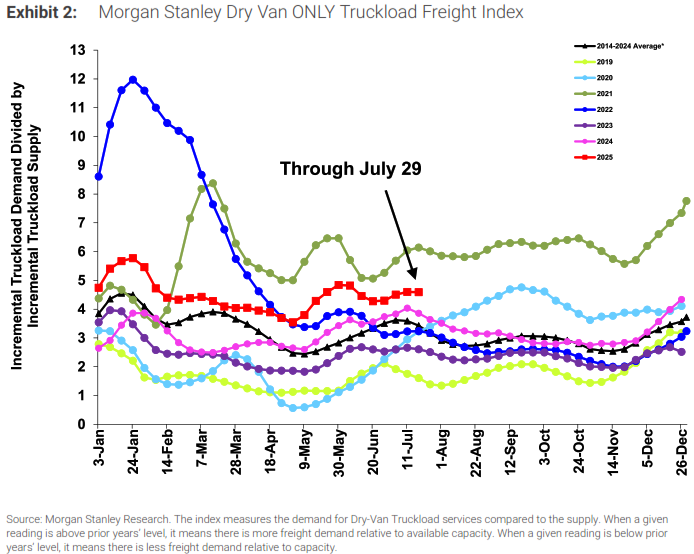
- The Morgan Stanley Truckload Freight Index (MSTLFI) fluctuated in July, increasing through the first half of the month before registering sequential declines. However, it outperformed typical seasonality throughout the month, driven by a strong outperformance in the supply component.
Summary
Tender rejections in July mirrored the pattern observed in June, surging sharply in the early part of the month as drivers temporarily exited the market for the Independence Day holiday before steadily retreating over the remainder of the month. After reaching their highest level since mid-January — just under 8% — amid the holiday-driven capacity disruption, rejection rates declined by more than 220 basis points to close the month slightly above 5.6%.
Despite the consistent WoW declines, the early-month holiday spike was sufficient to lift July’s monthly average rejection rate above June’s level, contrary to historical norms that typically reflect a 50-basis-point MoM decrease. At 6.39%, July’s average tender rejection rate was the second-highest reading YTD, trailing only January’s 7.41%, and exceeded the January–June 2025 average by 20 basis points. On a YoY basis, July marked the 19th consecutive month of elevated rejection rates, further supporting the ongoing capacity rationalization and the gradual reemergence of seasonal patterns. This seasonal influence was particularly evident around the Fourth of July, when rejections historically peak within the first four days of the month — most often on July 1, with exceptions in 2019 and 2020. In 2025, rejection rates during those four days averaged 7.65%, up 124 basis points from the same period in 2024 and 387 basis points higher compared to 2023.
The latest Morgan Stanley Truckload Freight Index (MSTLFI) further reflected the impact of continued capacity attrition, as the index outperformed typical seasonality in July, driven by notable strength in the supply component. Supply declined by ~80 basis points during the month, compared to its historical average increase of ~210 basis points. Demand also outperformed seasonality, contracting by ~50 basis points versus the historical average decline of ~200 basis points. Survey sentiment within the index’s three primary components — Truckload Demand, Truckload Supply and Truckload Rates — was mixed. In the first half of the month, current sentiment was positive for both demand and supply before turning negative in the second half, while forward-looking sentiment remained negative across all three metrics throughout the month.
Why It Matters
The steady decline in tender rejections during July was largely anticipated, as the month is historically a softer seasonal period marking the start of the third quarter. With drivers returning to the road following the Independence Day holiday and reintroducing capacity into the market — while the bulk of summer shipping volumes began to taper — rejection rates typically retreat from their pre-holiday peaks at a pace more pronounced than in June. This stability suggests that pricing power is gradually shifting toward a more balanced state, though meaningful progress is still required before equilibrium is reached.
One of the most closely watched developments in recent months — viewed by many as a potential catalyst for alleviating the industry’s capacity glut — was the reinstatement of the English Language Proficiency (ELP) requirement as an out-of-service (OOS) violation. Following an executive order signed by President Trump in late April, the ELP mandate took effect on June 25. In its August 2025 Trucking Update, FTR conducted an in-depth analysis of the first 30 days of enforcement data to assess the rule’s impact. From June 25 through July 24, roadside inspectors issued 5,617 ELP violations, representing a substantial increase in enforcement activity compared to the same period in 2024, when just 599 violations were recorded — none of which resulted in an OOS order.
Of the 5,617 violations cited in 2025, 4,105 (73%) occurred within designated border commercial zones near the U.S.–Mexico border. Per the FMCSA’s May 20 replacement guidance, violations within these zones were not subject to OOS enforcement. The remaining 1,447 violations (27%) were subject to stricter enforcement and resulted in the driver being placed OOS. On an annualized basis, this rate of enforcement would equate to approximately 17,400 drivers being placed OOS — an insufficient volume, according to FTR, to materially alter current market conditions. While the new ELP mandate has yet to deliver the scale of market impact initially anticipated, it is important to note that one month of data is insufficient to establish a definitive trend, and it remains too early to determine whether July’s results will prove indicative of a longer-term shift.