Back to September 2025 Industry Update
September 2025 Industry Update: Truckload Supply
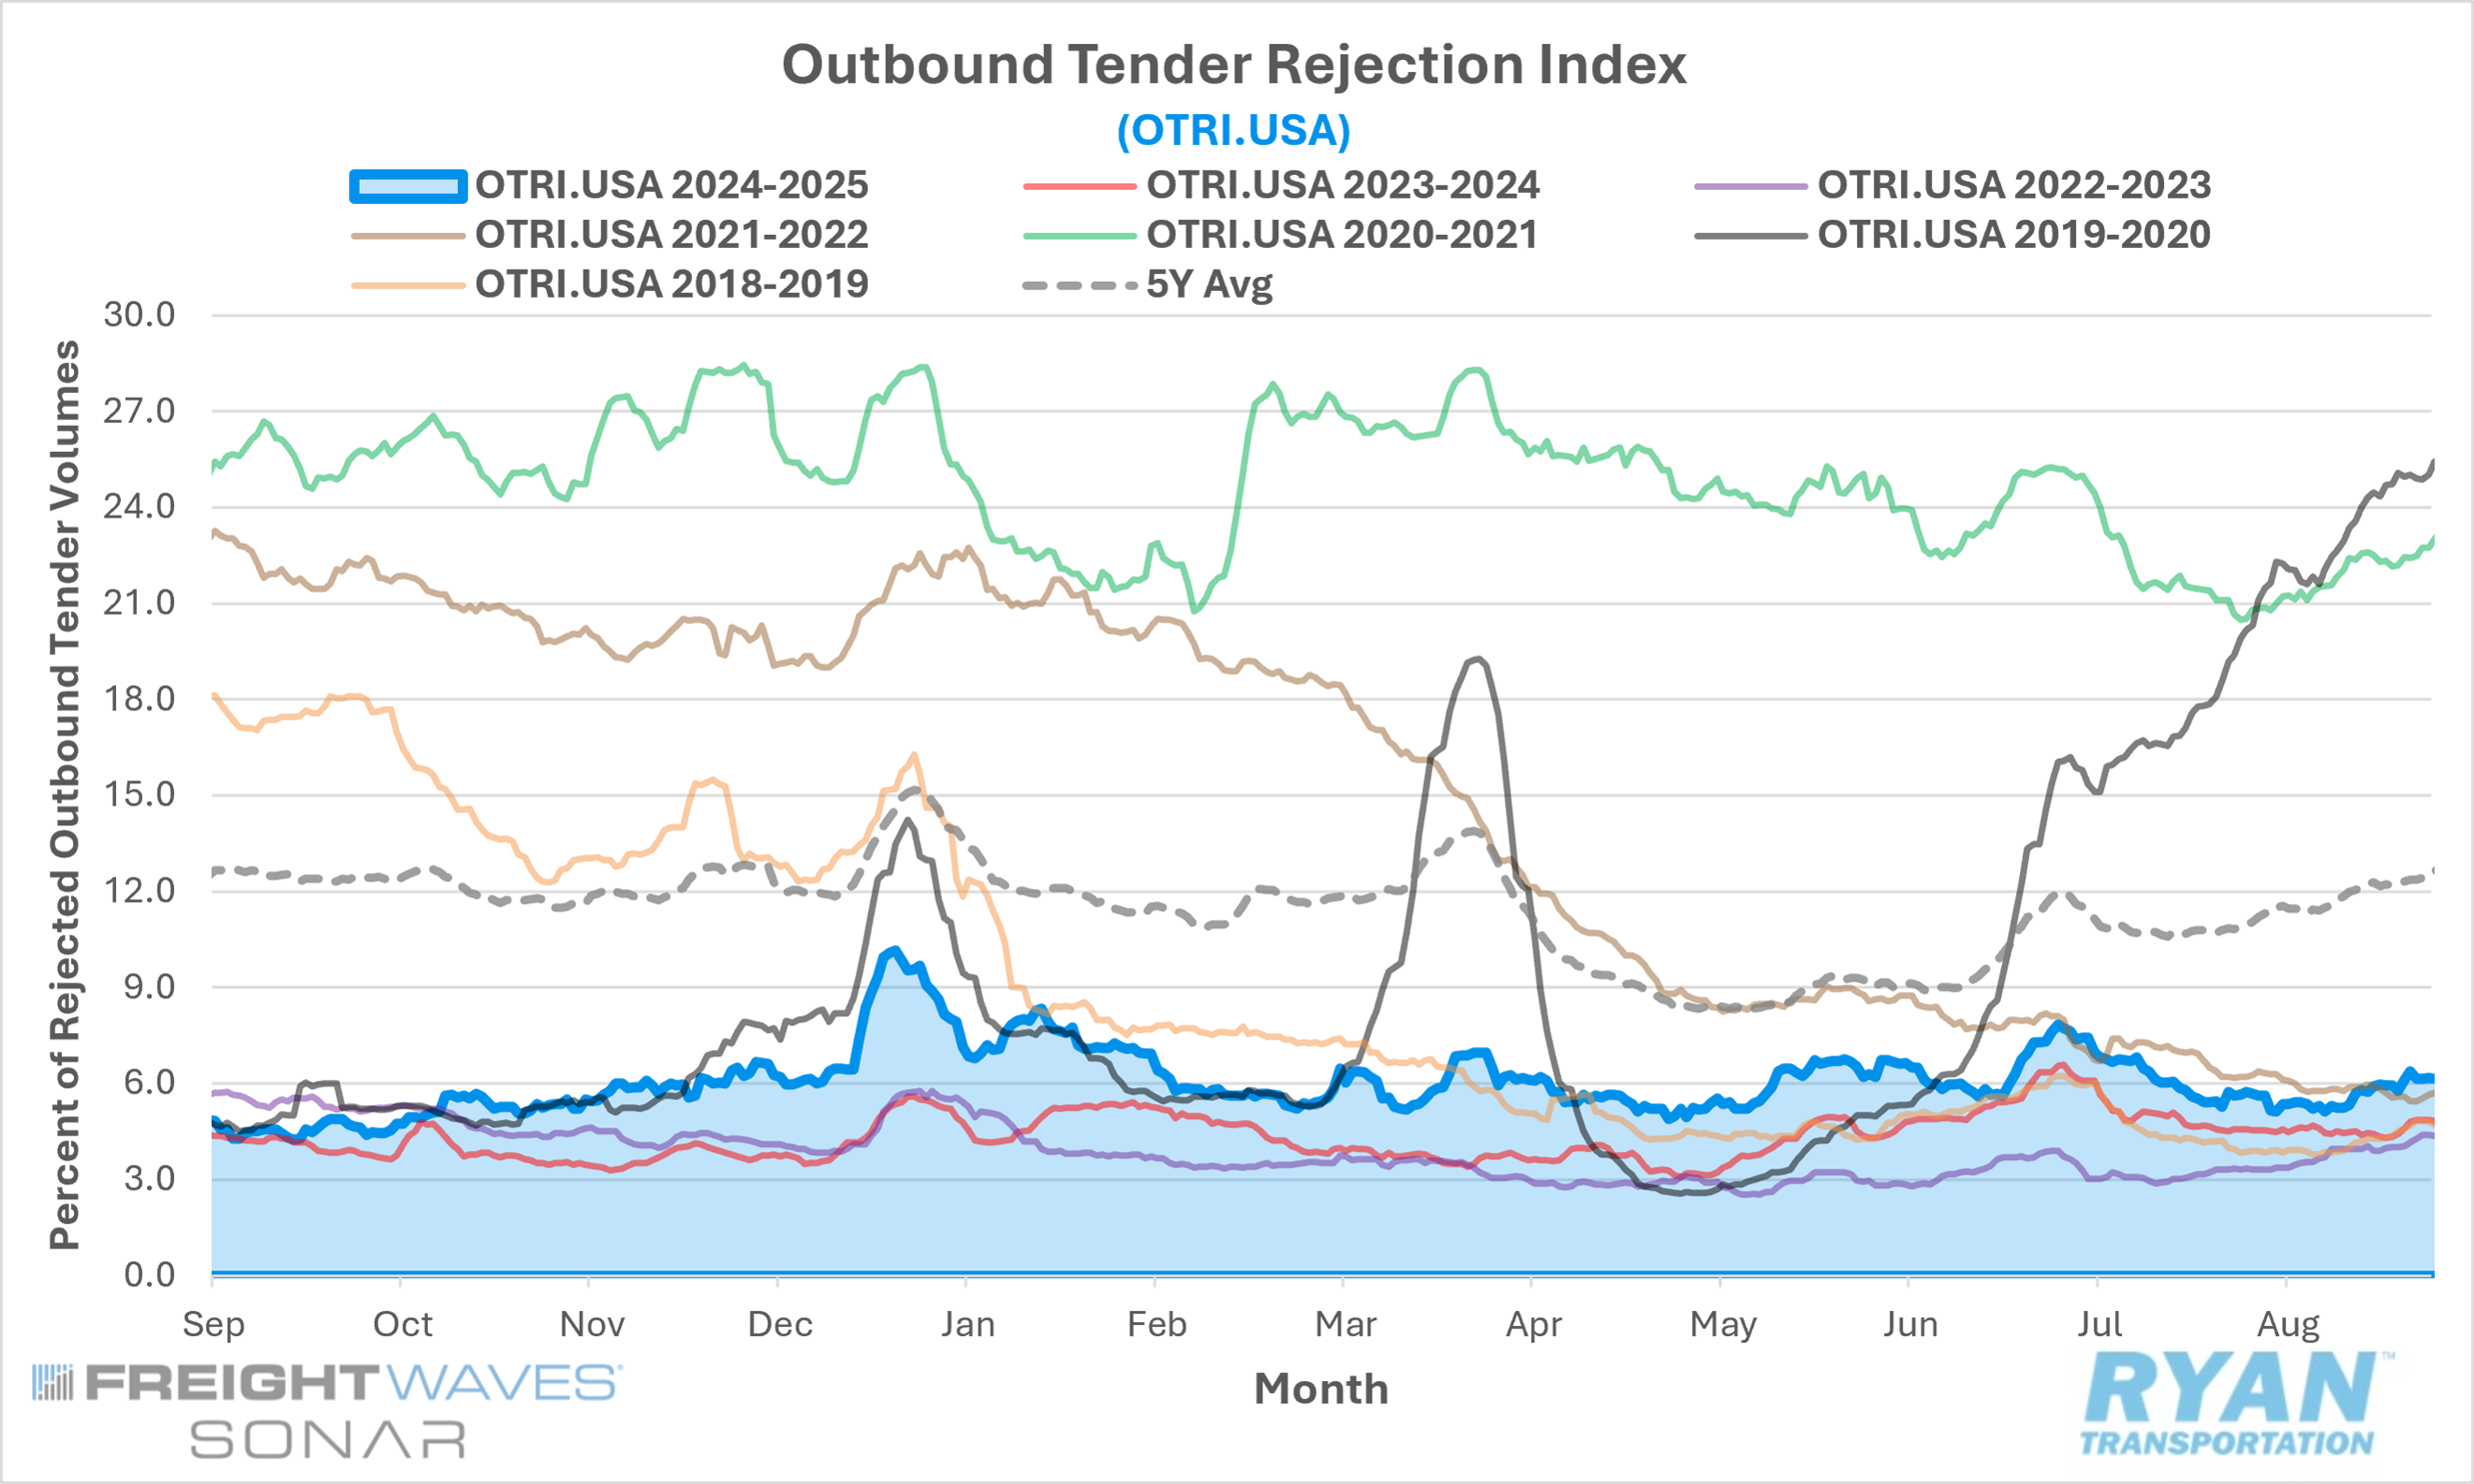
Tender rejections rebounded ahead of Labor Day after dropping to their lowest levels since April earlier in the month.
Key Points
- The FreightWaves SONAR Outbound Tender Rejection Index (OTRI.USA), which measures relative capacity based on carriers’ willingness to accept freight volumes under contract, reflected a 53 bps increase MoM in August compared to July, rising from 5.64% to 6.17%.
- The monthly average of daily tender rejections declined by 76 bps MoM in August, falling from 6.39% in July to 5.62%.
- On an annual basis, average daily tender rejections remained elevated by 1.08% YoY but were down 6.17% compared to the 5-year average.
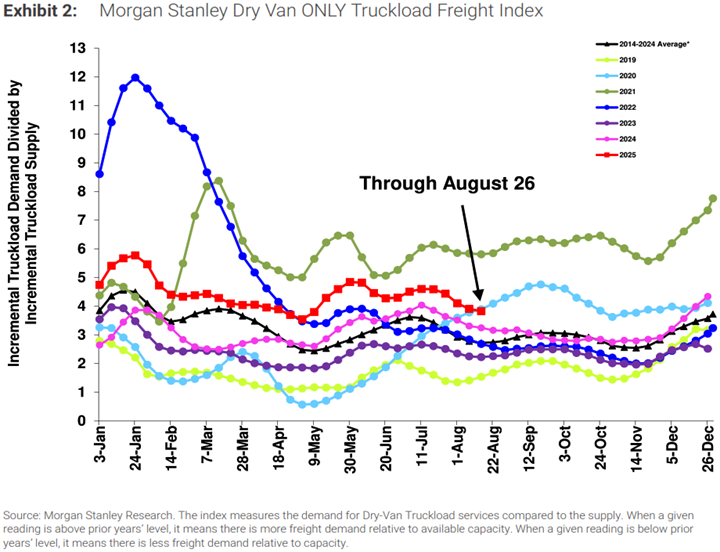
- The Morgan Stanley Truckload Freight Index (MSTLFI) was mixed in August, outperforming typical seasonality in the first half of the month, followed by a slight underperformance in the second half, declining sequentially throughout the month.
Summary
After three consecutive months of gains, average daily tender rejections turned sharply negative in August, retreating to levels last recorded in April. The 76-bps MoM decline was significantly steeper than the typical seasonal decline of 11 bps for the month. Nonetheless, rejection rates remained above year-ago levels for the 20th consecutive month, highlighting the ongoing influence of capacity attrition relative to 2024.
Mirroring the pattern observed in tender volumes, rejection trends in August were split between the first and second halves of the month. During the initial two weeks, continued softening in freight demand pushed the FreightWaves SONAR OTRI down to 5.13%, 61 bps below its opening level and the lowest reading since late April, when the index briefly fell below 5%. However, rejection rates rebounded quickly in the second half of the month, surging 61 bps WoW in the third week and climbing an additional 43 bps thereafter to close August 104 bps above their mid-month lows.
The latest MSTLFI report also reflected this mixed performance between early and late August. According to the report, the index extended its July outperformance into the first half of August, supported by relative strength in the demand component compared with its typical seasonal decline, while supply trends aligned more closely with seasonal expectations. However, in the latter half of the month, significant underperformance in the supply component outweighed continued strength in demand, leaving the overall index modestly below seasonal norms. Specifically, demand decreased by ~410 bps compared with its historical average decline of ~930 bps, while supply increased by ~940 bps versus its seasonal average increase of ~810 bps.
Why It Matters
The ongoing sensitivity of tender rejections to short-term demand fluctuations and seasonal events, such as holidays, continues to signal that market conditions are gradually tightening as capacity exits the industry. Evidence of this tightening is reflected in the OTRI, which has remained elevated on a YoY basis despite freight volumes continuing to trend below prior-year levels. Still, outside of seasonal disruptions, rejection rates remain broadly consistent with a market struggling to absorb persistent excess capacity.
Although Labor Day weekend and the pre-holiday uptick in shipping activity placed upward pressure on tender rejections at the end of August, the decline in the OTRI during the first half of the month — to its lowest level since April — underscored that pricing power remains firmly tilted toward shippers. This imbalance was further highlighted in the August 2025 LMI, which reported a 4.7% MoM increase in the Transportation Capacity Index to 57.3%. While not a dramatic shift, the increase was notable as it pushed the capacity index above the Transportation Prices Index (56.1%), resulting in a negative freight inversion. As outlined in the April 2025 Industry Update, such inversions — when capacity growth outpaces pricing — have historically been associated with a movement toward transportation slowdowns. The August inversion, though mild at 1.2%, marked the first instance of capacity expanding faster than pricing since April 2024, which coincided with the end of the prior freight recession.
It is important to emphasize that a single month does not establish a trend; historically, at least three consecutive months of negative inversion are required before conditions can be classified as a freight recession. Nevertheless, the reemergence of this dynamic ahead of the traditional peak season makes the likelihood of a near-term rebound in the transportation industry increasingly remote. While current expectations do not anticipate a recession in either the transportation sector or the broader economy, these metrics warrant close monitoring, particularly as transportation often functions as a leading indicator for broader economic performance.