Back to September 2025 Industry Update
September 2025 Industry Update: Truckload Rates
Seasonal slowdowns in shipping activity led to further declines in average spot rates, while average contract rates continued their flat trend.
Spot Rates
Key Points
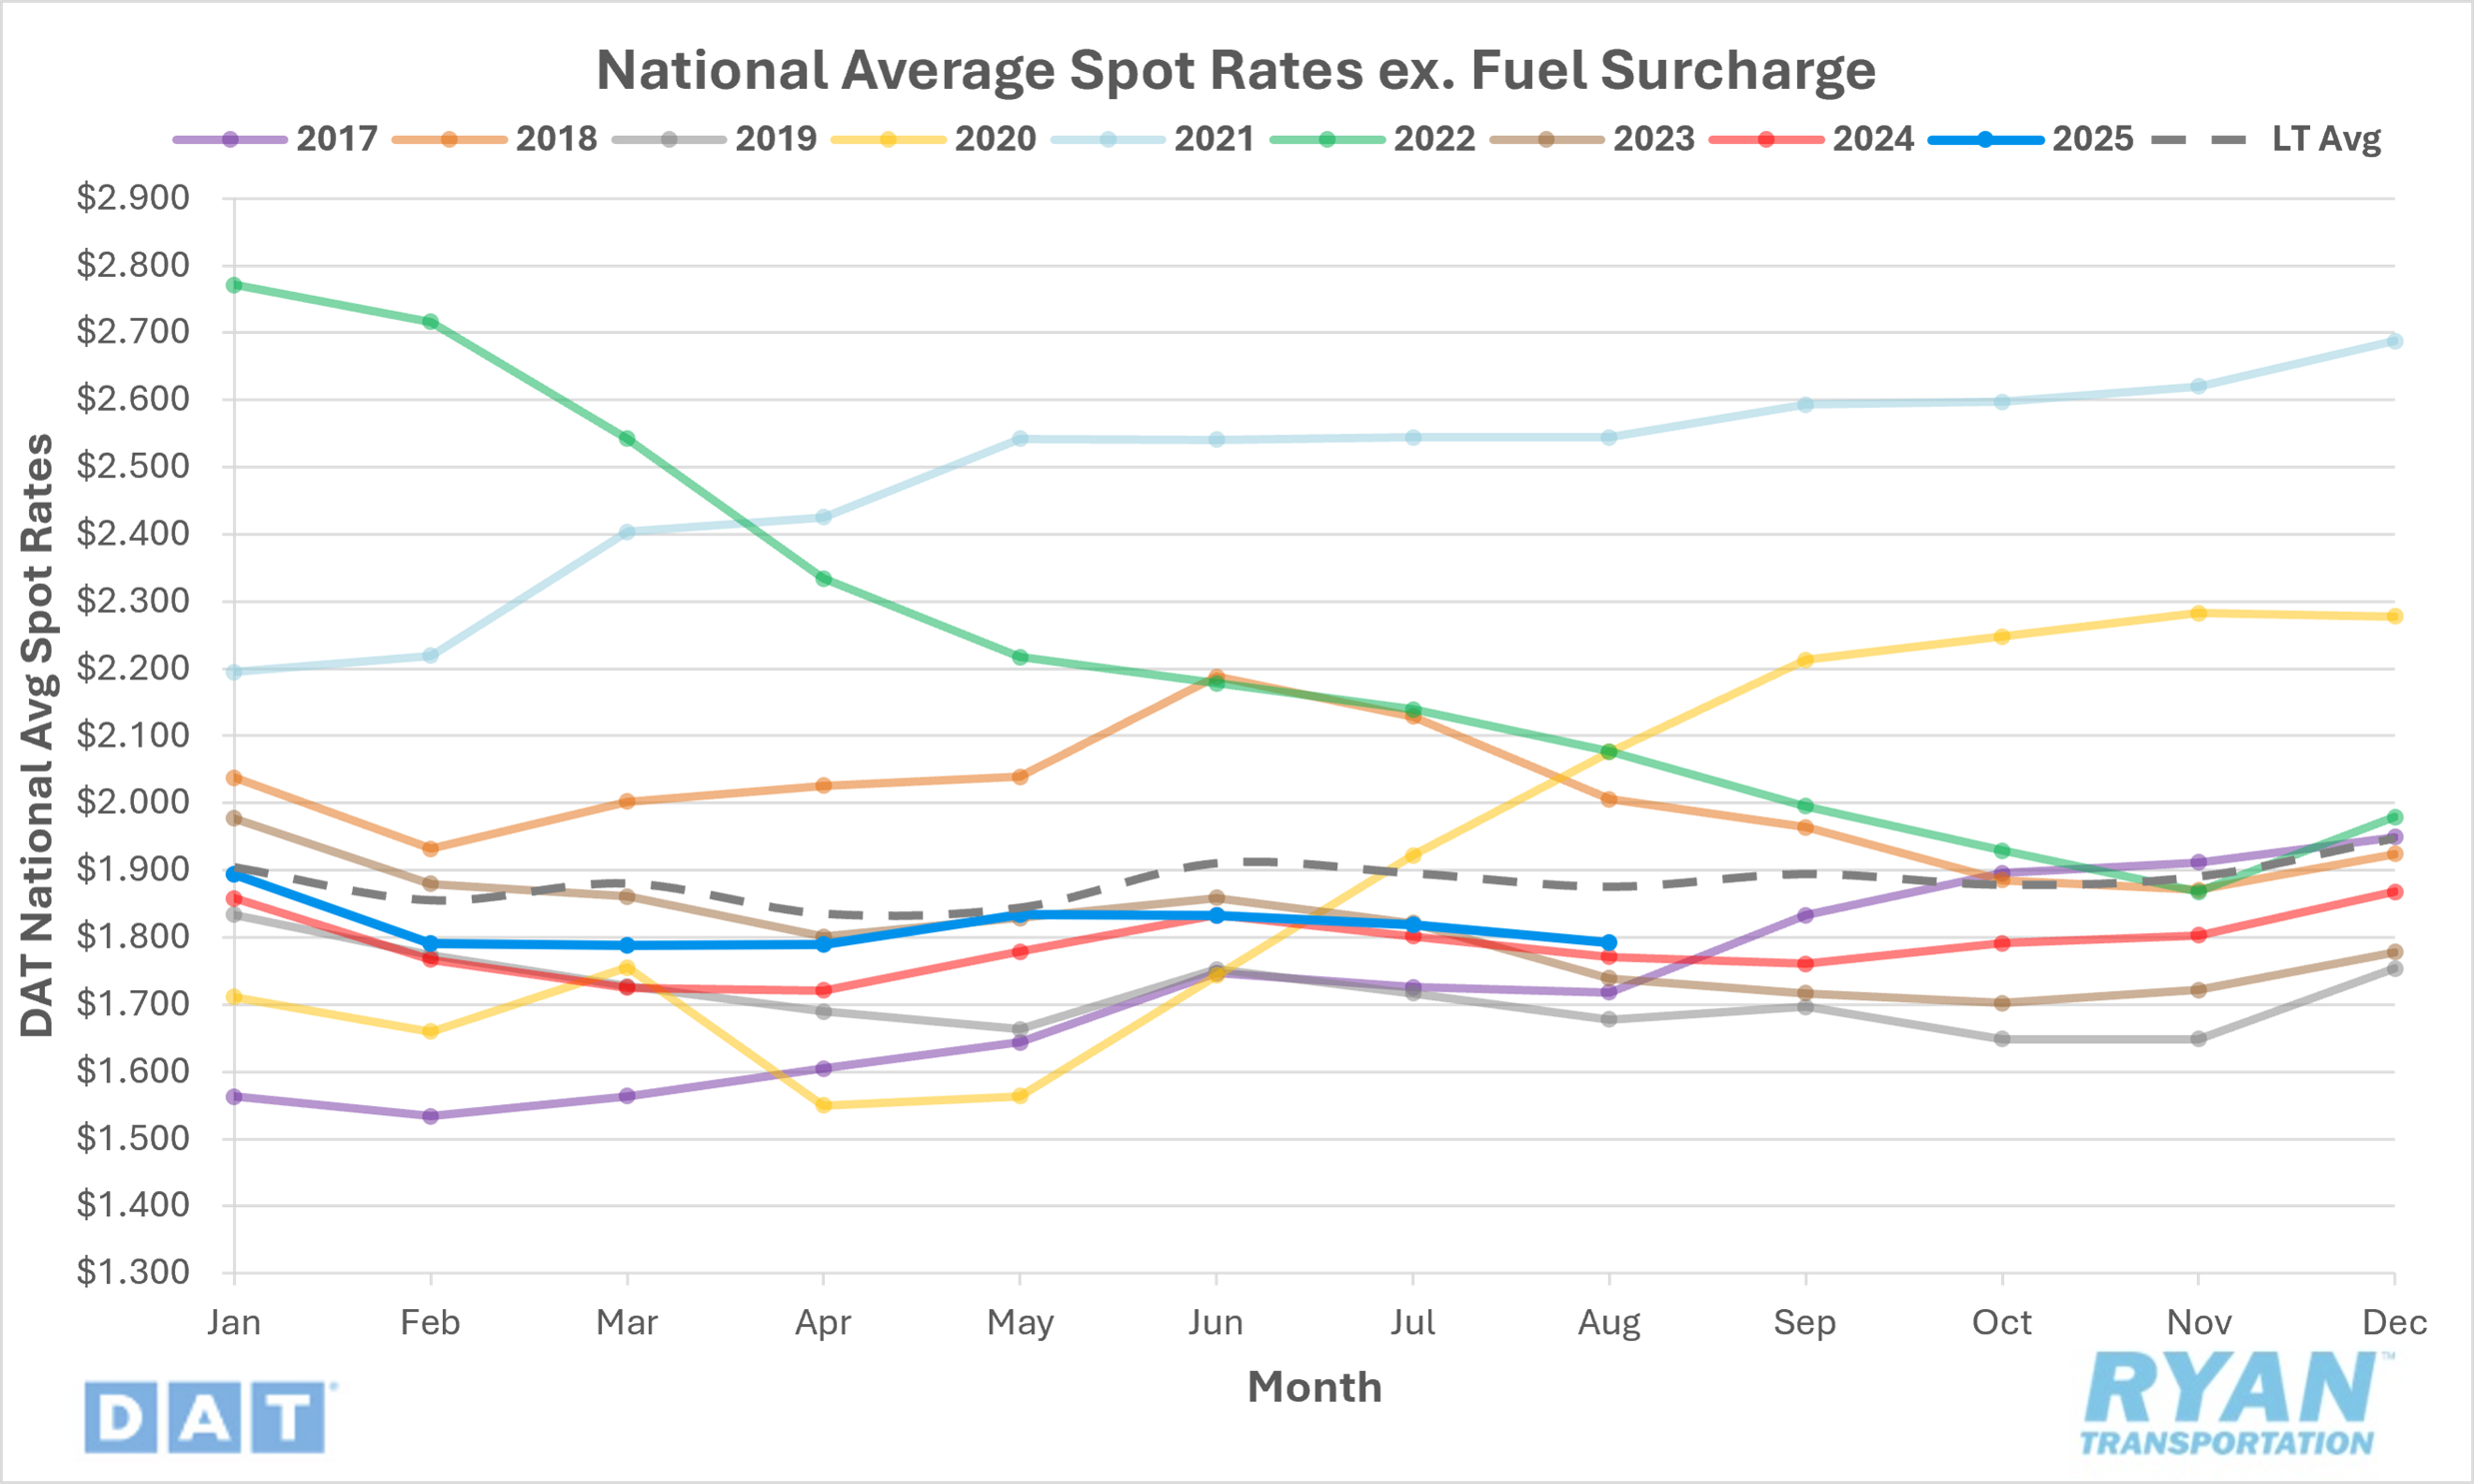
The national average spot rate, excluding fuel, declined 1.5% MoM, or just below $0.03, to $1.79 in August.
Average linehaul rates were up 1.2% YoY compared to August 2024 but were 4.7% below the long-term (LT) average.
Contract Rates
Key Points
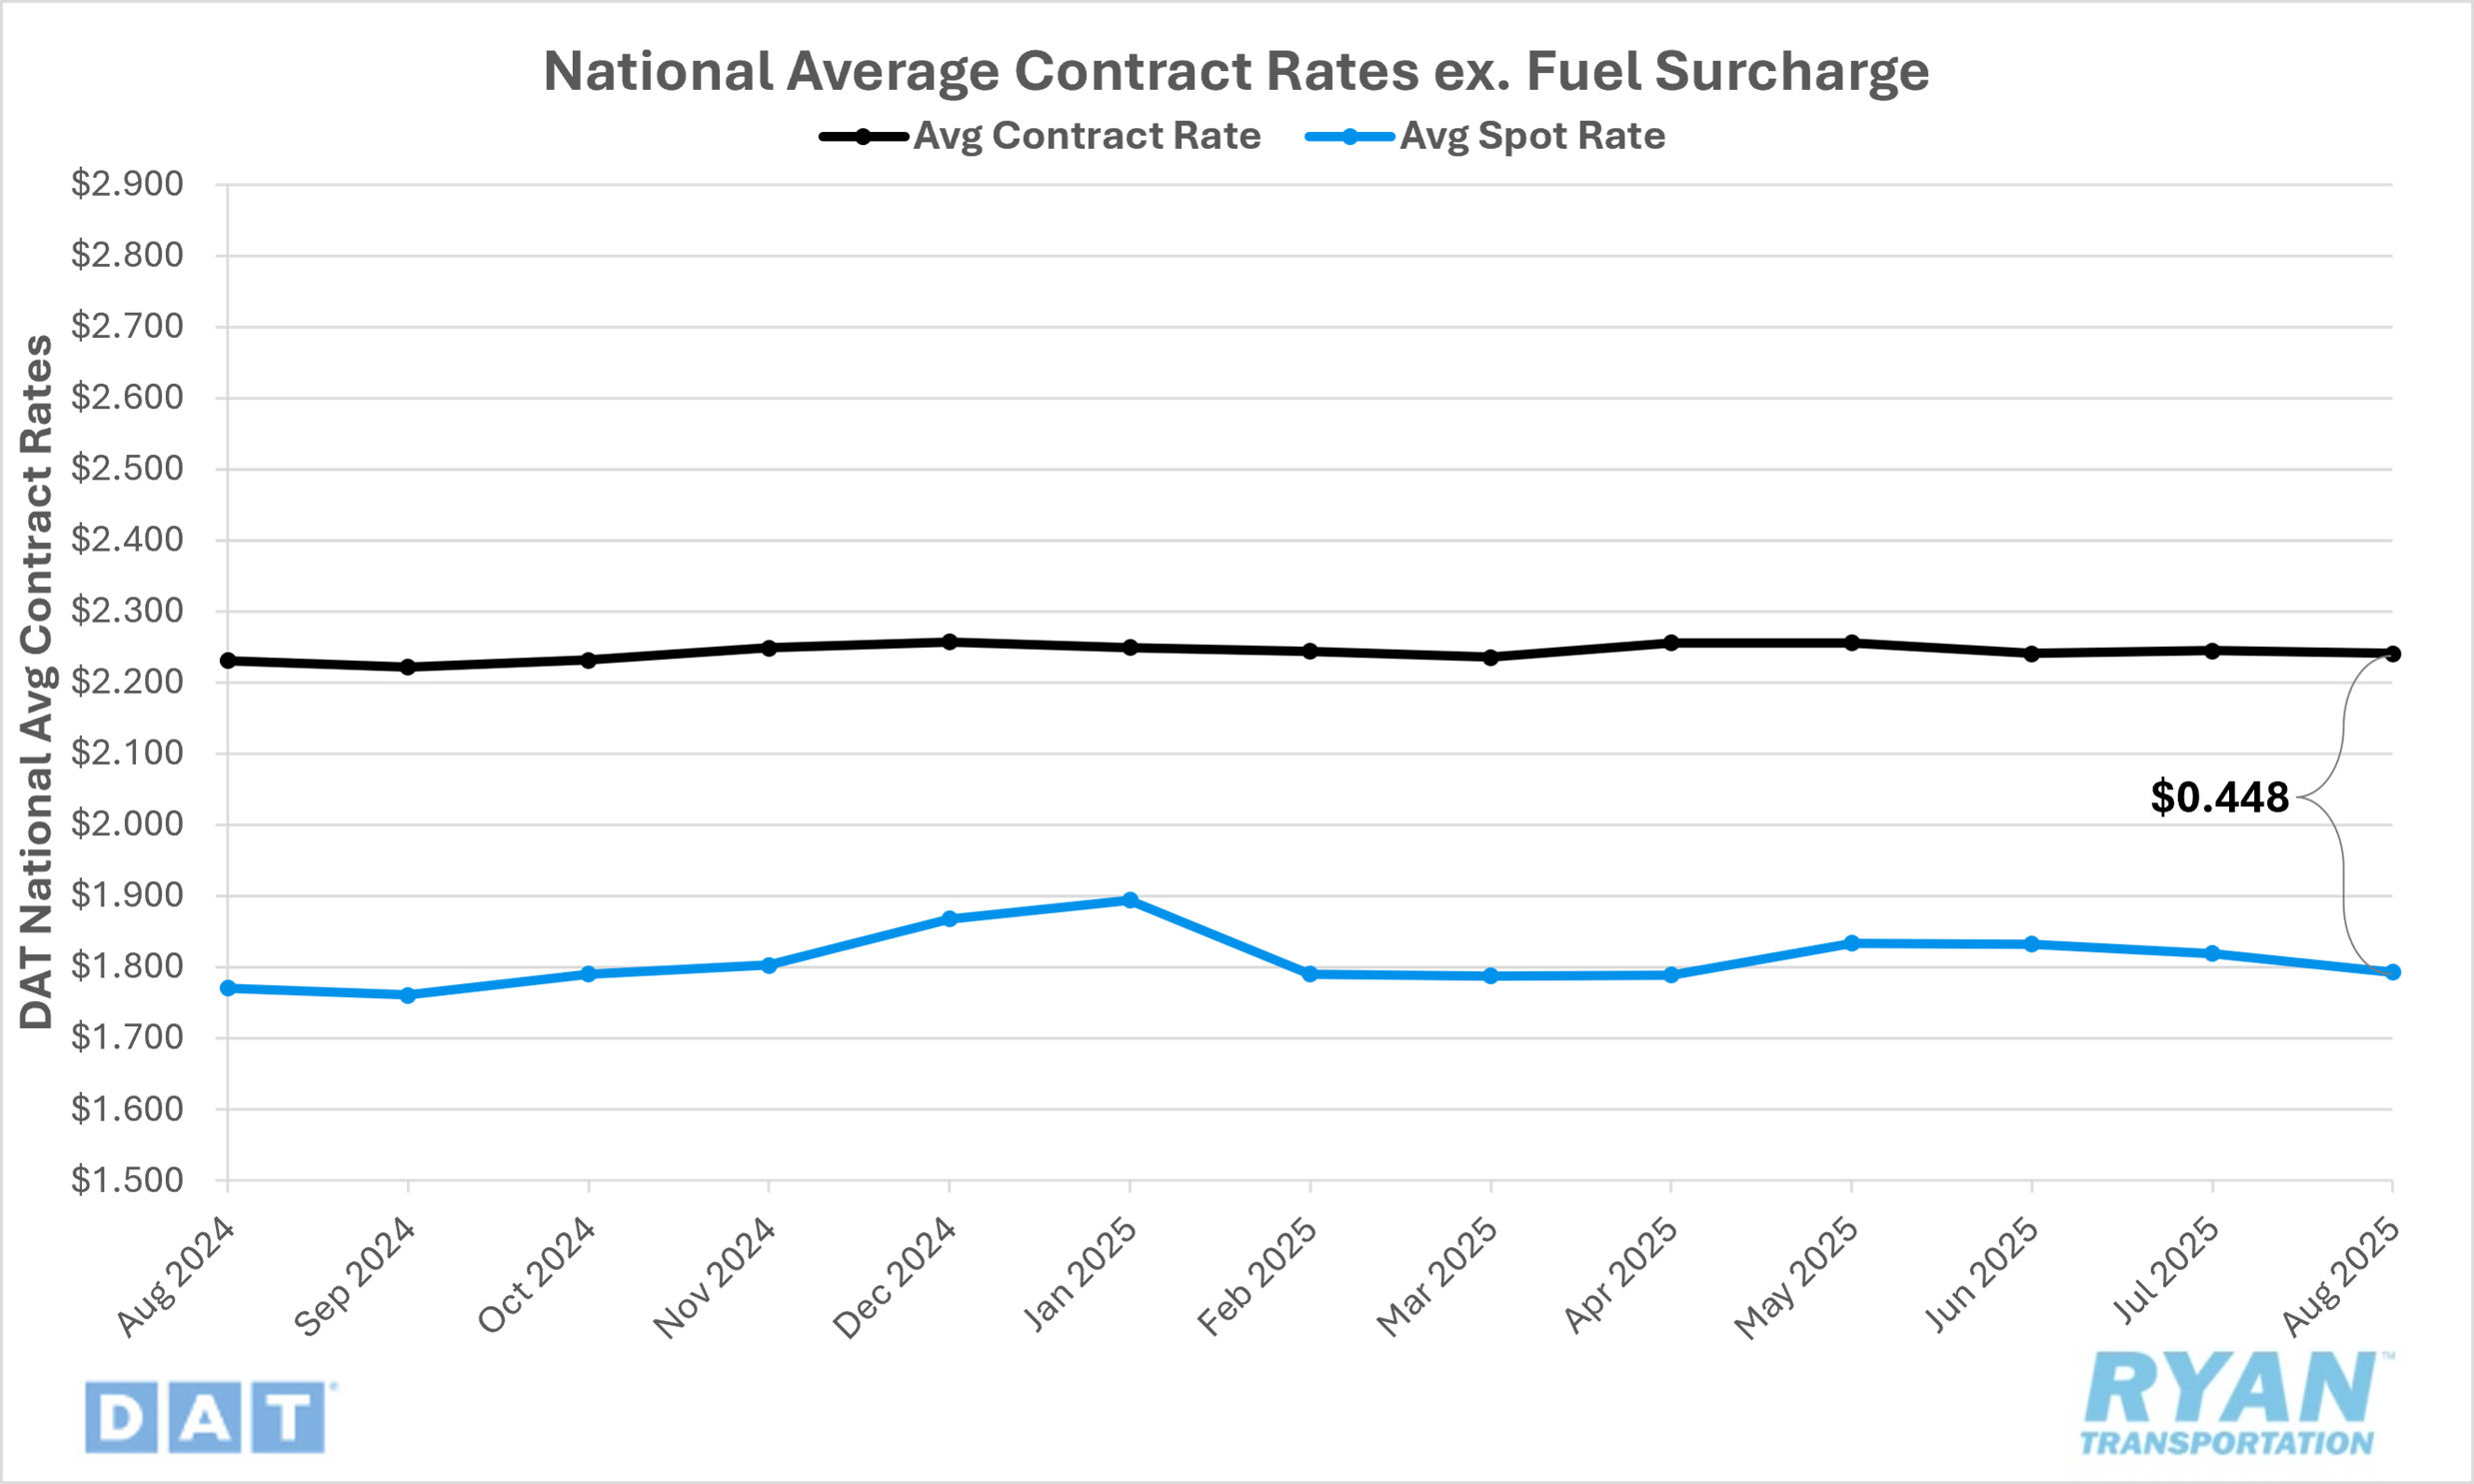
Initially reported average contract rates, excluding fuel, remained essentially unchanged in August, registering just 0.2% lower MoM, or roughly $0.01.
On an annual basis, initially reported average contract linehaul rates were up 0.7% YoY compared to August 2024.
The contract-to-spot spread registered slightly higher MoM in August, rising by just over $0.02 from $0.435 in July to $0.448.
Summary
National average spot rates declined for the third consecutive month in August, extending the retreat that began in June following the nearly $0.05 MoM increase recorded in May. On a seasonal basis, the $0.03 MoM decrease slightly underperformed the historical average August decline of just under $0.02. However, when compared with pre-pandemic trends, August’s rate movement was broadly consistent with historical norms. Despite the ongoing slide over the past three months, national average spot rates have not returned to the lows observed in March and April of this year. Moreover, rates have continued to trend above year-ago levels, with the annual gap widening over the past two months after narrowing back to parity in June.
Weekly movements, as tracked by the DAT 7-Day Average Spot Linehaul Rate Index, reflected a month characterized by volatility. Rates opened August nearly $0.02 lower WoW, before rebounding by more than $0.01 in the second week, nearly erasing the prior week’s decline. Rates then held relatively flat in the third week before climbing $0.03 WoW in the final week leading into the Labor Day holiday.
In the contract market, initially reported average linehaul rates, excluding fuel surcharges, remained largely flat for a second consecutive month. Following a $0.02 MoM decline in June, contract rates have stabilized, with the less than $0.01 MoM decline in August offsetting the modest gain reported in July. This continues a pattern of relative stability in the contract market over the past 18 months, during which average monthly rate movements have hovered around just $0.001. On an annual basis, contract linehaul rates remained above year-ago levels for the second straight month, marking only the sixth such occurrence in the past 36 months. Despite recent moderation, contract rates remain elevated relative to spot rates, with the spread continuing to trend above its long-term historical range.
Why It Matters
From a historical perspective, the decline in average spot rates in August aligned with typical seasonal patterns. However, such seasonal weakness generally follows notable rate increases earlier in the summer peak, which have been largely absent this year. As a result, the further deterioration in spot rates appears more concerning, reinforcing the notion that current market softness extends beyond seasonality.
In its most recent monthly outlook, FTR revised its 2025 forecast for total truckload rates (excluding fuel) slightly lower, now projecting a +1.6% YoY increase compared to +1.8% previously. Both spot and contract rates are expected to rise by +1.6% YoY, with spot forecasts revised downward from +2.0% and contract forecasts trimmed from +1.8%. At the equipment level, flatbeds are projected to perform best, with total truck rates up +1.5% YoY (down from +1.9%), followed by dry vans at +1.4% YoY (down from +1.6%). Refrigerated equipment is expected to lag, with rates forecast to increase only +0.6% YoY, slightly below the prior estimate of +0.7%.
Traditionally, spot rates receive a seasonal boost in September as imports tied to peak retail demand arrive and move inland. However, this year’s on-again, off-again tariff environment has resulted in many of those late-August/early-September imports already being stateside, essentially moving up the timeline of traditional peak season. Should that be the case, and it appears to be increasingly likely, it raises the possibility of a muted holiday shipping cycle for both truckload volumes and rates — barring a meaningful disruption to available capacity.
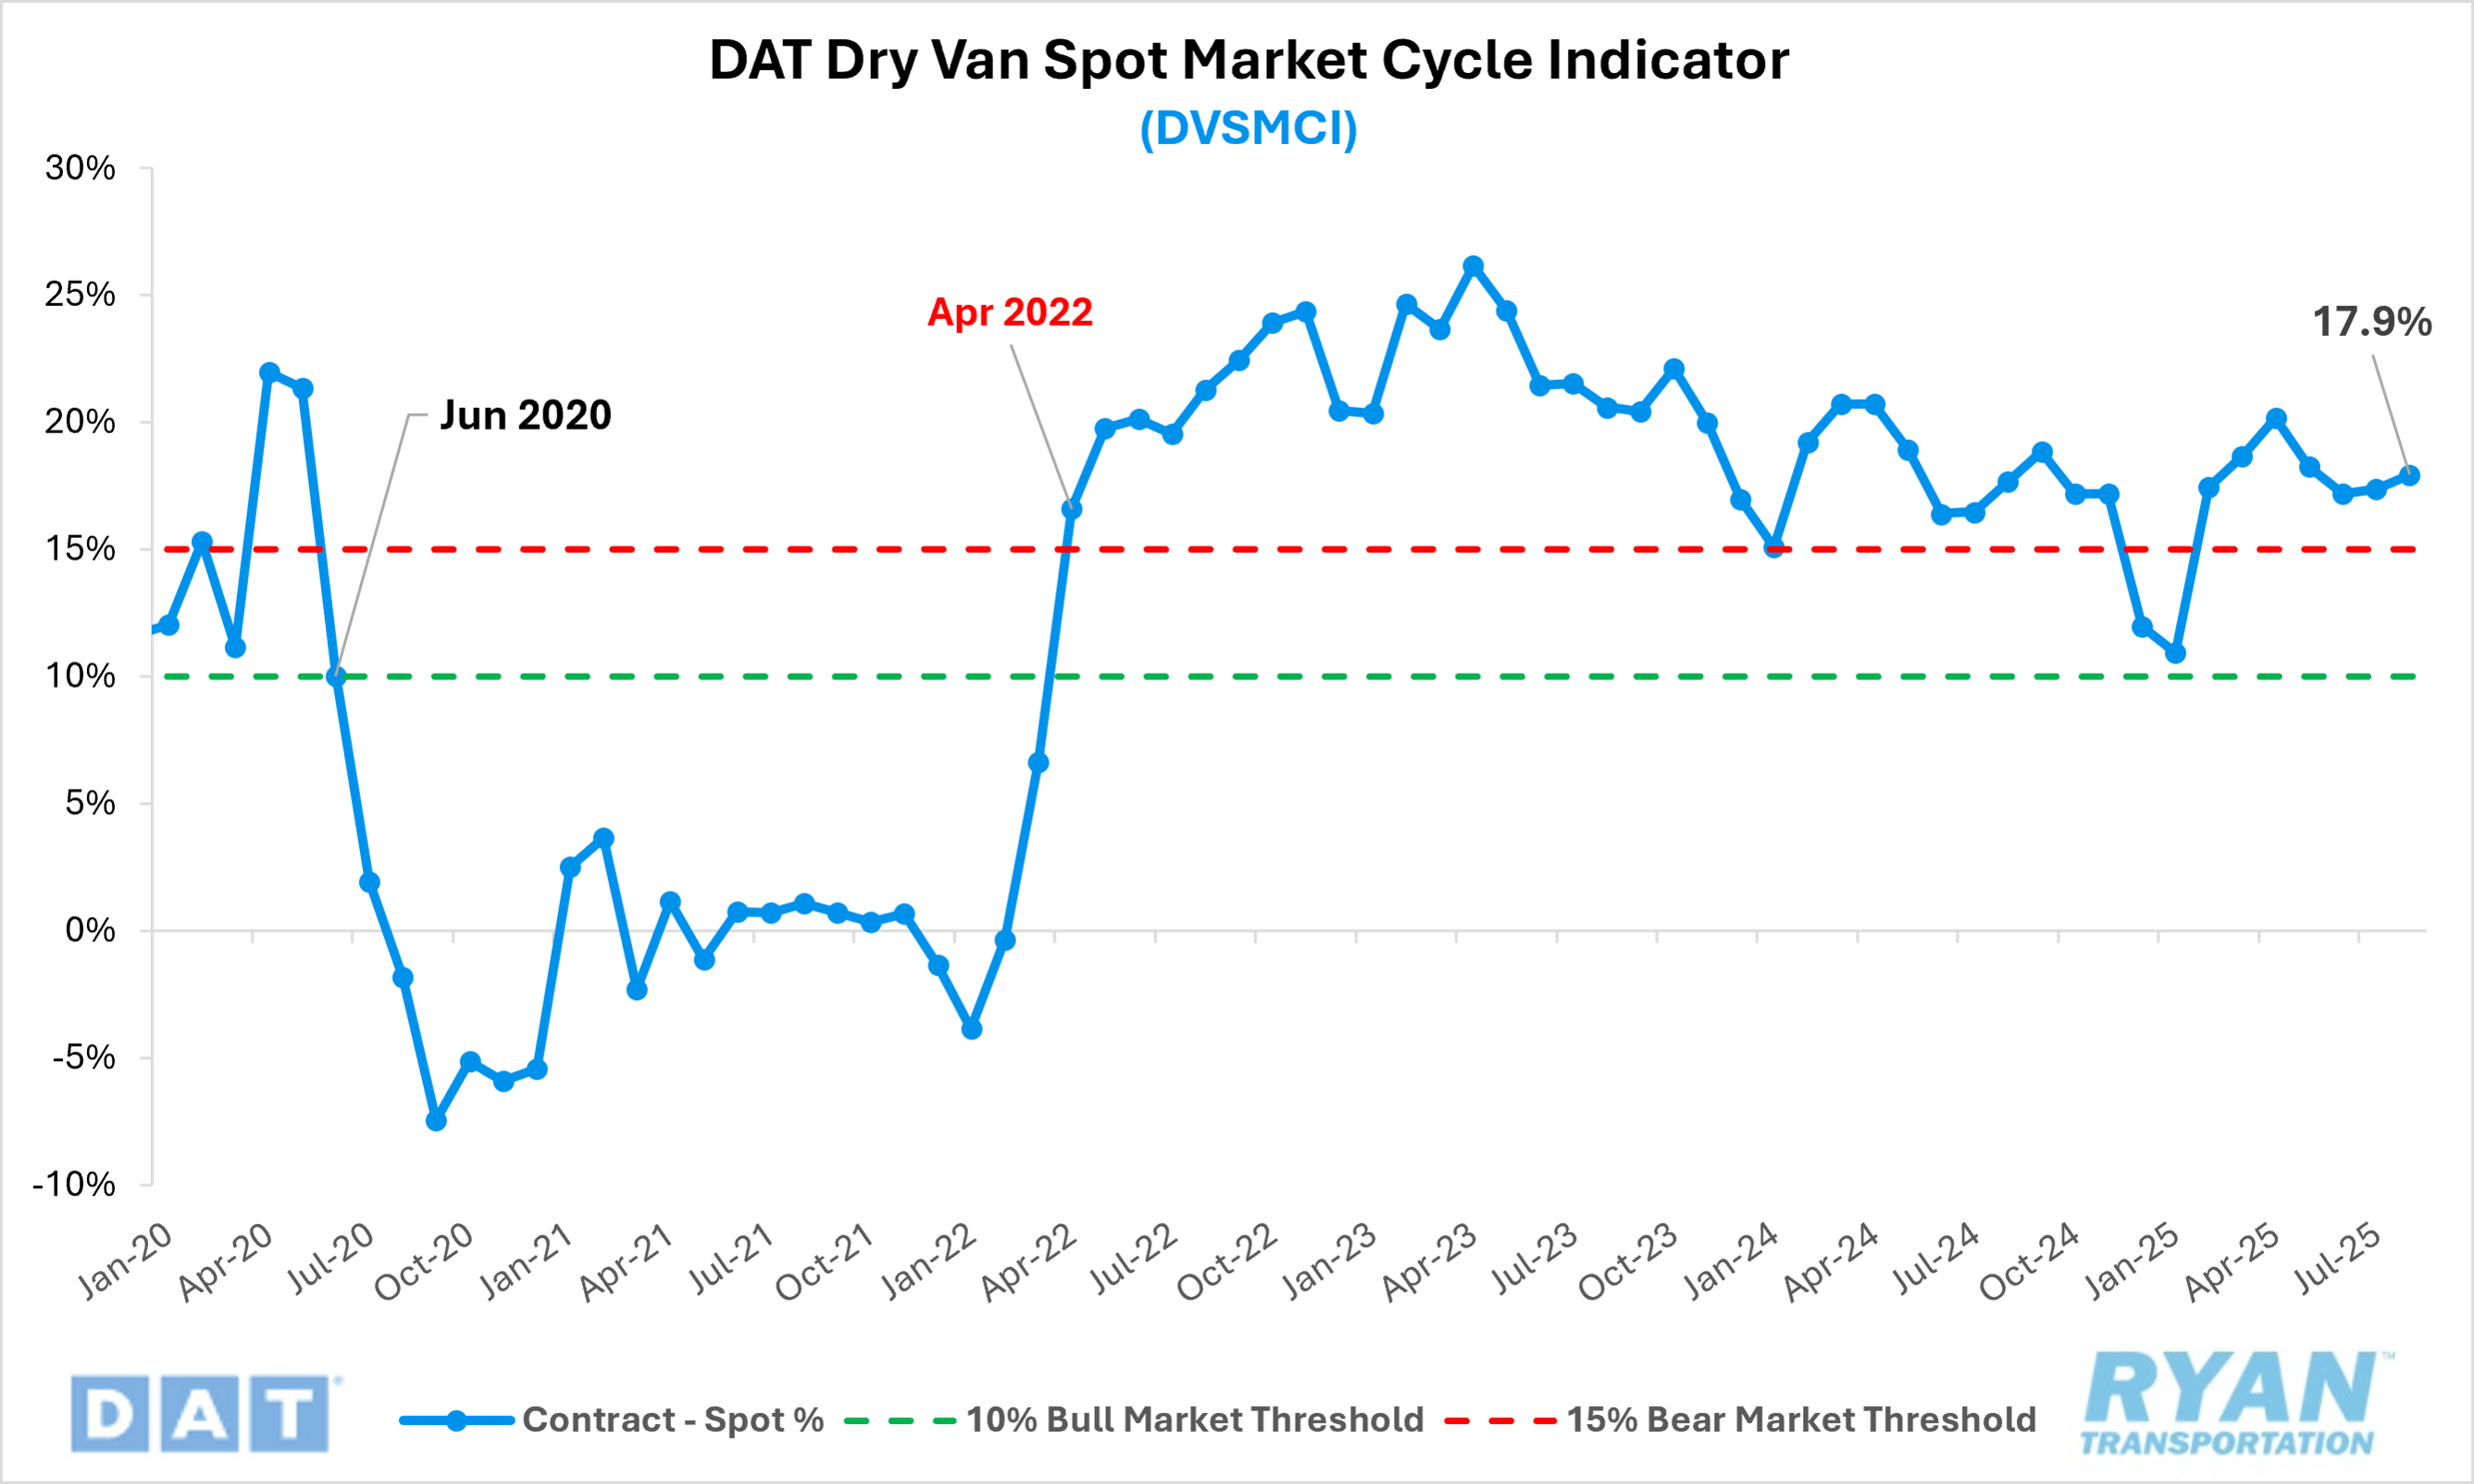
Even as the outlook for holiday season demand remains speculative, rate levels remain firmly entrenched in bearish territory. The latest reading of the DAT Dry Van Spot Market Cycle Indicator (DVSMCI) climbed for the second consecutive month in August, increasing 0.5 percentage points to 17.9% from 17.4% in July. According to Dr. Jason Miller of Michigan State University, who developed the index, the DVSMCI tracks the spread between spot and contract rates relative to the average between the two. Sustained readings above 15% are indicative of bearish market conditions, while readings below 10% signal a more bullish environment.