Back to September 2025 Industry Update
September 2025 Industry Update: Truckload Demand
Pre-Labor Day shipping activity propped up overall freight demand for the month, following softer volumes to start the month.
Key Points
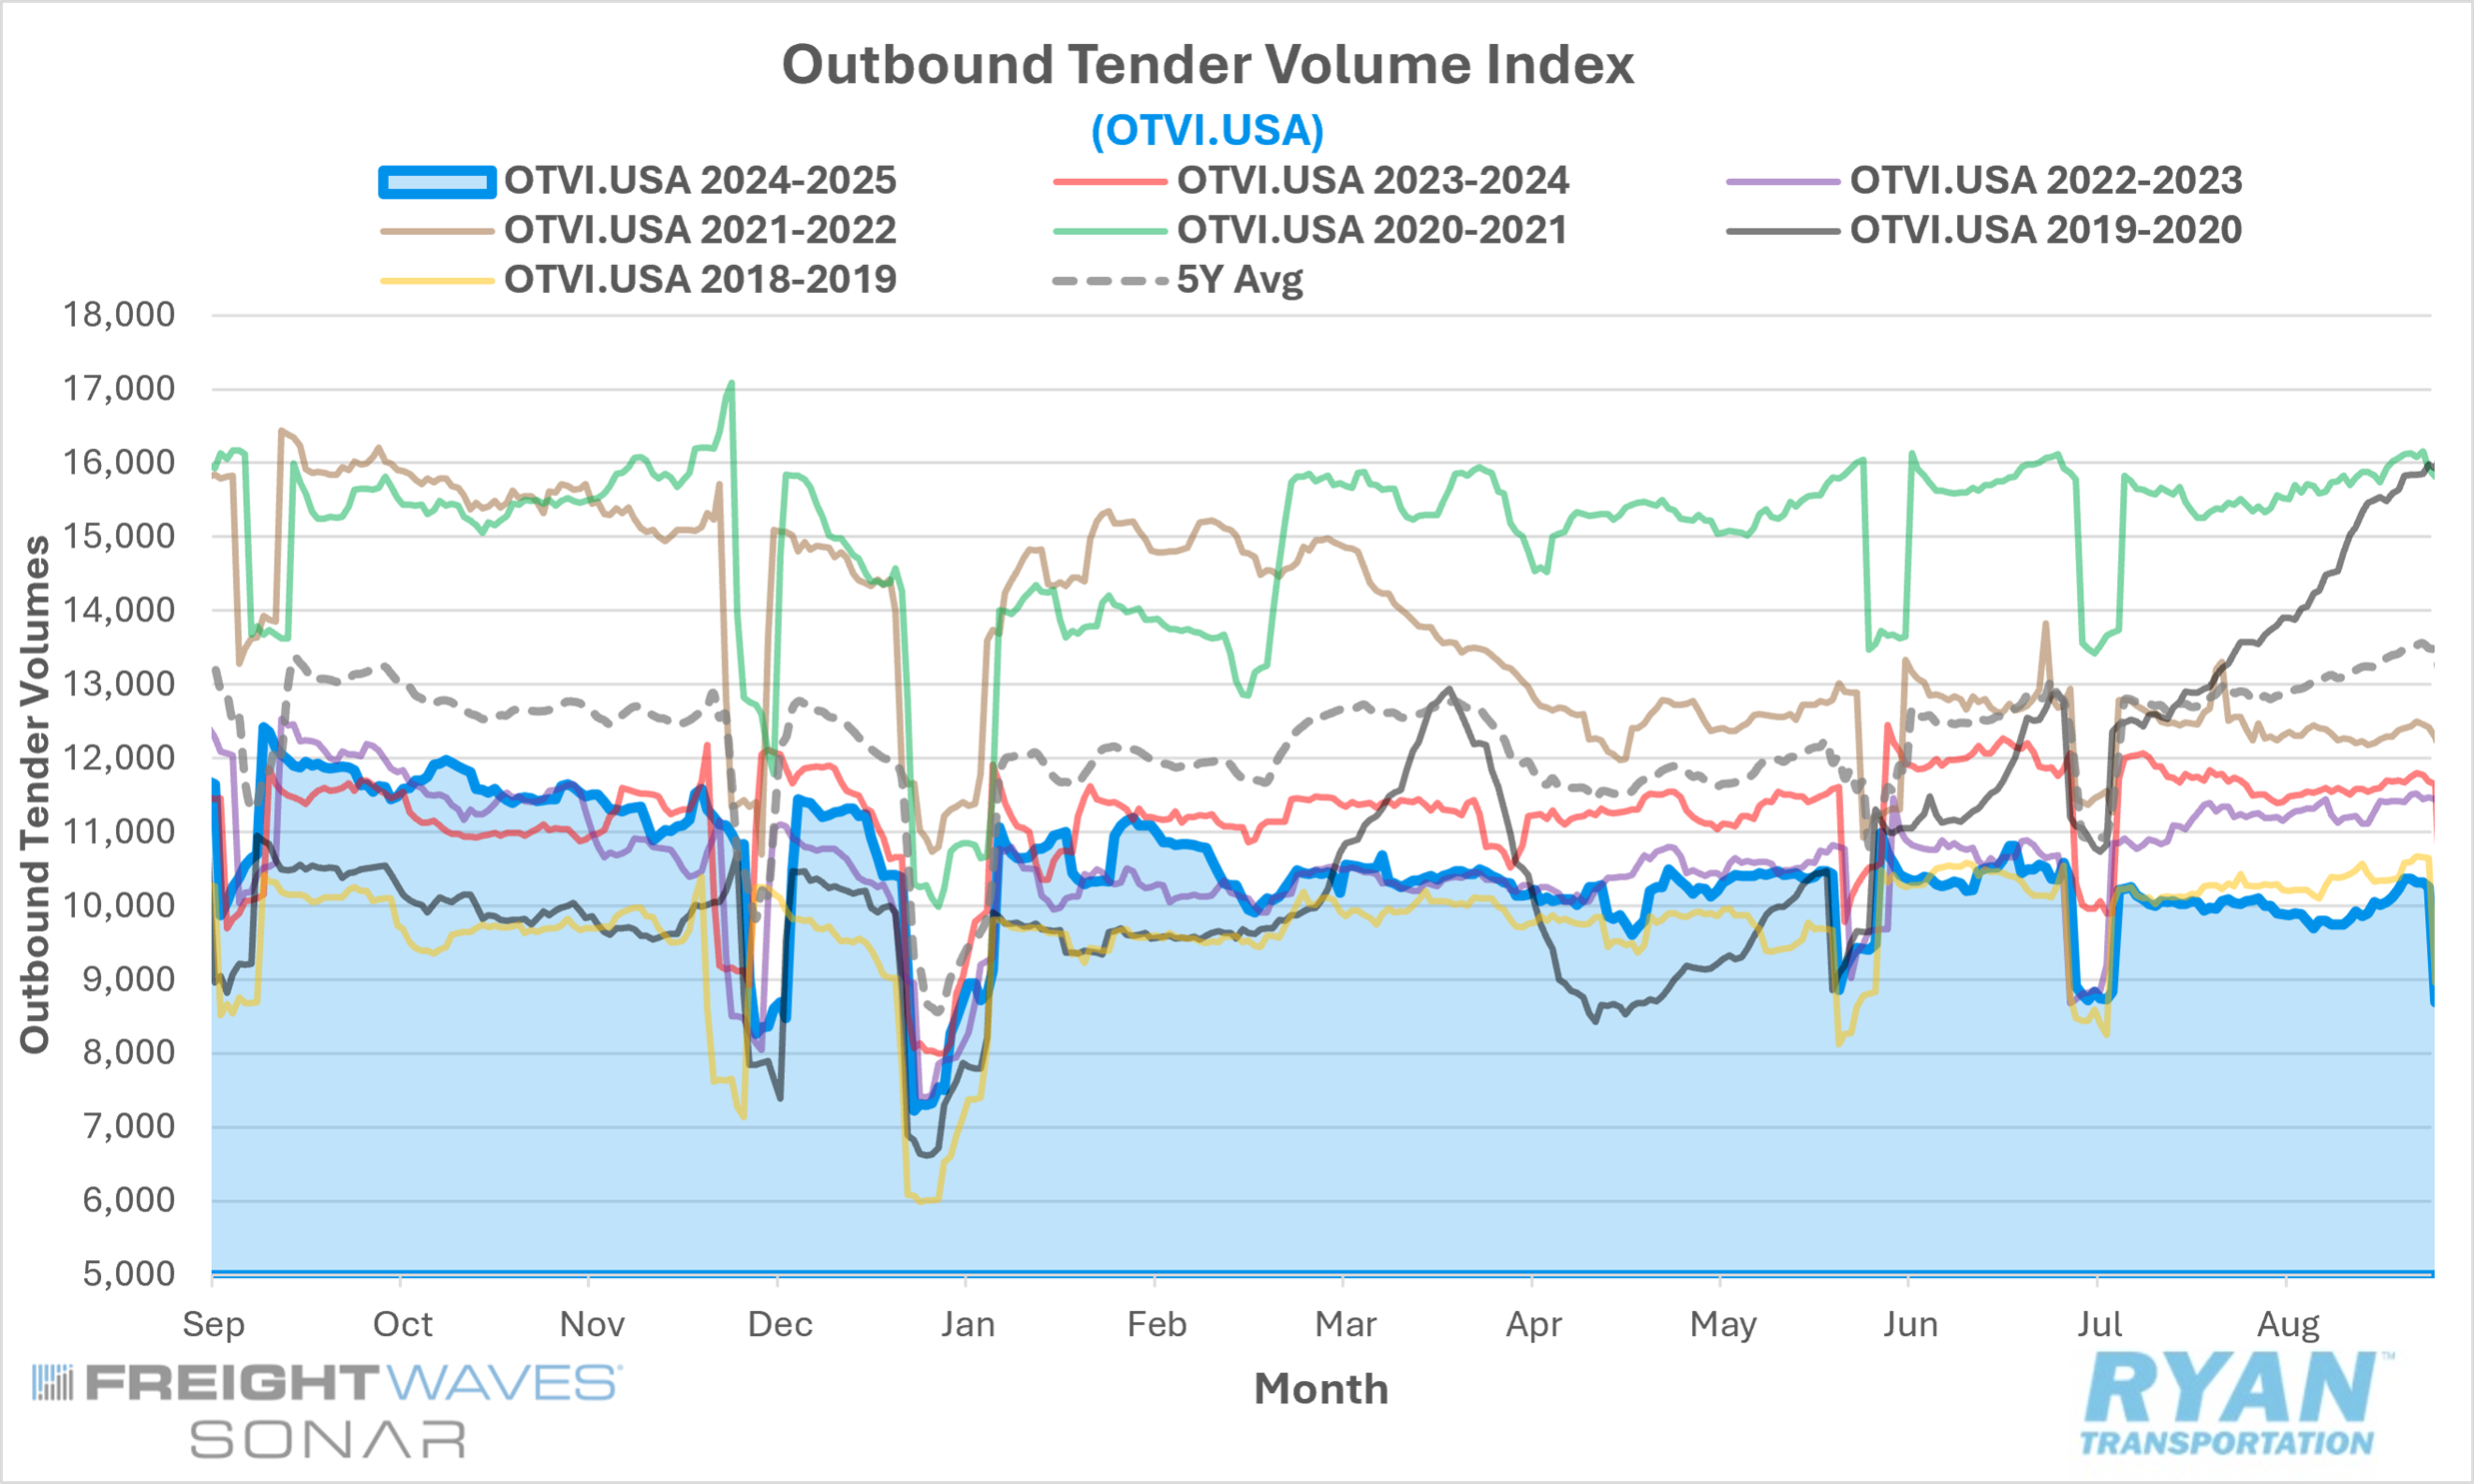
The FreightWaves SONAR Outbound Tender Volume Index (OTVI.USA), a measure of contracted tender volumes across all modes, registered a 2.3% increase MoM in August compared to July, rising from 10,033.33 to 10,261.28.
The monthly average of daily tender volumes in August rose 1.8% MoM compared to July, increasing from 9,817.00 to 9,990.29.
Compared to August 2024, average daily tender volumes were down 13.7% YoY and 23.9% below the 5-year average.
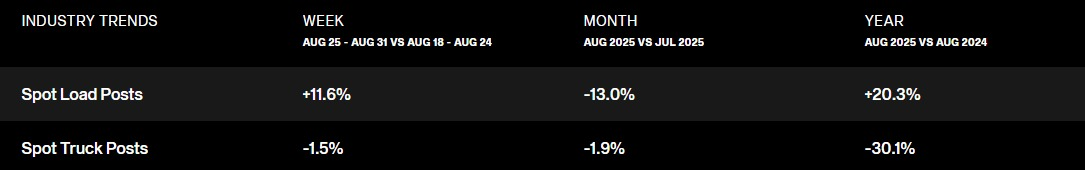
Spot market activity contracted sharply in August, dropping 13.0% MoM, but remained above year-ago levels by 20.3% YoY.
The Cass Transportation Index Report, a measure of U.S. freight activity that tracks shipment volumes and expenditures across all domestic transportation modes, reflected consistent declines MoM across both metrics in July of 1.8% and 1.5%, respectively, while annual comparisons were mixed, with shipments falling 6.9% YoY, while expenditures were up slightly by 0.4% YoY.
Summary
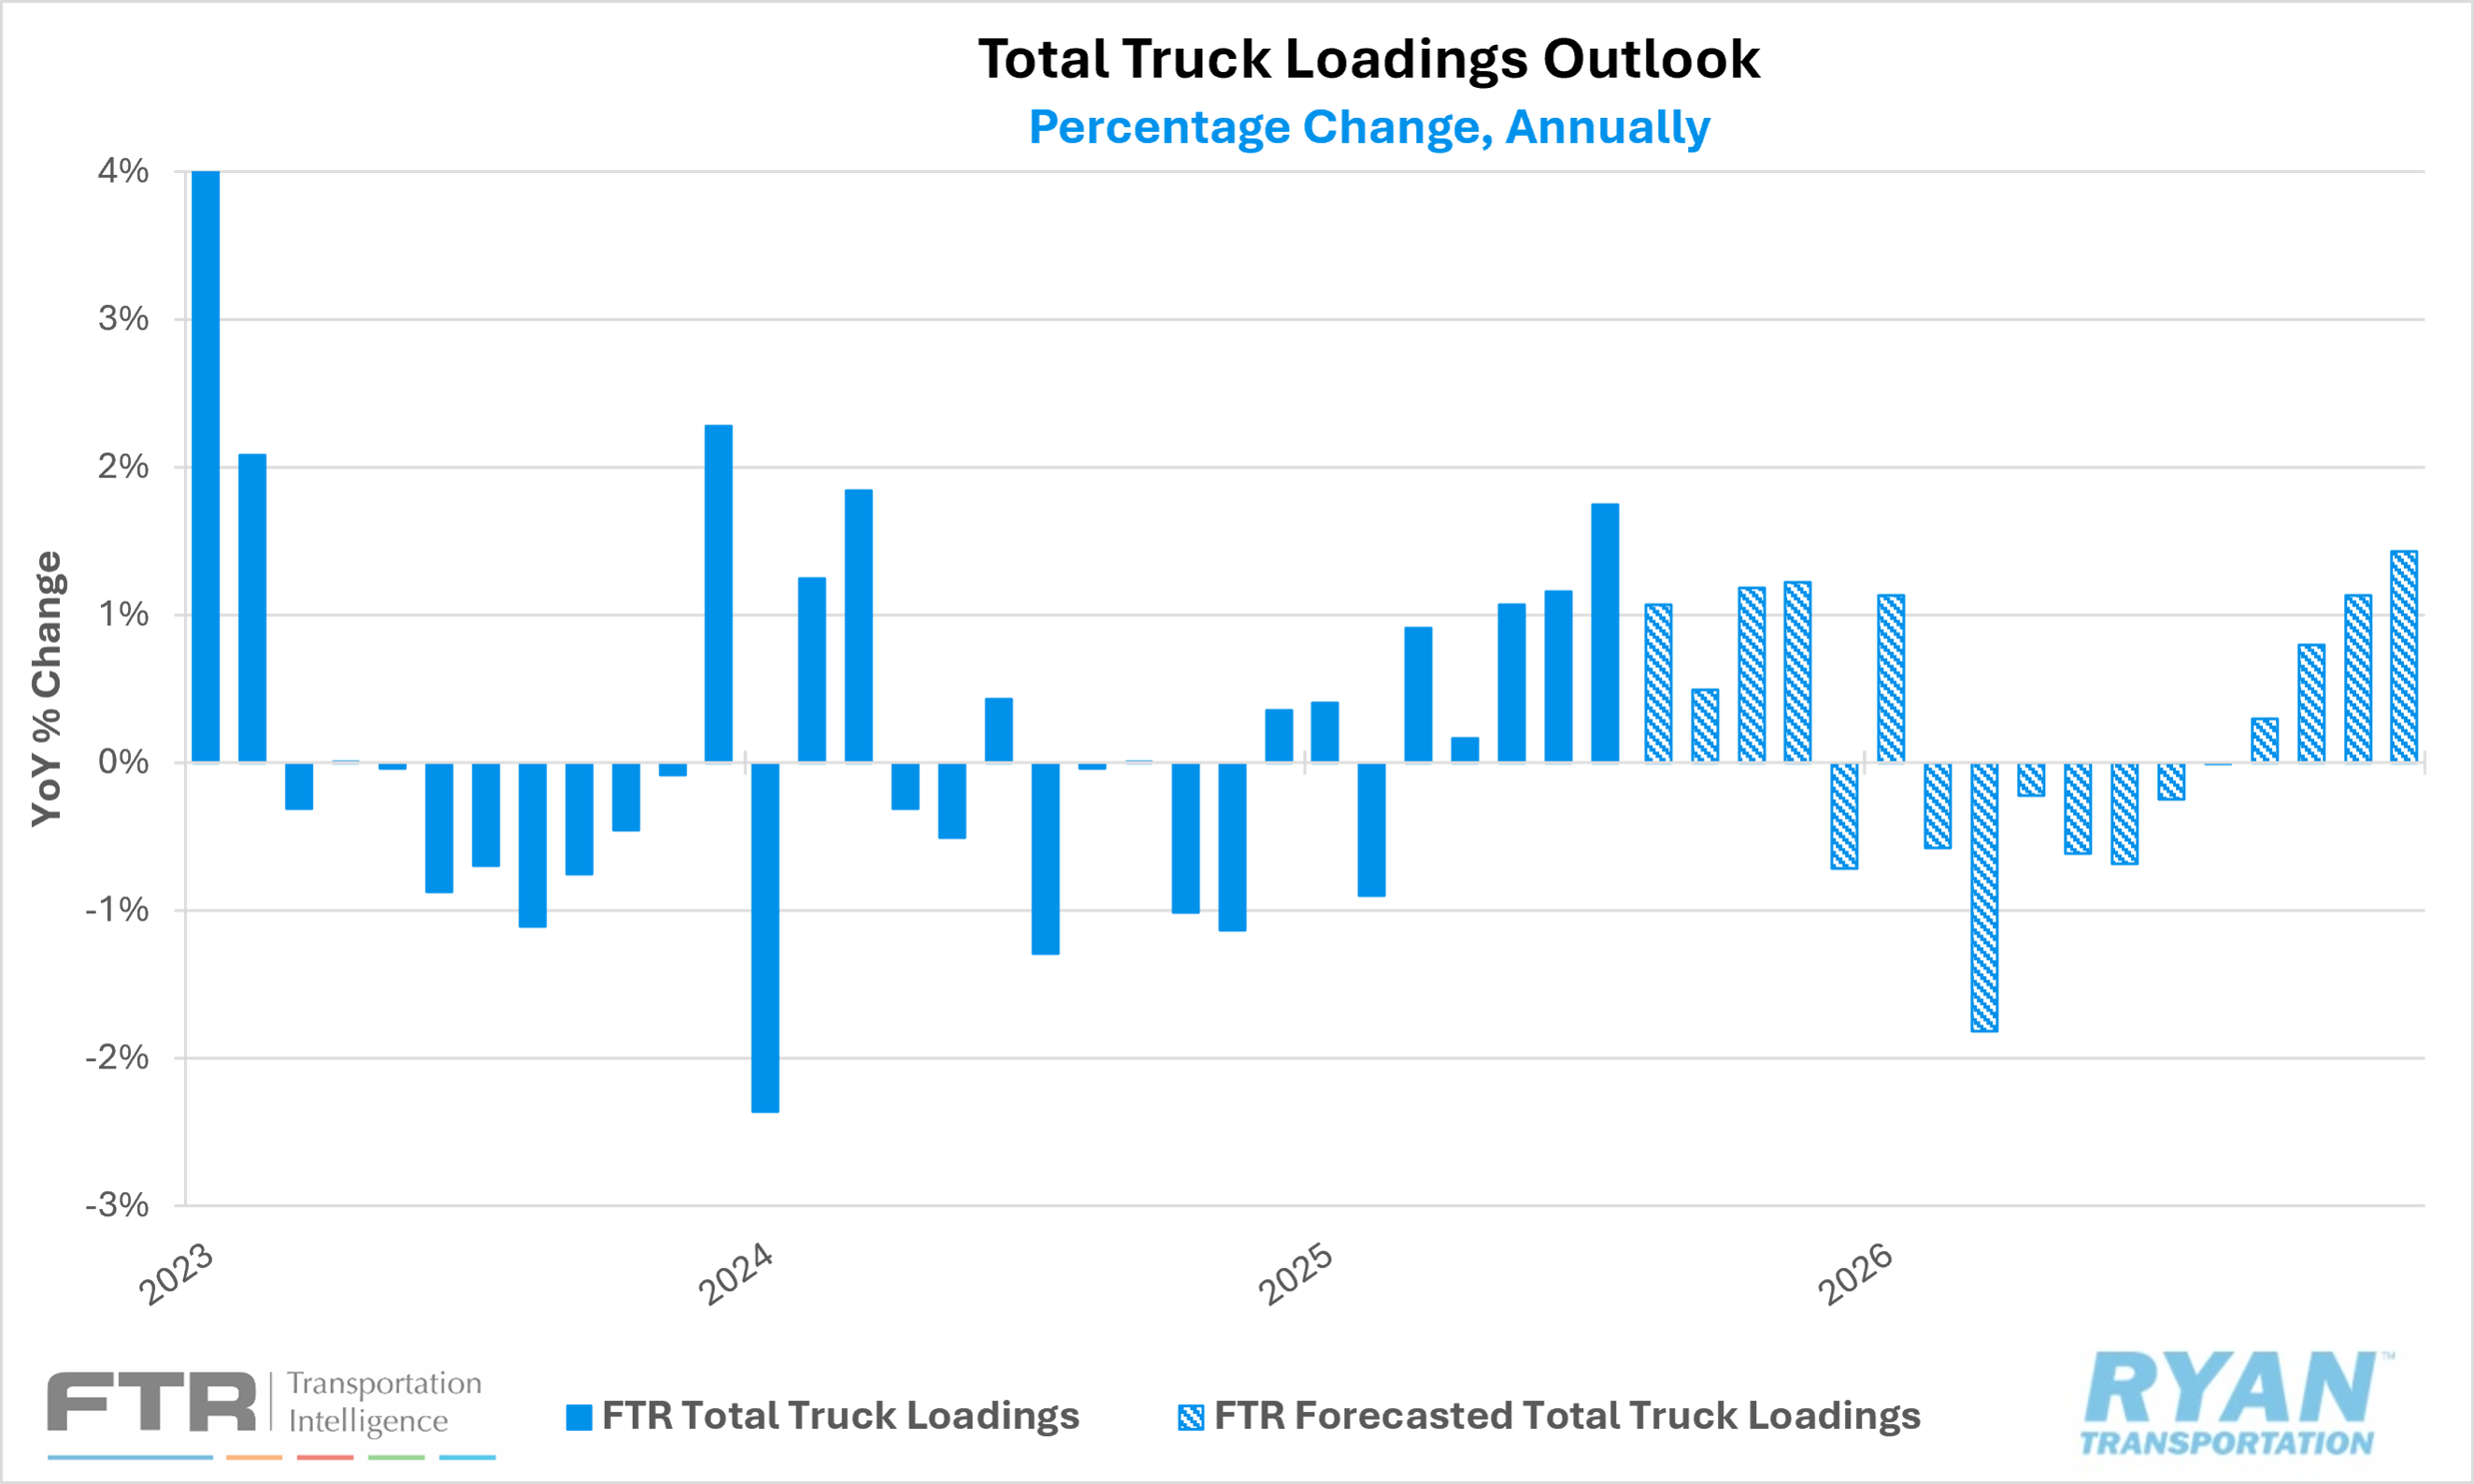
Following an unseasonal decline in July, truckload volumes registered moderate gains in August but continued to underperform relative to historical seasonal benchmarks. Average daily tender volumes increased 1.8% MoM, well below the typical 5.8% seasonal increase for August. Despite this modest monthly improvement, freight demand remained weak on a comparative basis, with annual volumes trailing year-ago levels for the ninth consecutive month.
On a weekly basis, demand trends were bifurcated between the first and second halves of the month. During the first two weeks, shipping activity softened, with the FreightWaves SONAR Outbound Tender Volume Index (OTVI) falling a cumulative 3.7%. In contrast, the latter half of the month saw a recovery, with volumes edging 0.6% higher WoW before surging 4.7% WoW in the final week leading up to the Labor Day holiday.
By equipment type, August’s gains translated into a 3.1% MoM increase in dry van activity, a 6.5% MoM rise in reefer volumes, and a 1.7% MoM improvement in flatbed demand. Annual comparisons, however, remained mixed. Dry van and flatbed volumes were down sharply, falling 15.8% and 13.9% YoY, respectively, while reefer volumes stood out as a relative bright spot, climbing 12.3% YoY.
The latest Cass Transportation Index Report reinforced the broader softness in freight demand. The shipments component of the index declined 1.8% MoM on a nominal basis and 1.7% MoM on a seasonally adjusted basis in July. On an annual basis, shipments fell 6.9% YoY, following a 2.4% YoY decline in June. The report noted that under normal seasonal conditions, shipment volumes would be expected to decline by roughly 8% YoY in August; however, the surge in imports recorded in July could mitigate the scale of the anticipated decline.
Why It Matters
Freight demand improved modestly in August, aided by a last-minute surge from shippers moving promotional products ahead of the Labor Day holiday. While this uptick offered a temporary reprieve following July’s sharper-than-expected contraction, the truckload industry remains mired in a prolonged freight recession. For carriers navigating these uncertain conditions, August’s gains provided some relief, though underlying fundamentals suggest little evidence of a sustainable recovery in the near term.
As noted in prior updates, demand growth in the for-hire sector continues to face structural challenges, including share loss to rail providers, the ongoing expansion of private fleets and persistently elevated inventory levels. The latest release of the Logistics Managers’ Index (LMI) indicated that the Inventory Levels Index rose 2.7 points MoM to 58.2%, signaling an accelerated pace of expansion. A noteworthy development within this increase was the balance observed between upstream and downstream firms. Unlike prior months, when upstream firms reported outsized growth, August data showed nearly identical expansion across both ends of the supply chain. This suggests that the surge in imports earlier this year has been more evenly distributed, with downstream firms positioning goods closer to the retail level ahead of the back-to-school and holiday shopping seasons.
Nonetheless, early indicators suggest that much of the year’s import volume has already arrived, raising concerns about softness in the months ahead. Chinese export activity surged 7.2% in July, yet domestic factory output declined, pointing to front-loaded orders earlier in the summer. In addition, global ocean bookings fell sharply, down roughly 23% by late August from their early July peak. This early peak occurred ahead of typical seasonal patterns, in which U.S.-bound bookings usually crest in August, followed by inbound shipment peaks in September.
The extent to which weaker imports will affect for-hire truckload demand remains debated, with analyst estimates ranging from 10% to 25% of truckload volumes tied directly to imports. However, the more pressing concern lies in consumer spending, the single largest driver of domestic shipping activity. According to the University of Michigan’s Survey of Consumers, U.S. consumer sentiment declined 5.7% MoM in August to 58.2%, down 14.3% YoY from August 2024 levels. Much of this deterioration reflects growing concern over household finances and the expectation of higher prices due to tariffs. While a Goldman Sachs analysis found that U.S. businesses have absorbed the majority of tariff costs to date — passing on only 22% to consumers — several large retailers have already announced price increases tied to tariff-related expenses, leading Goldman Sachs to predict those tariff pass-throughs could rise to roughly 67% by as early as October. These additional financial pressures on households pose a significant risk to spending in the critical holiday shopping period, with likely negative implications for for-hire truckload volumes heading into year-end.