Back to September 2025 Industry Update
September 2025 Industry Update: Reefer
Seasonal shifts in harvesting to the north helped prop up the refrigerated sector in August, offsetting the muted output in produce volumes this year and keeping rates relatively flat compared to July.
Spot Rates
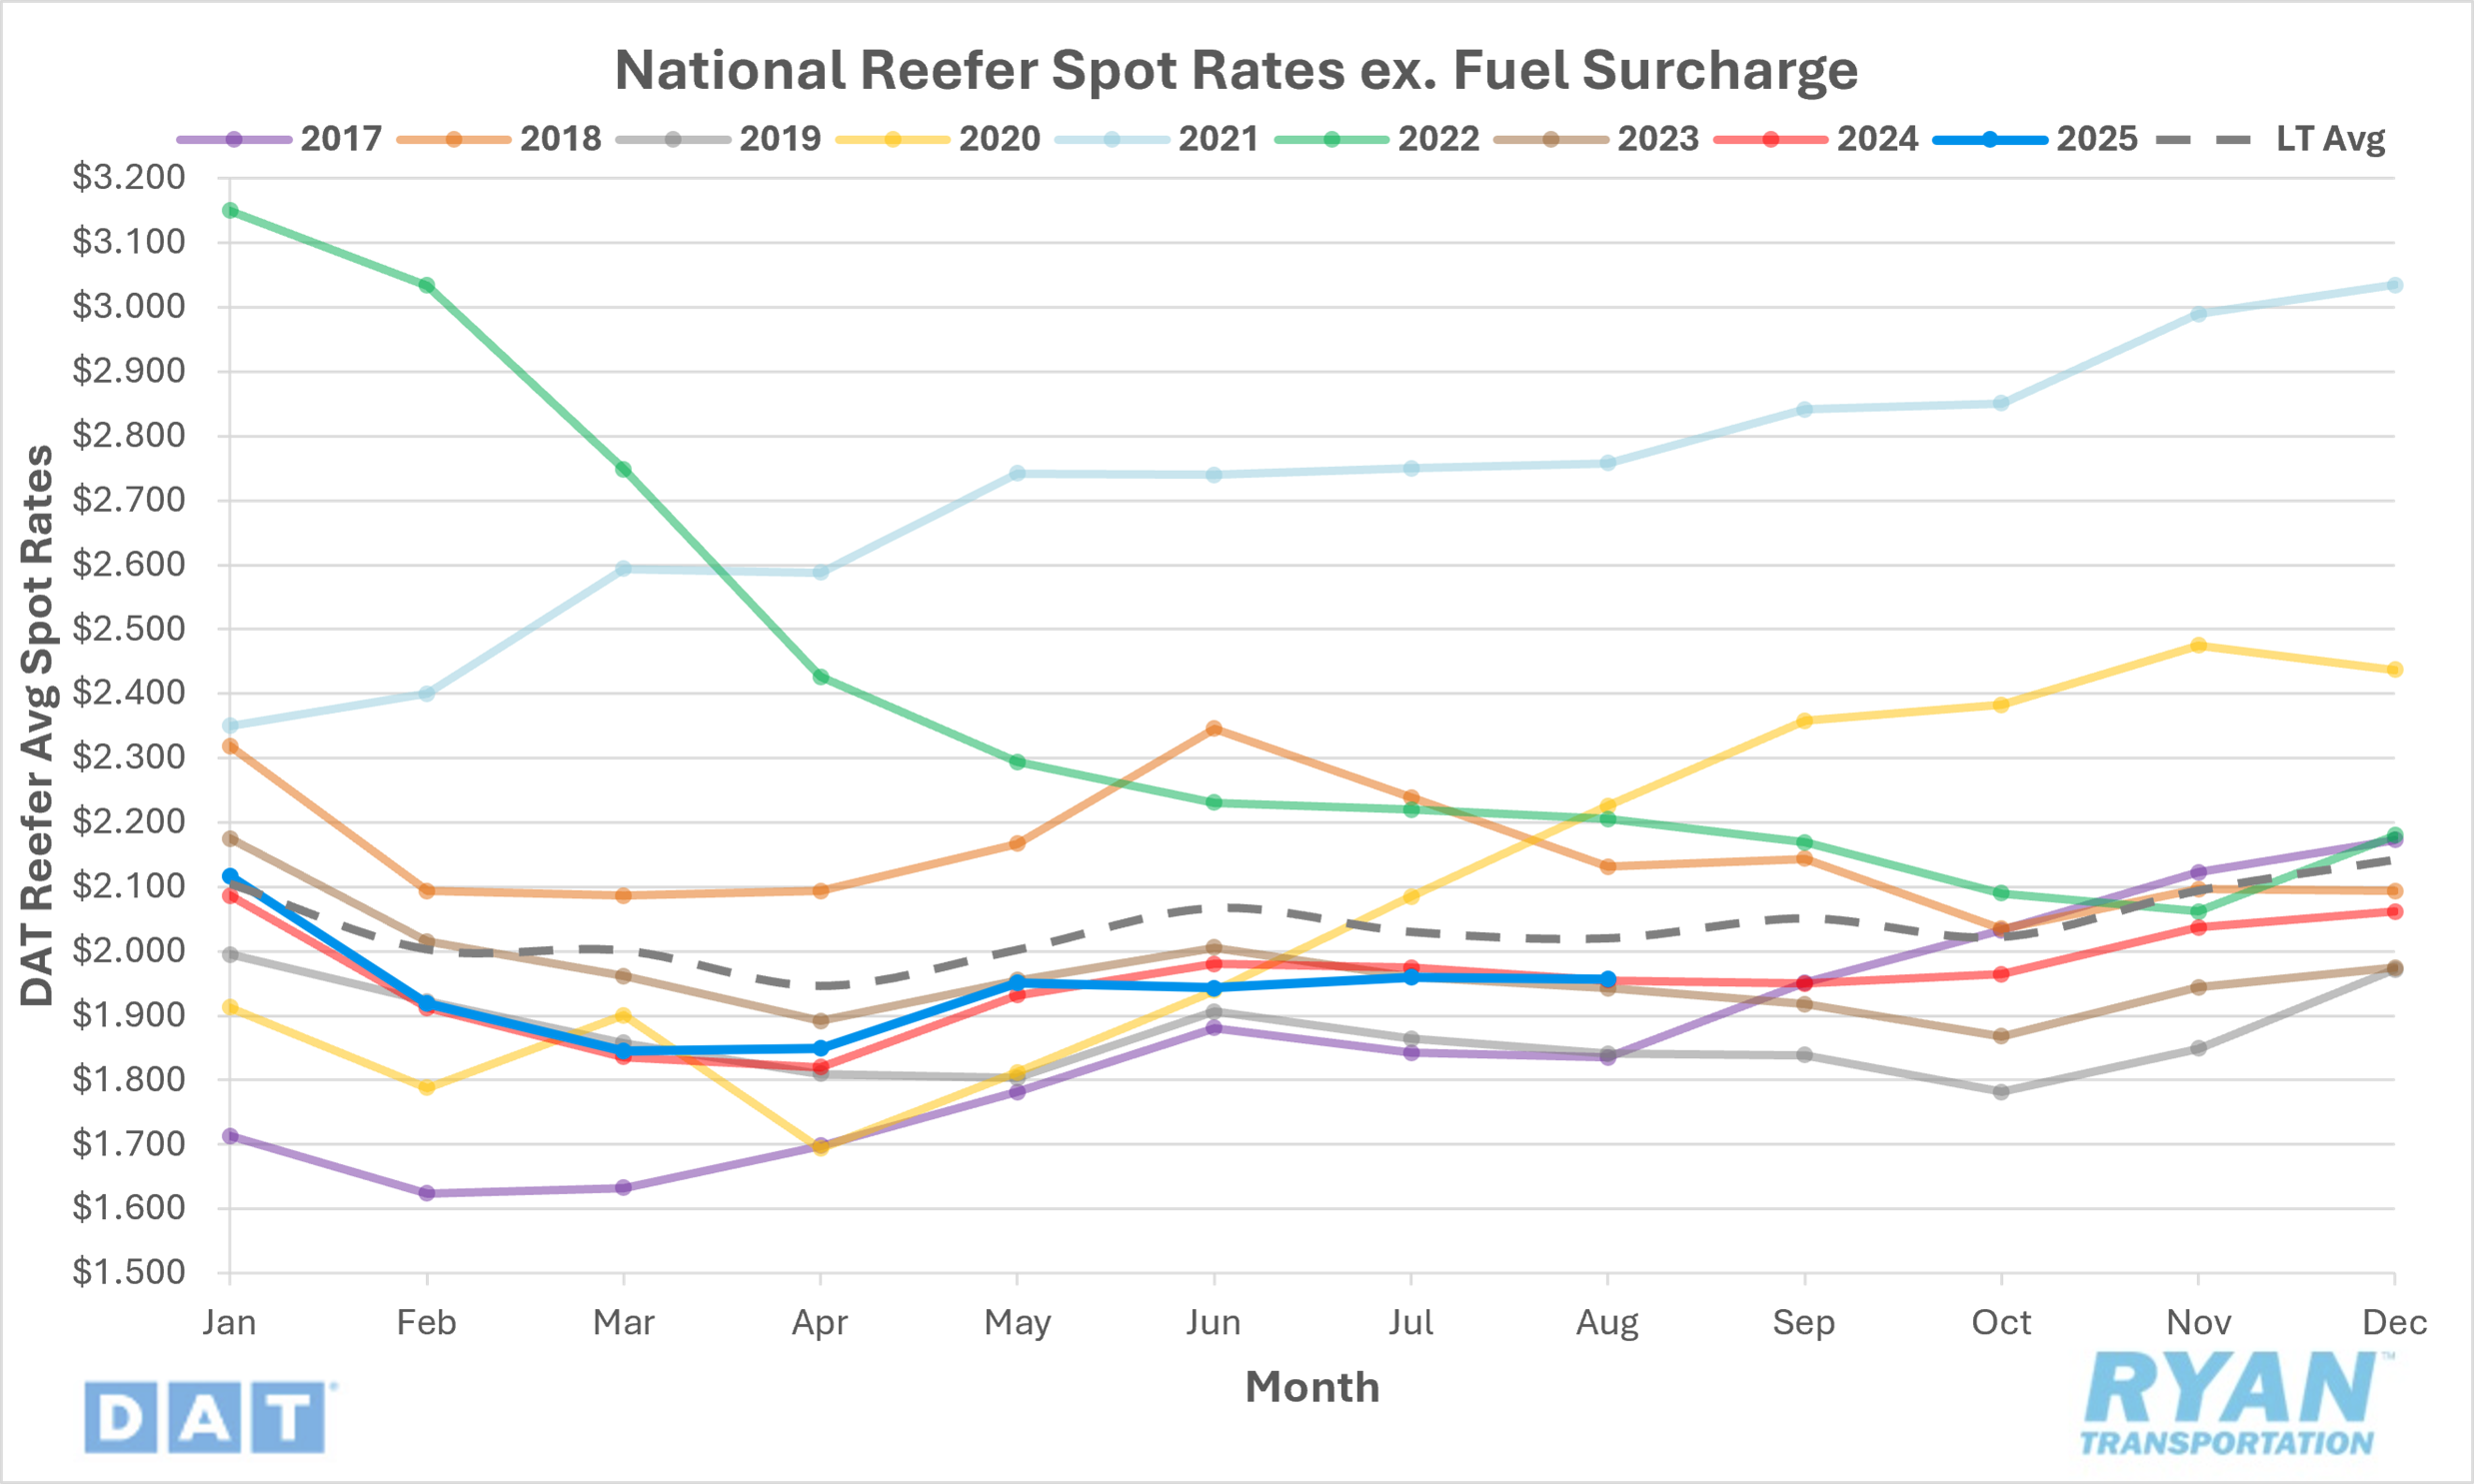
Key Points
- The national average reefer spot rate, excluding fuel, was virtually unchanged in August from July, dropping by a fraction of a penny to just under $1.96.
- On an annual basis, average reefer spot linehaul rates were nearly identical compared to August 2024 levels, registering slightly higher by 0.1% YoY, and were 3.9% below the LT average.
- Initially reported average reefer contract rates, exclusive of fuel, fell 1.0% MoM in August but were down slightly by 0.3% YoY compared to the same month last year.
Load-to-Truck Ratio
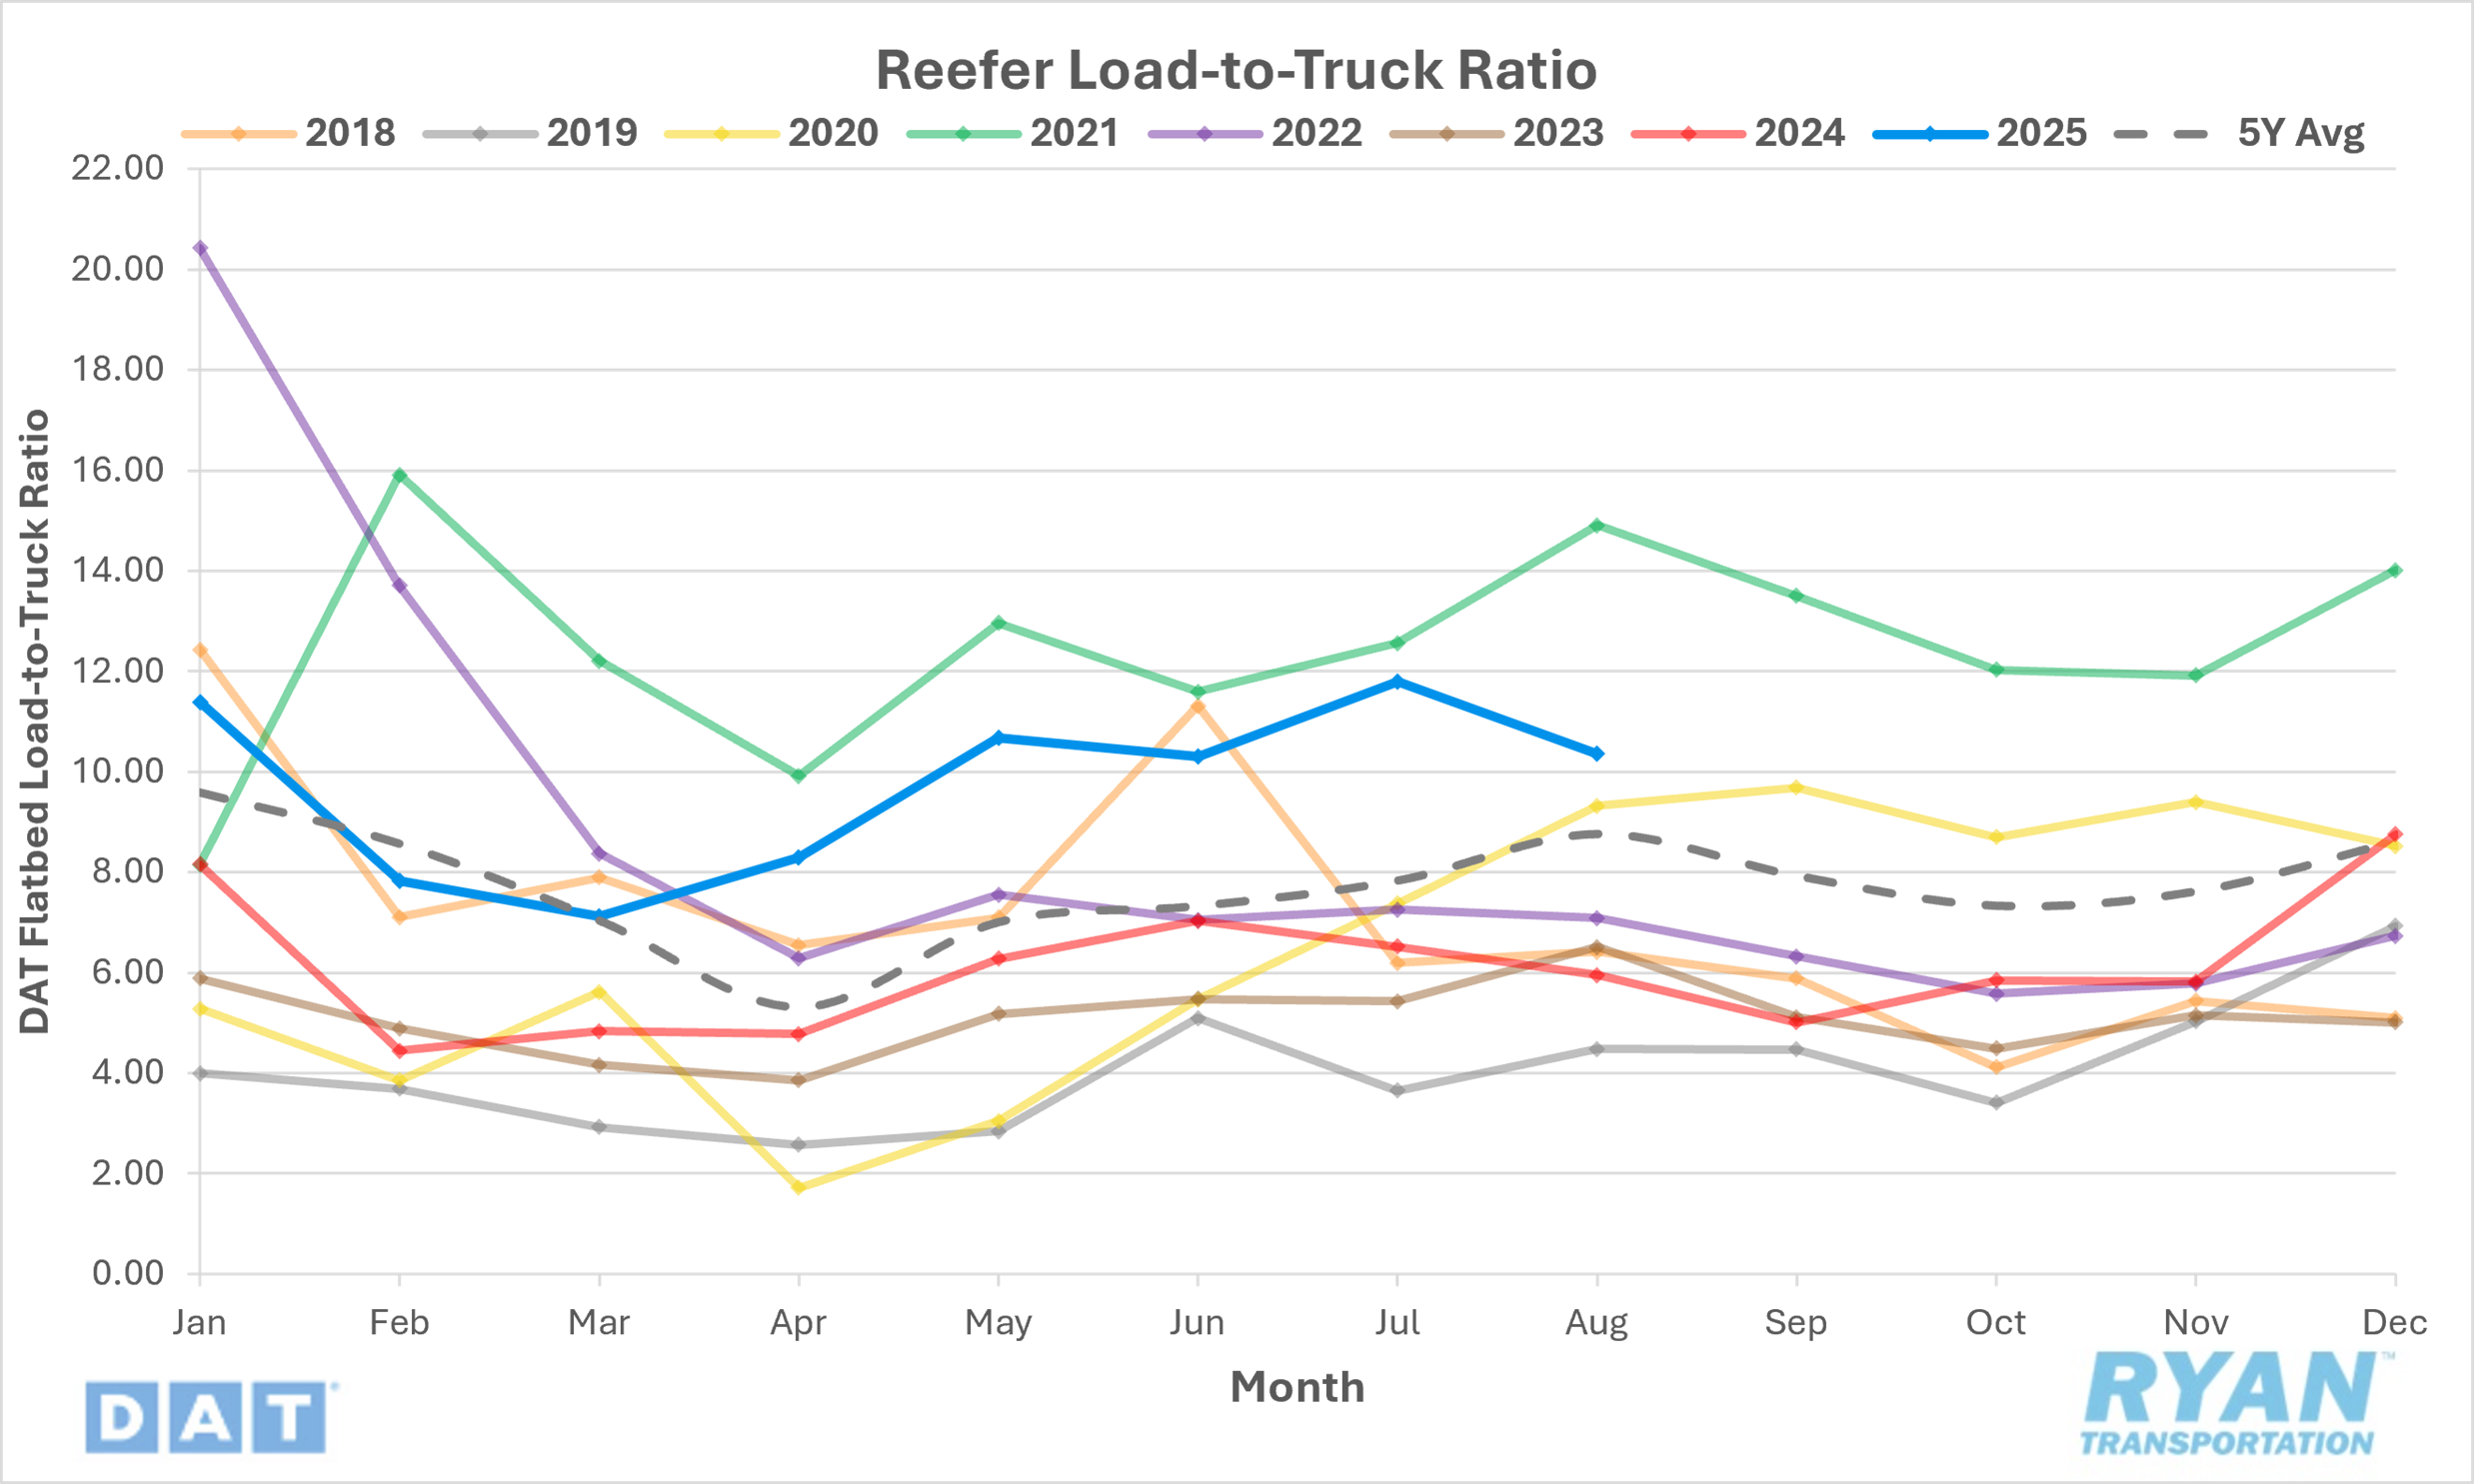
Key Points
- The reefer LTR fell 12.2% MoM, dropping from 11.8 in July to 10.36 recorded in August.
- Compared to August 2024, the reefer LTR was up 74.1% YoY and remained 18.3% above the 5-year average.
- DAT load board data for August recorded a 12.9% MoM decline in load posts compared to July, while truck postings were down just 0.8%.
Market Conditions
Reefer Summary
Refrigerated freight demand in August was supported by seasonal produce movements, particularly in apples and blueberries, though broader cost and demand pressures continue to weigh on the sector. Apples recently rose to the top of the USDA’s commodity list, accounting for roughly 12% of national truckload volume. California production is approaching its annual peak, with growers projecting 60 million pounds of apples for the fresh market in 2025, up from 49.1 million pounds in 2024. California’s early Gala crop has enjoyed a competitive advantage by reaching markets ahead of Washington’s larger but carryover-burdened harvest. In blueberries, the U.S. season, which typically runs from June to mid-August, faced declines due to weather disruptions and biological threats. USDA forecasts call for U.S. production to fall to roughly 721 million pounds in 2025, down from 740.5 million pounds in 2024, contributing to a 22% year-to-date decline across North America. Despite these challenges, the Pacific Northwest and Michigan remain critical sources for highbush cultivation, while Maine continues to dominate wild blueberry production.
Other core reefer commodities face a similar backdrop of constrained margins and shifting demand. Washington and Oregon potato production is expected to decline modestly in 2025 despite favorable harvest conditions, with acreage in Washington projected to fall to 145,000–150,000 acres from 159,500 last year, reflecting weaker demand for processed potato products. Oregon, the fourth-largest potato producer, is also contending with volume reductions tied to declines in processed acreage, though specialty and organic varieties are expected to capture more share. At the same time, rising costs for staples such as beef, coffee, eggs and cocoa — up 21% over four years — continue to pressure shippers and downstream buyers, with tariffs threatening to push prices higher still. Labor shortages and immigration constraints compound these pressures, while consumer demand has softened. Restaurant and bar sales are experiencing their weakest six-month stretch in a decade, with households across income levels trading down to lower-cost options or shifting purchases back to grocery channels. This combination of seasonal produce demand, elevated costs and weaker end-consumer spending underscores a reefer market caught between cyclical peaks and structural headwinds.