Back to September 2025 Industry Update
September 2025 Industry Update: Economy
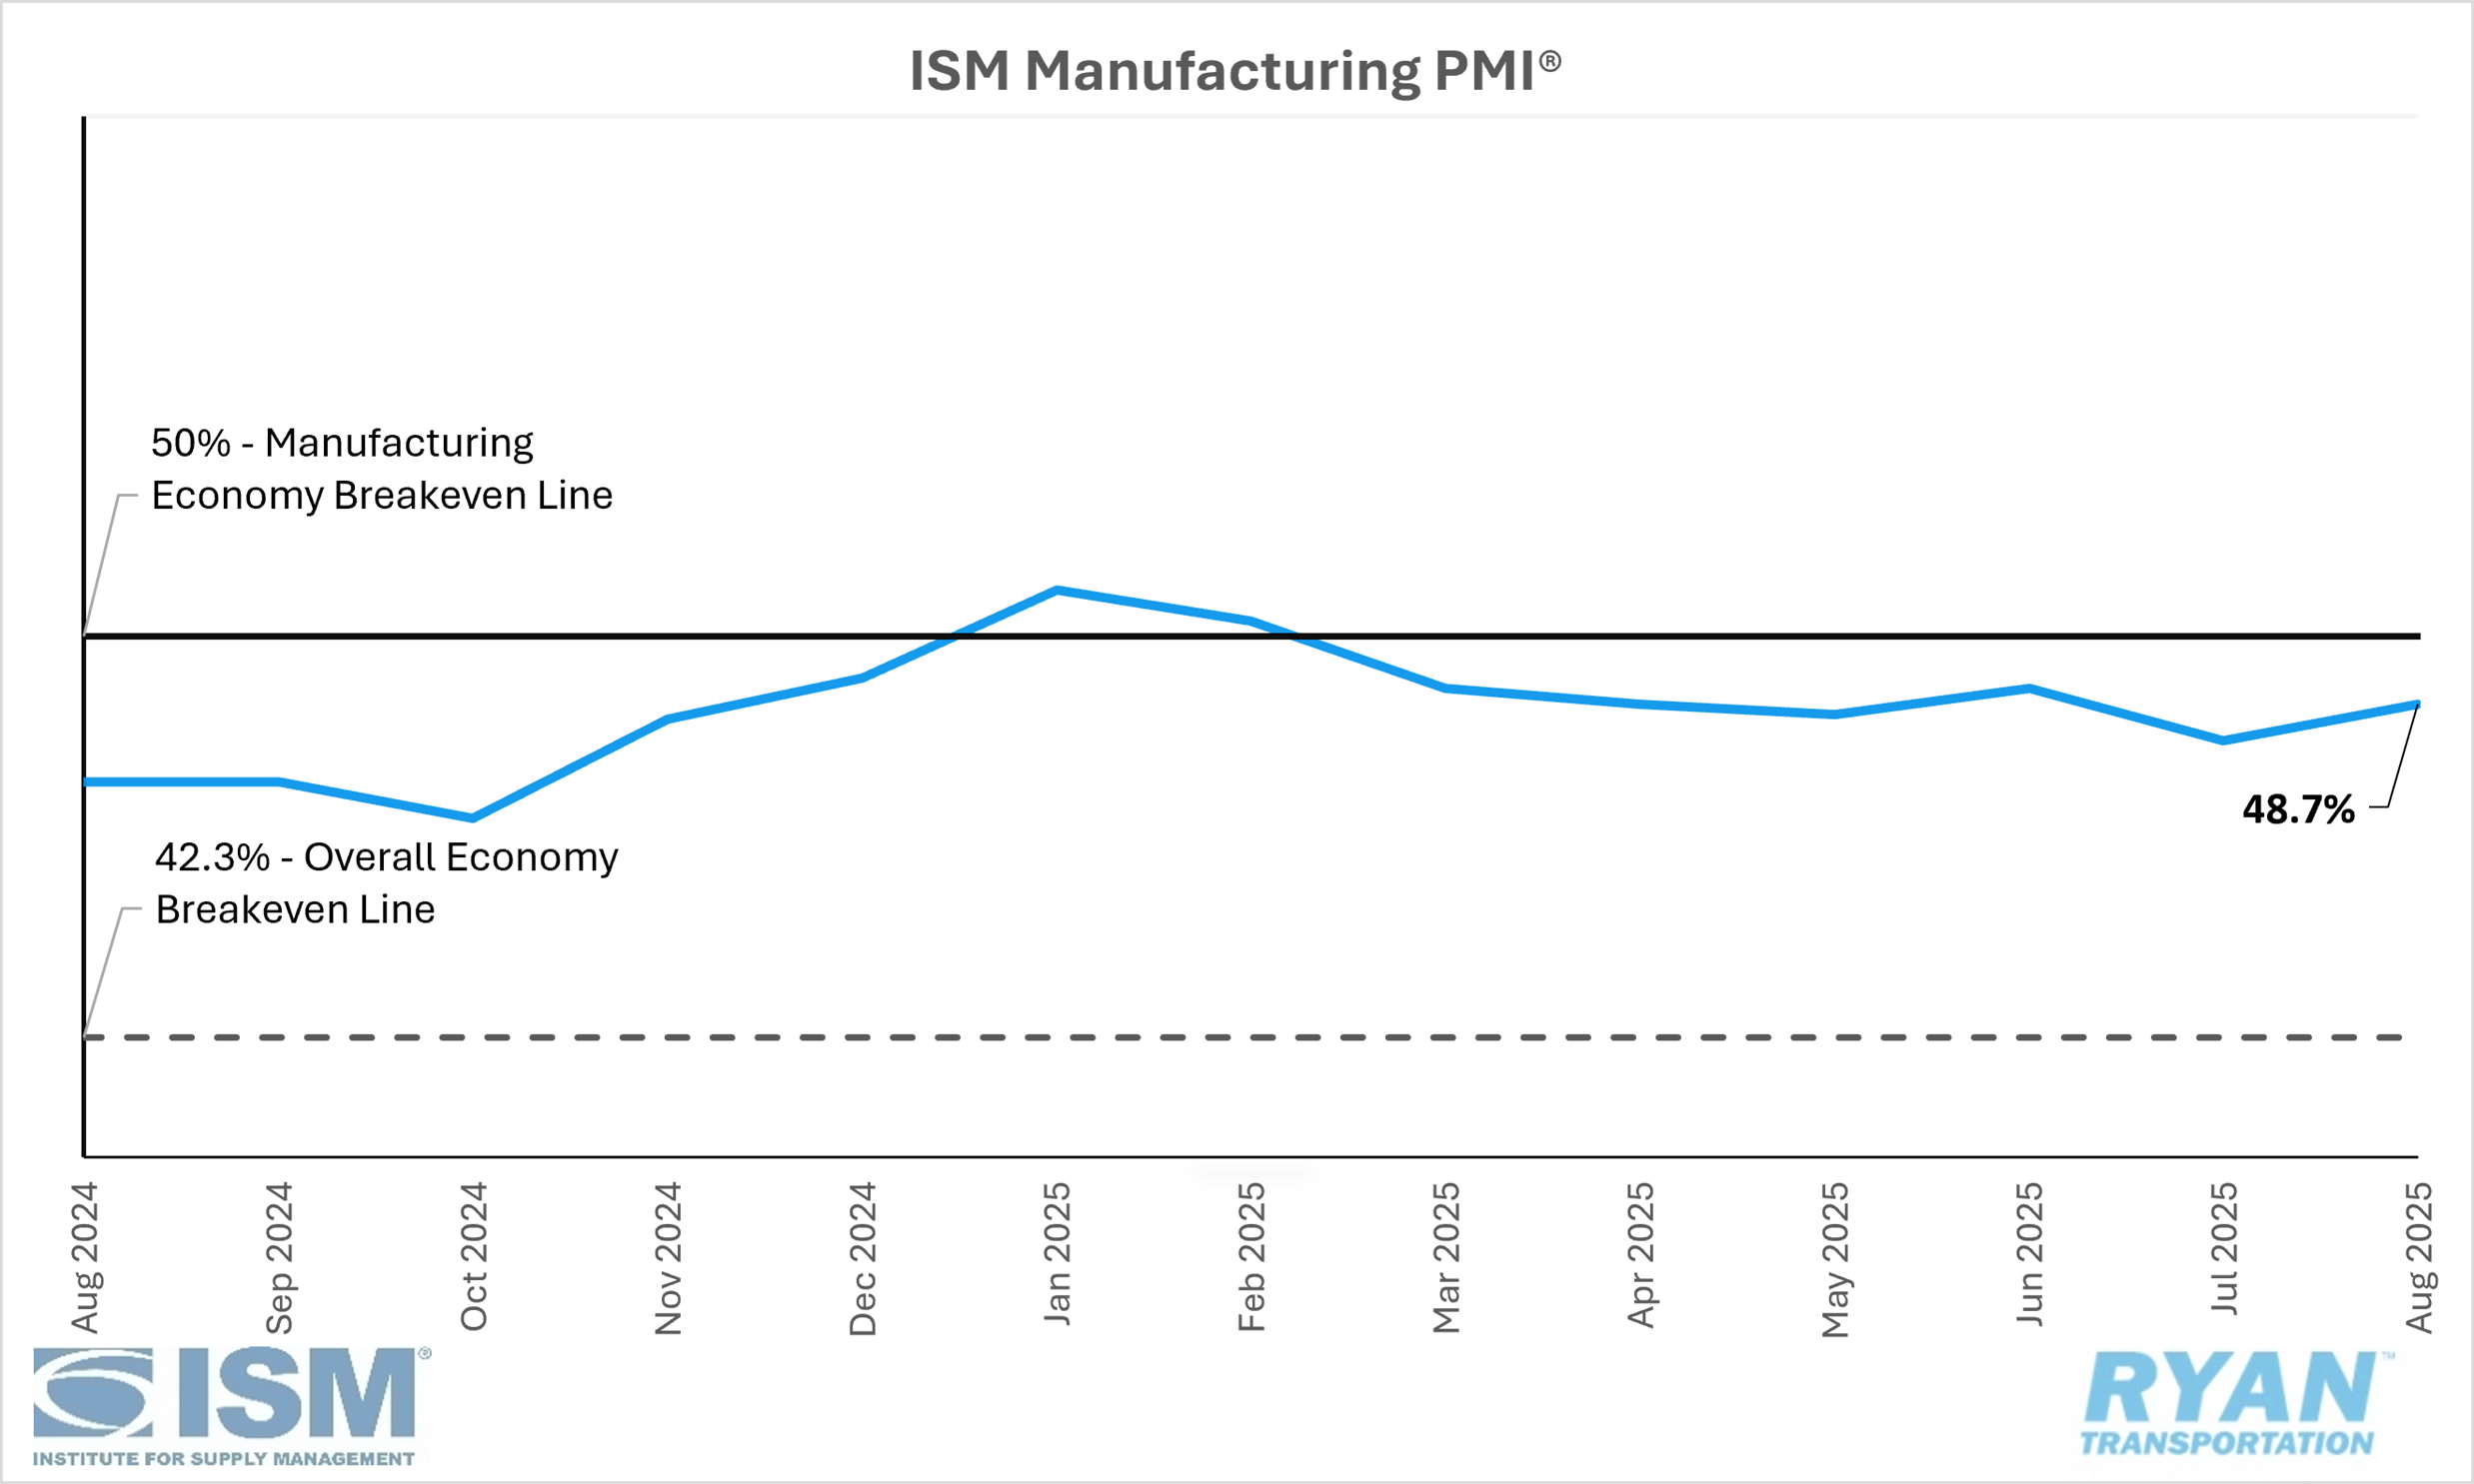
Domestic manufacturing activity contracted at a slower rate compared to July, driven by upticks in demand, while output weakened further.
United States ISM Manufacturing PMI
Key Points
The Institute of Supply Management® (ISM®) Manufacturing PMI® registered 48.0% in July, 1.0% lower than June’s reading of 49.0% and remaining in contraction territory.
The New Orders Index rose 4.3% in August to 51.4% from July’s reading of 47.1% and moved into moderate expansion territory.
The Production Index dropped back into contraction territory after dropping 3.6 percentage points from 51.4% in July to 47.8% in August.
The Employment Index registered 43.8% in August, 0.4% higher than July’s reading of 43.4% and remained deep in contraction territory.
The Supplier Deliveries Index registered 2.0 percentage points higher in August compared to July, rising from 49.3% to 51.3%.
The Inventories Index contracted at a slower rate in August, registering 49.4% compared to the 48.9% recorded in July.
Summary
U.S. manufacturing activity contracted for the sixth consecutive month in August, though the pace of decline moderated compared with July. According to the latest ISM® Manufacturing PMI® Report, the headline index rose by 0.7 percentage points, supported primarily by the New Orders Index moving back into expansion territory. However, a sharp contraction in the Production Index kept the overall improvement modest, nearly offsetting the gains in new orders. From a broader perspective, August marked the 64th consecutive month of expansion for the U.S. economy following a single month of contraction in April 2020, as a PMI® reading above 42.3% over time is generally consistent with overall economic growth.
The demand components were mixed. Two of the four indicators improved, with new orders and new export orders registering gains, while the Customers’ Inventories and Backlog of Orders indices contracted at a slightly faster pace. The 4.3-point MoM increase in new orders — the largest since February 2024 — was sufficient to push the index into expansion for the first time in six months and above its 12-month moving average. Meanwhile, the continued decline in customers’ inventories, moving the index further into “too low” territory, is typically viewed as a positive for future production. That said, the backlog of orders contracted for the 35th consecutive month, limiting the potential for sustained improvement.
Output measures remained weak as the Production Index slipped back into contraction for the first time since May, falling 3.6 percentage points from July. Survey responses reflected a 1-to-1.8 ratio of positive to negative sentiment regarding output. While production softened, the Employment Index edged slightly higher but remained firmly in contraction for the seventh consecutive month, as companies continue to prioritize headcount management. Respondents reported a roughly 1-to-4 ratio of comments on hiring versus workforce reductions, with layoffs and unfilled positions serving as the primary adjustment mechanisms.
Among the six largest manufacturing industries — Chemical Products; Transportation Equipment; Computer & Electronic Products; Food, Beverage & Tobacco Products; Machinery; and Petroleum & Coal Products — two reported growth in August (Food, Beverage & Tobacco Products and Petroleum & Coal Products), compared to none in July.
Why It Matters
Following an accelerated contraction in July, the ISM® Manufacturing PMI® registered a modest improvement in August but remained below consensus expectations of 49.0%. While the slower pace of decline suggested some stabilization, the report highlighted ongoing headwinds — most notably tariff uncertainty, weak demand, workforce reductions and elevated input costs — that continue to weigh on the sector. Although the rebound in new orders pushed the index into expansion territory for the first time since January, multiple indicators suggest this may represent a temporary fluctuation rather than a sustained improvement in demand. According to the ISM®, overall sentiment in August was overwhelmingly negative, with respondents providing 15 negative general comments for every positive one — a record-wide disparity.
Tariff concerns were particularly pronounced, with Susan Spence, MBA, Chair of the ISM® Manufacturing Business Survey Committee, noting that 89% of panelists’ tariff-related comments were classified as “worrisome.” The unpredictability of trade policy has left many firms hesitant to commit to investments given the uncertainty surrounding input costs. Survey responses also indicated that inflationary pressures from tariffs have reached a tipping point, with many companies no longer able to absorb the additional costs, thus passing them on to their customers. Although the Prices Index declined by six percentage points over the past two months, it remains 11.2% higher than at the beginning of the year, with steel and aluminum price increases exerting outsized effects across the manufacturing value chain.
The persistence of higher prices, compounded by elevated interest rates, continues to suppress capital expenditures and weigh on employment figures — not only within manufacturing but across multiple industries. These pressures have reinforced market expectations that the Federal Reserve may ease monetary policy at its upcoming September meeting to provide some form of stimulus. Even so, many companies are likely to maintain buying inertia until greater clarity and stability emerge in trade regulation, limiting the potential for a meaningful near- to mid-term recovery.
Macro Economy
Labor Market
In the latest Jobs Report released by the Bureau of Labor Statistics (BLS), preliminary estimates of total nonfarm payroll employment rose by just 22,000 jobs in August, coming in well below the consensus of 75,000 new jobs. The report also detailed revisions to June and July’s estimates, with July’s figure rising to +79,000 jobs from its initially reported estimate of +73,000 jobs, while June’s total was revised down to -13,000 from +14,000. According to the household survey data, the unemployment rate edged up slightly to 4.3% in August, its highest level since October 2021, with the total number of unemployed at 7.4 million.
The report was followed up a few days later by preliminary benchmark revisions of its payroll estimates based on the Quarterly Survey of Employment and Wages, which reflected employment growth in the 12 months through March 2025. In the survey, growth was a record 911,000 less, or -0.6%, than what official government data had previously shown, exceeding the -700,000 consensus and the -818,000 adjustment recorded last year. While the exact monthly revisions will not be available until February of next year, when the BLS posts the January report, the considerable downward revisions raise serious concerns about current employment statistics and their policy implications.
Inflation
The Federal Reserve's preferred inflation gauge — the personal consumption expenditures (PCE) index released by the Bureau of Economic Analysis (BEA) — was up 0.2% MoM compared to June and up 2.6% YoY compared to July 2024, when seasonally adjusted. Excluding volatile food and energy prices, the core PCE index rose 0.3% MoM compared to June and was up 2.9% YoY in July.
Meanwhile, the Consumer Price Index (CPI) in August rose 0.4% MoM, outpacing the 0.3% consensus and accelerating from the 0.2% MoM increase recorded in July, according to the latest CPI release from the BLS. On an annual basis, headline CPI was up 2.9% YoY, which came in line with general expectations and was 0.2% higher compared to the 2.7% YoY increase reported in July. Stripping away food and energy prices, core CPI stalled from a month earlier, rising 0.3% MoM and climbed 3.1% YoY, which remained unchanged from July’s reading and met expectations.