Back to September 2025 Industry Update
September 2025 Industry Update: Dry Van
Elevated imports over the past two months balanced out ongoing softening in domestic manufacturing volumes, keeping dry van rates steady in August.
Spot Rates
Key Points
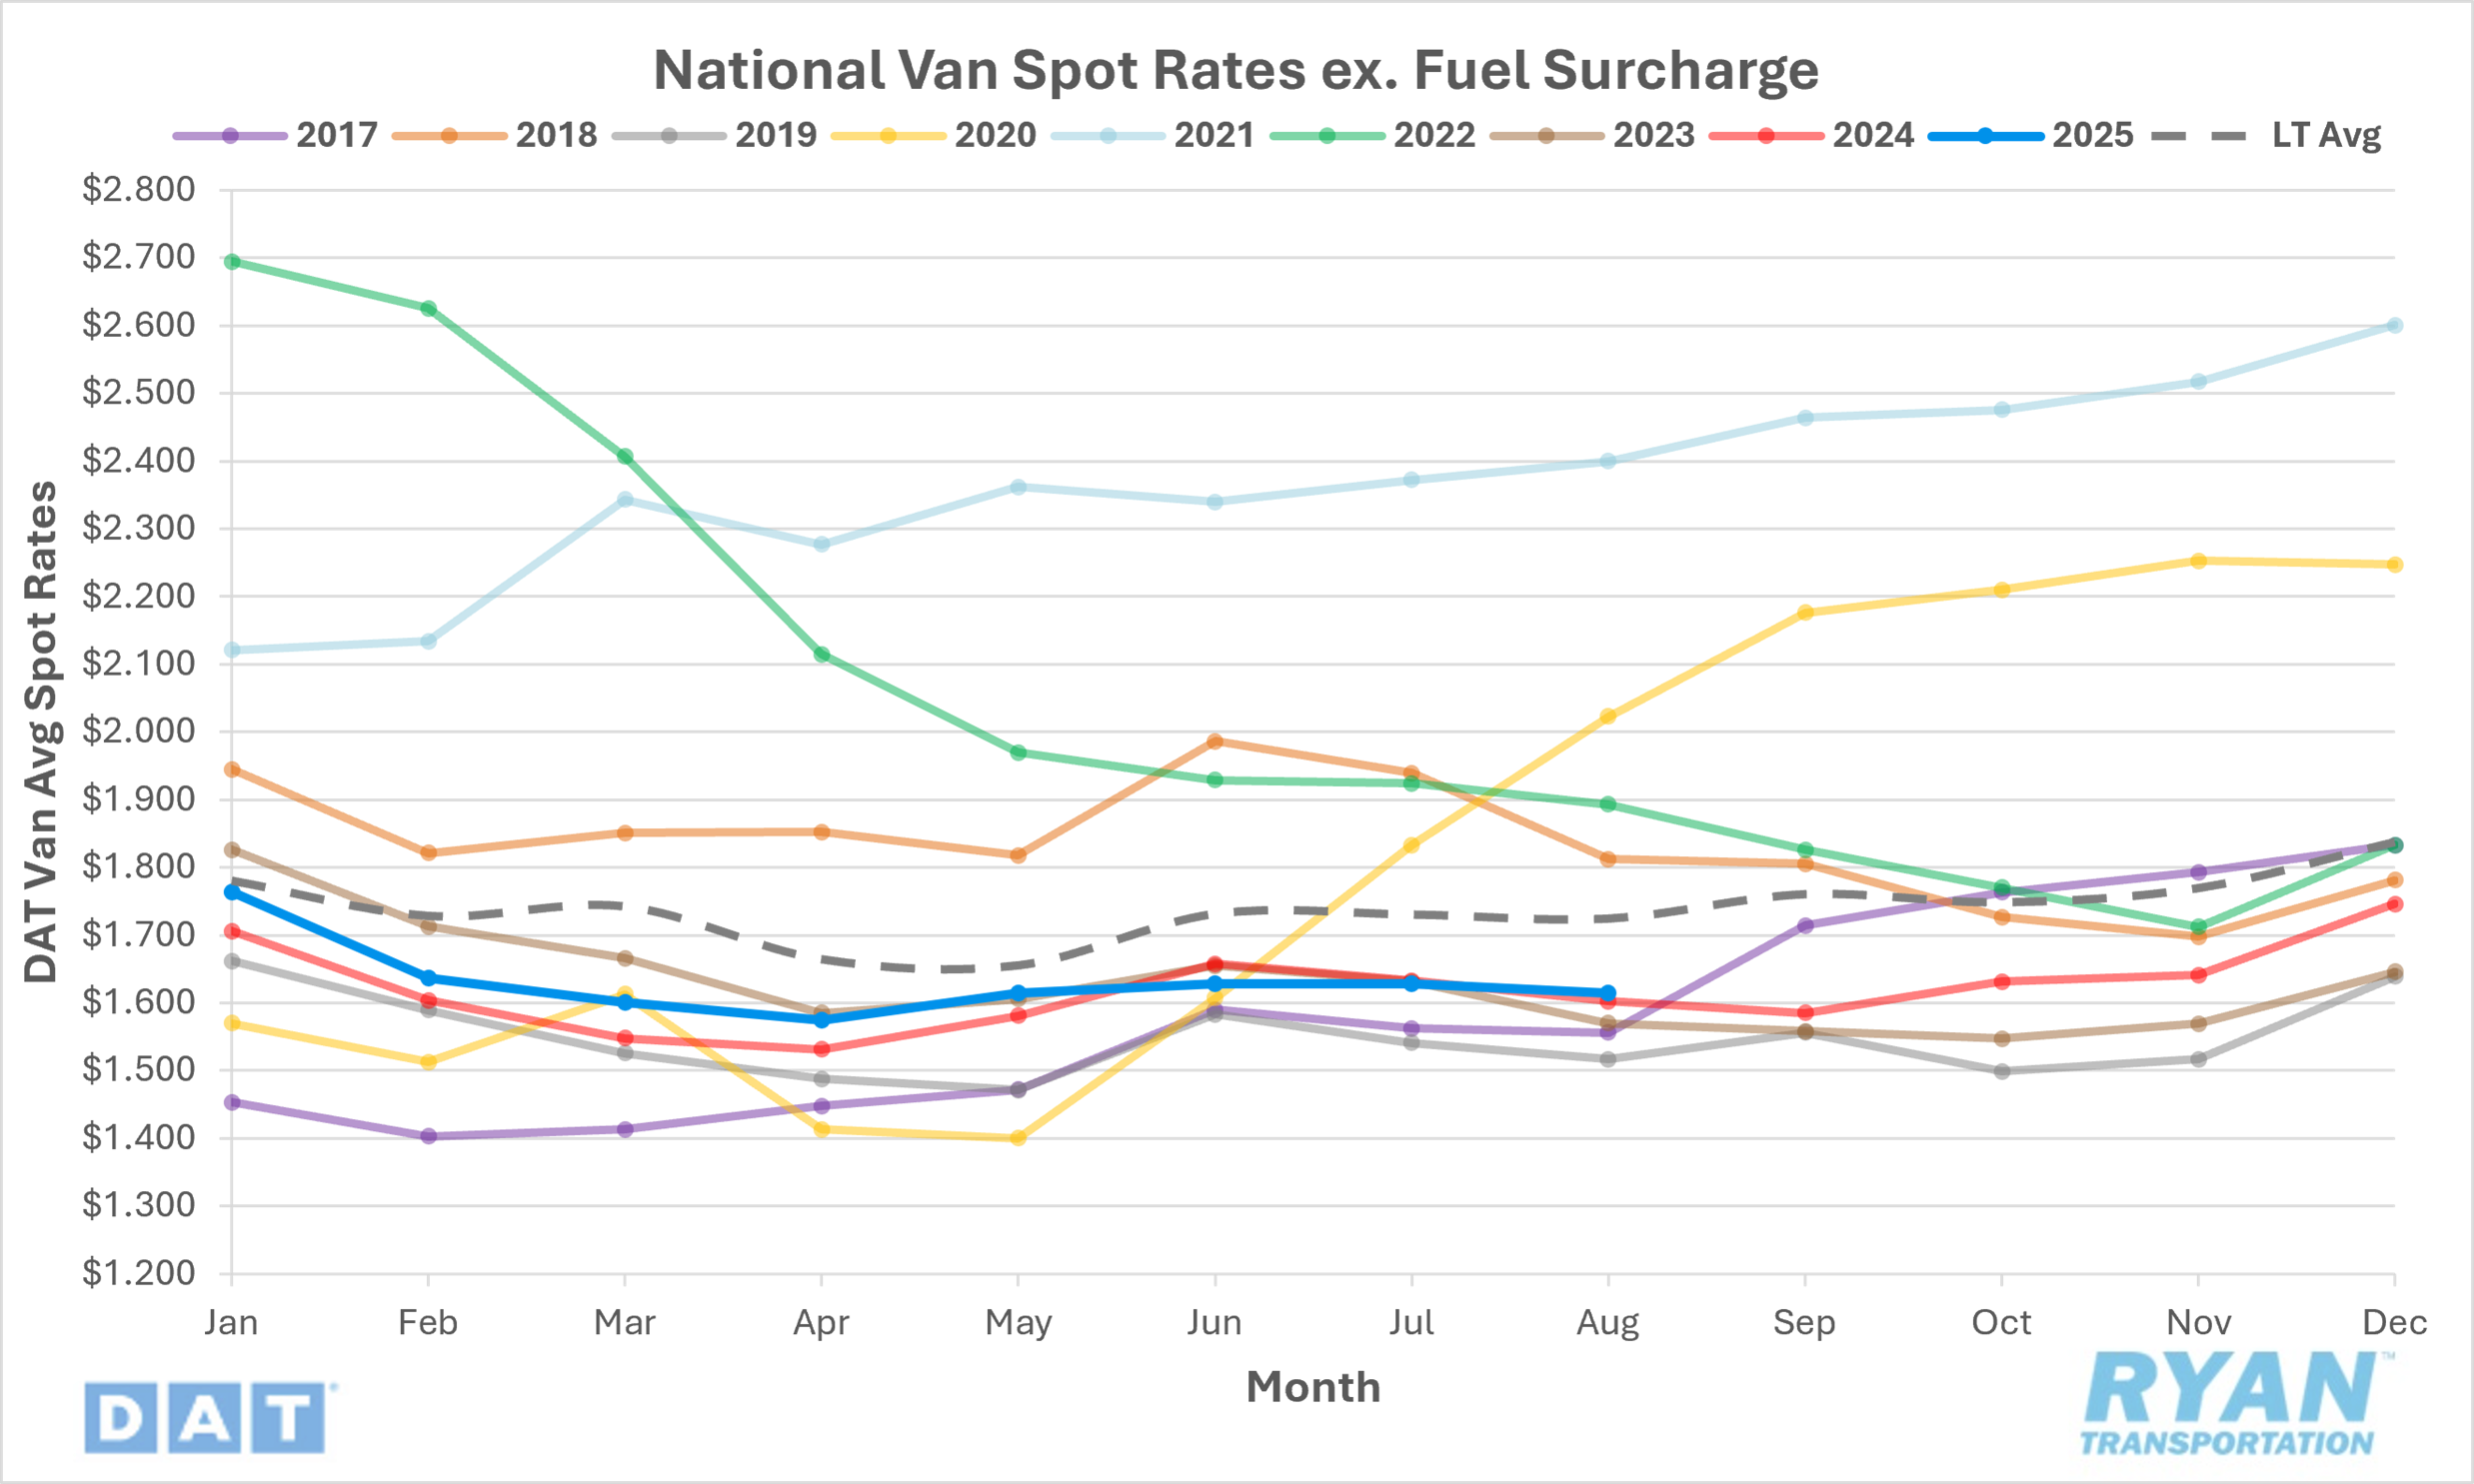
- The national average dry van spot rate, excluding fuel, continued to trend essentially flat, falling by 0.9% MoM, or under $0.02, to $1.61 in August.
- Compared to August 2024, average dry van spot linehaul rates were up 0.7% YoY but remained below the LT average by 6.7%.
- Initially reported average dry van contract rates, exclusive of fuel, were down slightly by 0.2% MoM in August but were higher compared to August 2024 by 1.1% YoY.
Load-to-Truck Ratio
Key Points
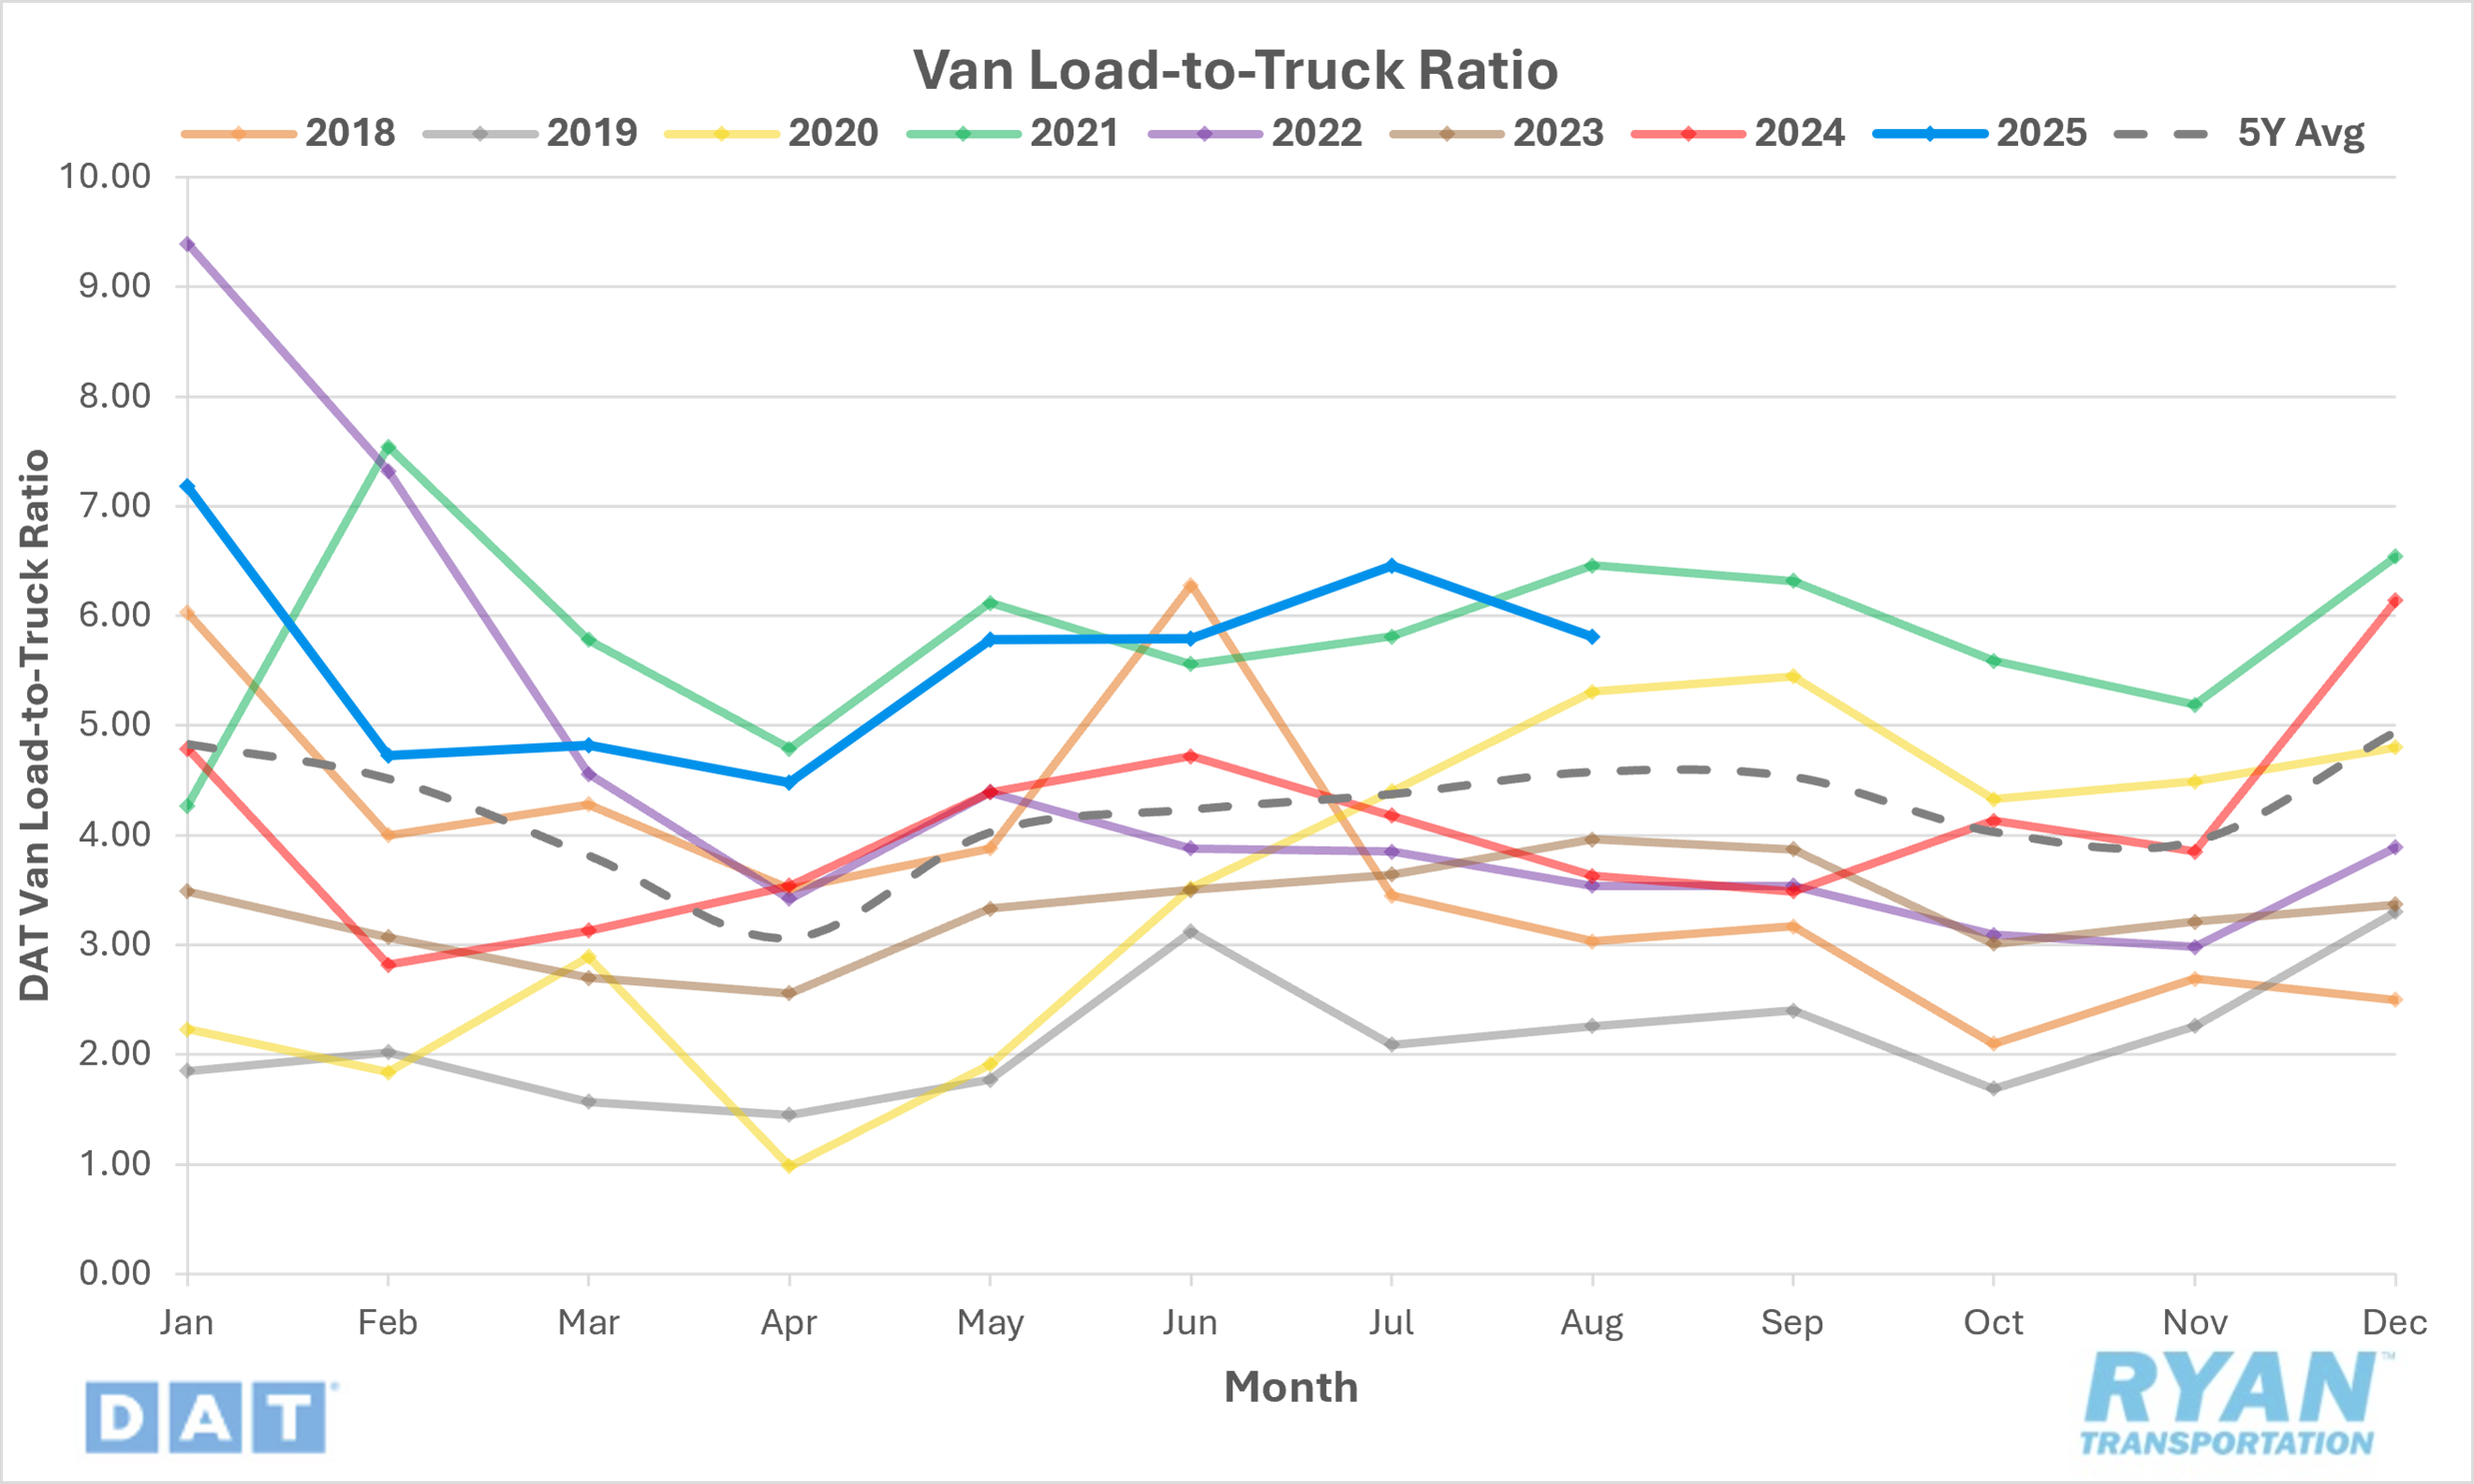
- The dry van load-to-truck ratio (LTR) fell in August by 10.6% MoM, falling from 6.46 in July to 5.81.
- Compared to August 2024, the dry van LTR was 60.1% higher YoY and 26.9% above the 5-year average.
- According to load board data collected by DAT Freight & Analytics, dry van load posts were down 12.1% MoM in August while equipment posts were down 2.2% MoM.
Market Conditions
Dry Van Summary
According to the latest reading of the trucking ton-mile index from Dr. Jason Miller of Michigan State University, seasonally adjusted freight demand continued to soften in June as the index was down 0.2% MoM but remained 1% higher YoY. The gains were concentrated in sectors such as wood products, petroleum and machinery wholesaling, industries that are typically less dependent on dry van freight. This has raised questions about the persistently weak truckload pricing in the dry van sector, as many growing sectors are not aligning with traditional freight patterns. Analysts caution that current industrial production data may be overstated due to inflated manufacturing payroll estimates, leaving room for downward revisions. Despite modest YoY growth, demand has not been strong enough to create expansionary pricing conditions, with recent weakness tied to tariff-related frontloading and slowing residential construction. Further adding to concerns, corrugated cardboard demand, often viewed as a proxy for consumer activity, has shown declines, with nearly half of box producers reporting weaker conditions compared to three months earlier. This softening coincides with higher raw material costs, as tariffs pushed containerboard prices up $70 per ton in the first half of 2025, even as shipments declined 2.1% YoY in Q1 before showing some recovery in Q2.
However, the latest ACT For-Hire Trucking Index reflected a temporary rebalancing in July, with volumes improving and capacity edging lower, supported by tariff-driven pull-forwards ahead of August deadlines. The Volume Index turned positive for the first time in six months, rising sharply to 52.3, while the Capacity Index slipped to 46.0, indicating modest tightening. Pricing conditions also stabilized, with the Pricing Index climbing to 50.7 from June’s 44.2, aided by slowing tractor sales as tariff-free inventory waned. Nonetheless, structural overcapacity and the inflationary impact of tariffs remain key impediments to a sustained freight recovery. ACT analysts caution that while private fleet insourcing may be easing, publicly traded carriers continue to face historically weak margins, rising equipment costs and trade uncertainty. The July improvements in balance are likely temporary, as freight volumes pulled forward ahead of tariff deadlines may be followed by a payback period in late 2025, limiting prospects for a durable rebound until 2026.