Back to October 2025 Industry Update
October 2025 Industry Update: Truckload Supply
Tender rejections retreated following the Labor Day holiday but remained stable and continue to indicate tightening market conditions.
Key Points
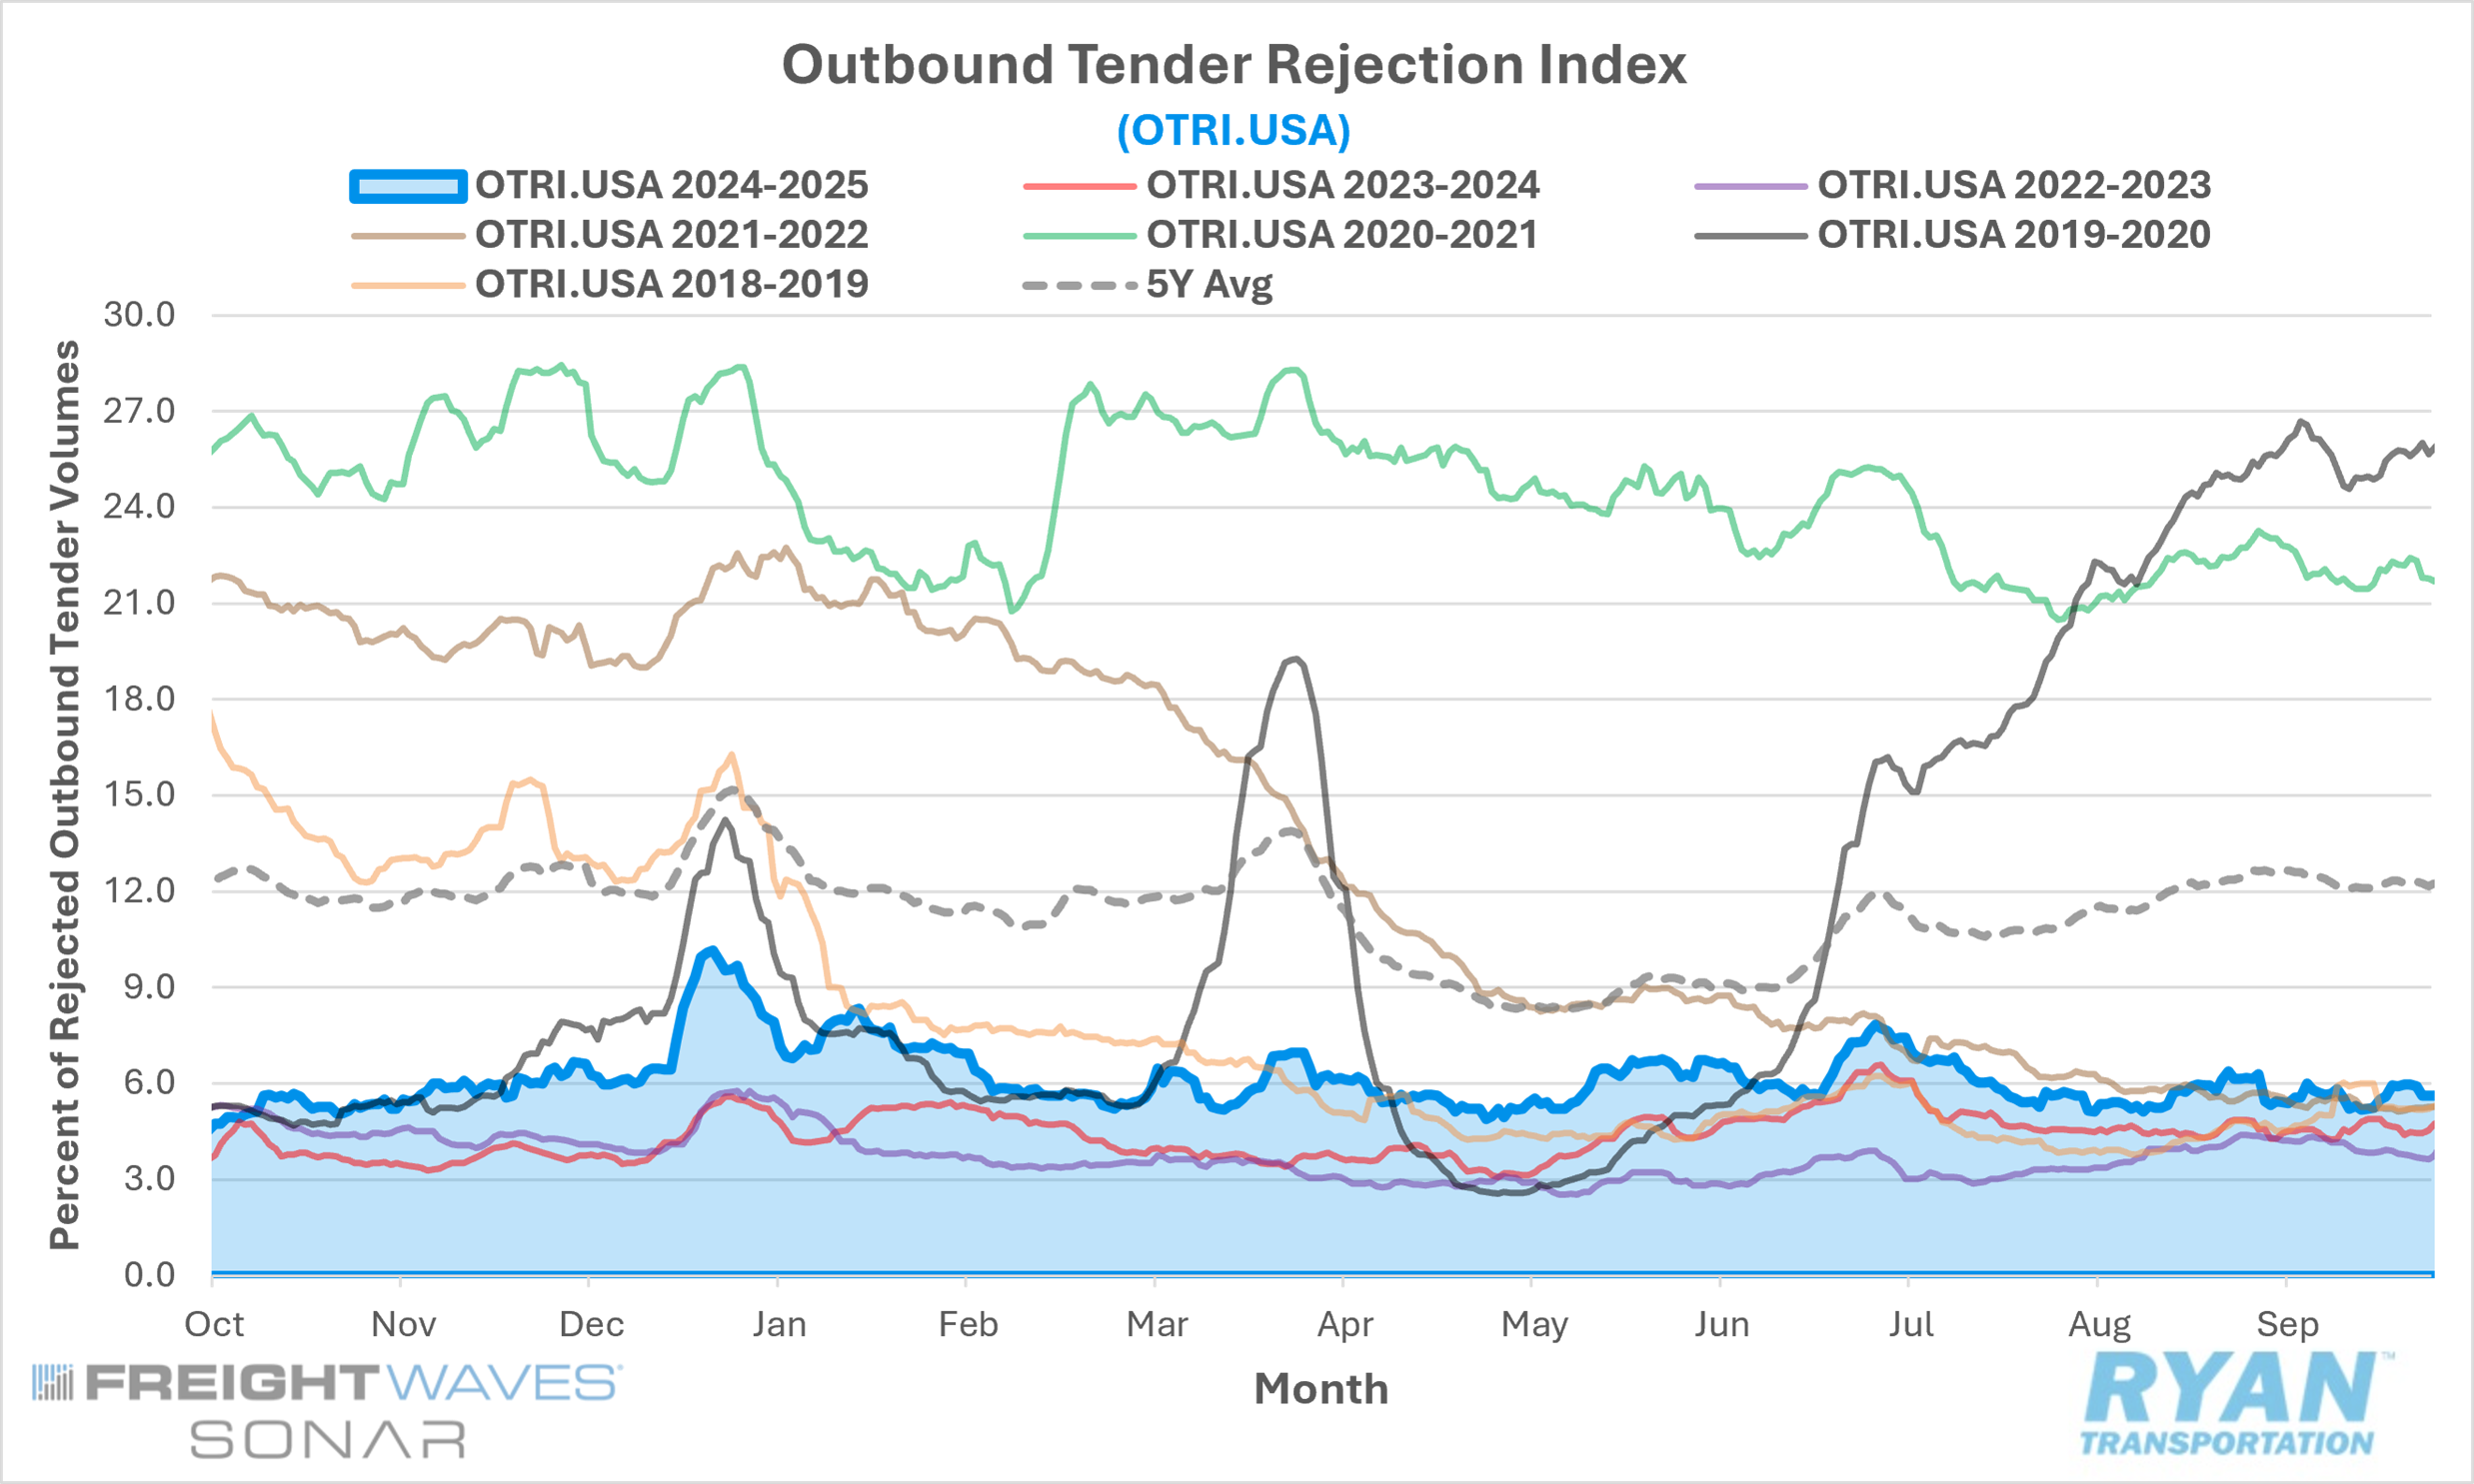
- The FreightWaves SONAR Outbound Tender Rejection Index (OTRI.USA), which measures relative capacity based on carriers’ willingness to accept freight volumes under contract, declined 54 basis points (bps) MoM, dropping from 6.17% at the end of August to 5.63% in September.
- The monthly average of daily tender rejections was essentially flat MoM in September, registering just one basis point higher compared to August.
- On an annual basis, average daily tender rejections remained 1.08% higher YoY but were 6.73% lower than the 5-year average.
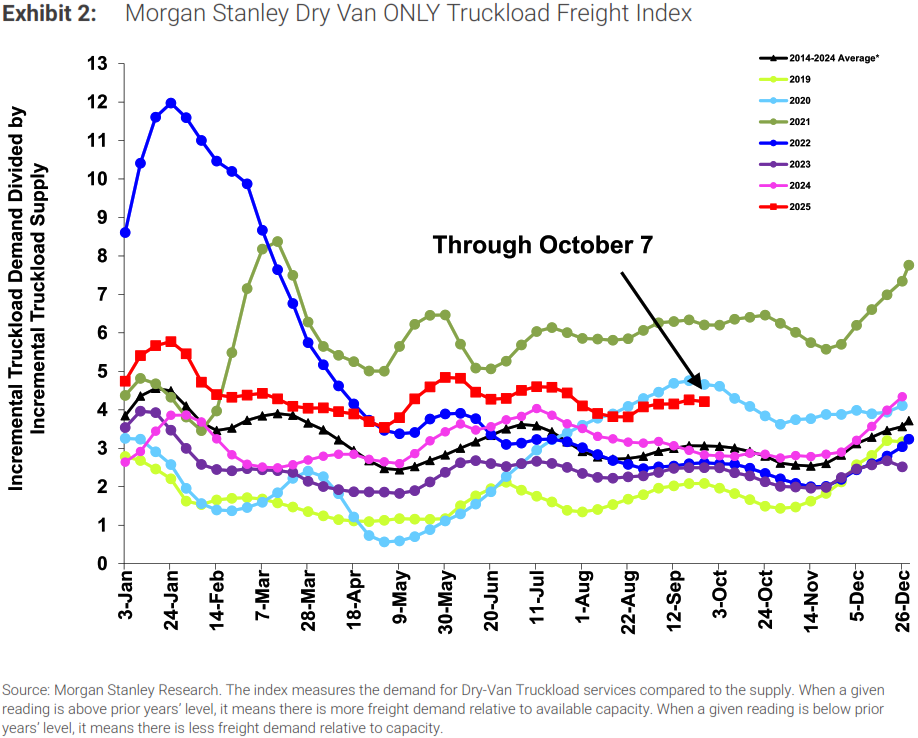
- The Morgan Stanley Truckload Freight Index (MSTLFI) remained mixed in September, outperforming in the front half of the month before reversing the trend and underperforming in the second half, but increasing sequentially throughout the month.
Summary
Following the late-August surge in activity ahead of the Labor Day holiday, outbound tender rejections moderated in September and ultimately remained unchanged from the prior month. Despite the MoM stagnation, rejection rates continued to trend higher on a YoY basis, marking the 21st consecutive month of annual gains. This persistent strength in annual comparisons underscores the gradual tightening occurring beneath the surface as capacity exits the market, even as near-term conditions remain largely stable.
From a quarterly perspective, tender rejection trends have softened consistently throughout 2025. Average rejection rates have fallen 53 basis points (bps) since Q1, including an 8-bps decline QoQ compared to Q2. Nonetheless, rejection levels in Q3 2025 remain 112 bps above those recorded in Q3 2024 and 93 bps higher than the full-year 2024 average, indicating a still-tighter market relative to last year’s baseline.
The most recent Morgan Stanley Truckload Freight Index (MSTLFI) reflected a mixed performance across the month. Early-month strength was driven primarily by an outperformance in the supply component, while demand tracked largely in line with historical seasonality. In the latter half of September, this dynamic reversed: demand underperformed materially while supply trends normalized. Specifically, the demand component increased ~380 bps in September, well below its typical seasonal gain of ~690 bps, while the supply component declined ~380 bps, exceeding its historical average decrease of ~240 bps for the month.
Why It Matters
The ongoing sensitivity of tender rejections to short-term demand fluctuations and seasonal events, such as holidays, continues to signal that market conditions are gradually tightening as capacity exits the industry. Evidence of this tightening is reflected in the OTRI, which has remained elevated on a YoY basis despite freight volumes continuing to trend below prior-year levels. Still, outside of seasonal disruptions, rejection rates remain broadly consistent with a market struggling to absorb persistent excess capacity.
Rejection rates hovering around 6% are typically indicative of some balance between supply and demand, as carriers are rejecting a reasonable amount of contracted tenders but not extraordinary amounts. Despite this, contract rates continue to remain under pressure, which suggests rates could face another difficult bid cycle this fall. According to the latest Logistics Managers’ Index report, Transportation Prices registered just below Transportation Capacity, otherwise known as a negative freight inversion, for the second straight month in September.
While the disparity between the two subindexes is minimal, just 0.9%, it is worth noting that in the past, anytime there has been either a positive or negative inversion observed for at least three consecutive months, it has signaled a significant shift in the transportation market. However, it is not a prediction of a freight recession, but that could change should these dynamics remain on their current trajectory. It is also worth noting that the current negative inversion has been entirely driven by upstream respondents, as their downstream counterparts reported robust expansion in Transportation Prices at 61.1%. This burst in downstream activity could potentially continue to hold the market up as retailers pull product down in anticipation of Q4 sales. However, the anticipation of meager import activity in the coming months may challenge this position.