Back to October 2025 Industry Update
October 2025 Industry Update: Truckload Rates
Average spot rates registered slightly higher in September, while contract rates continue to trend flat.
Spot Rates
Key Points
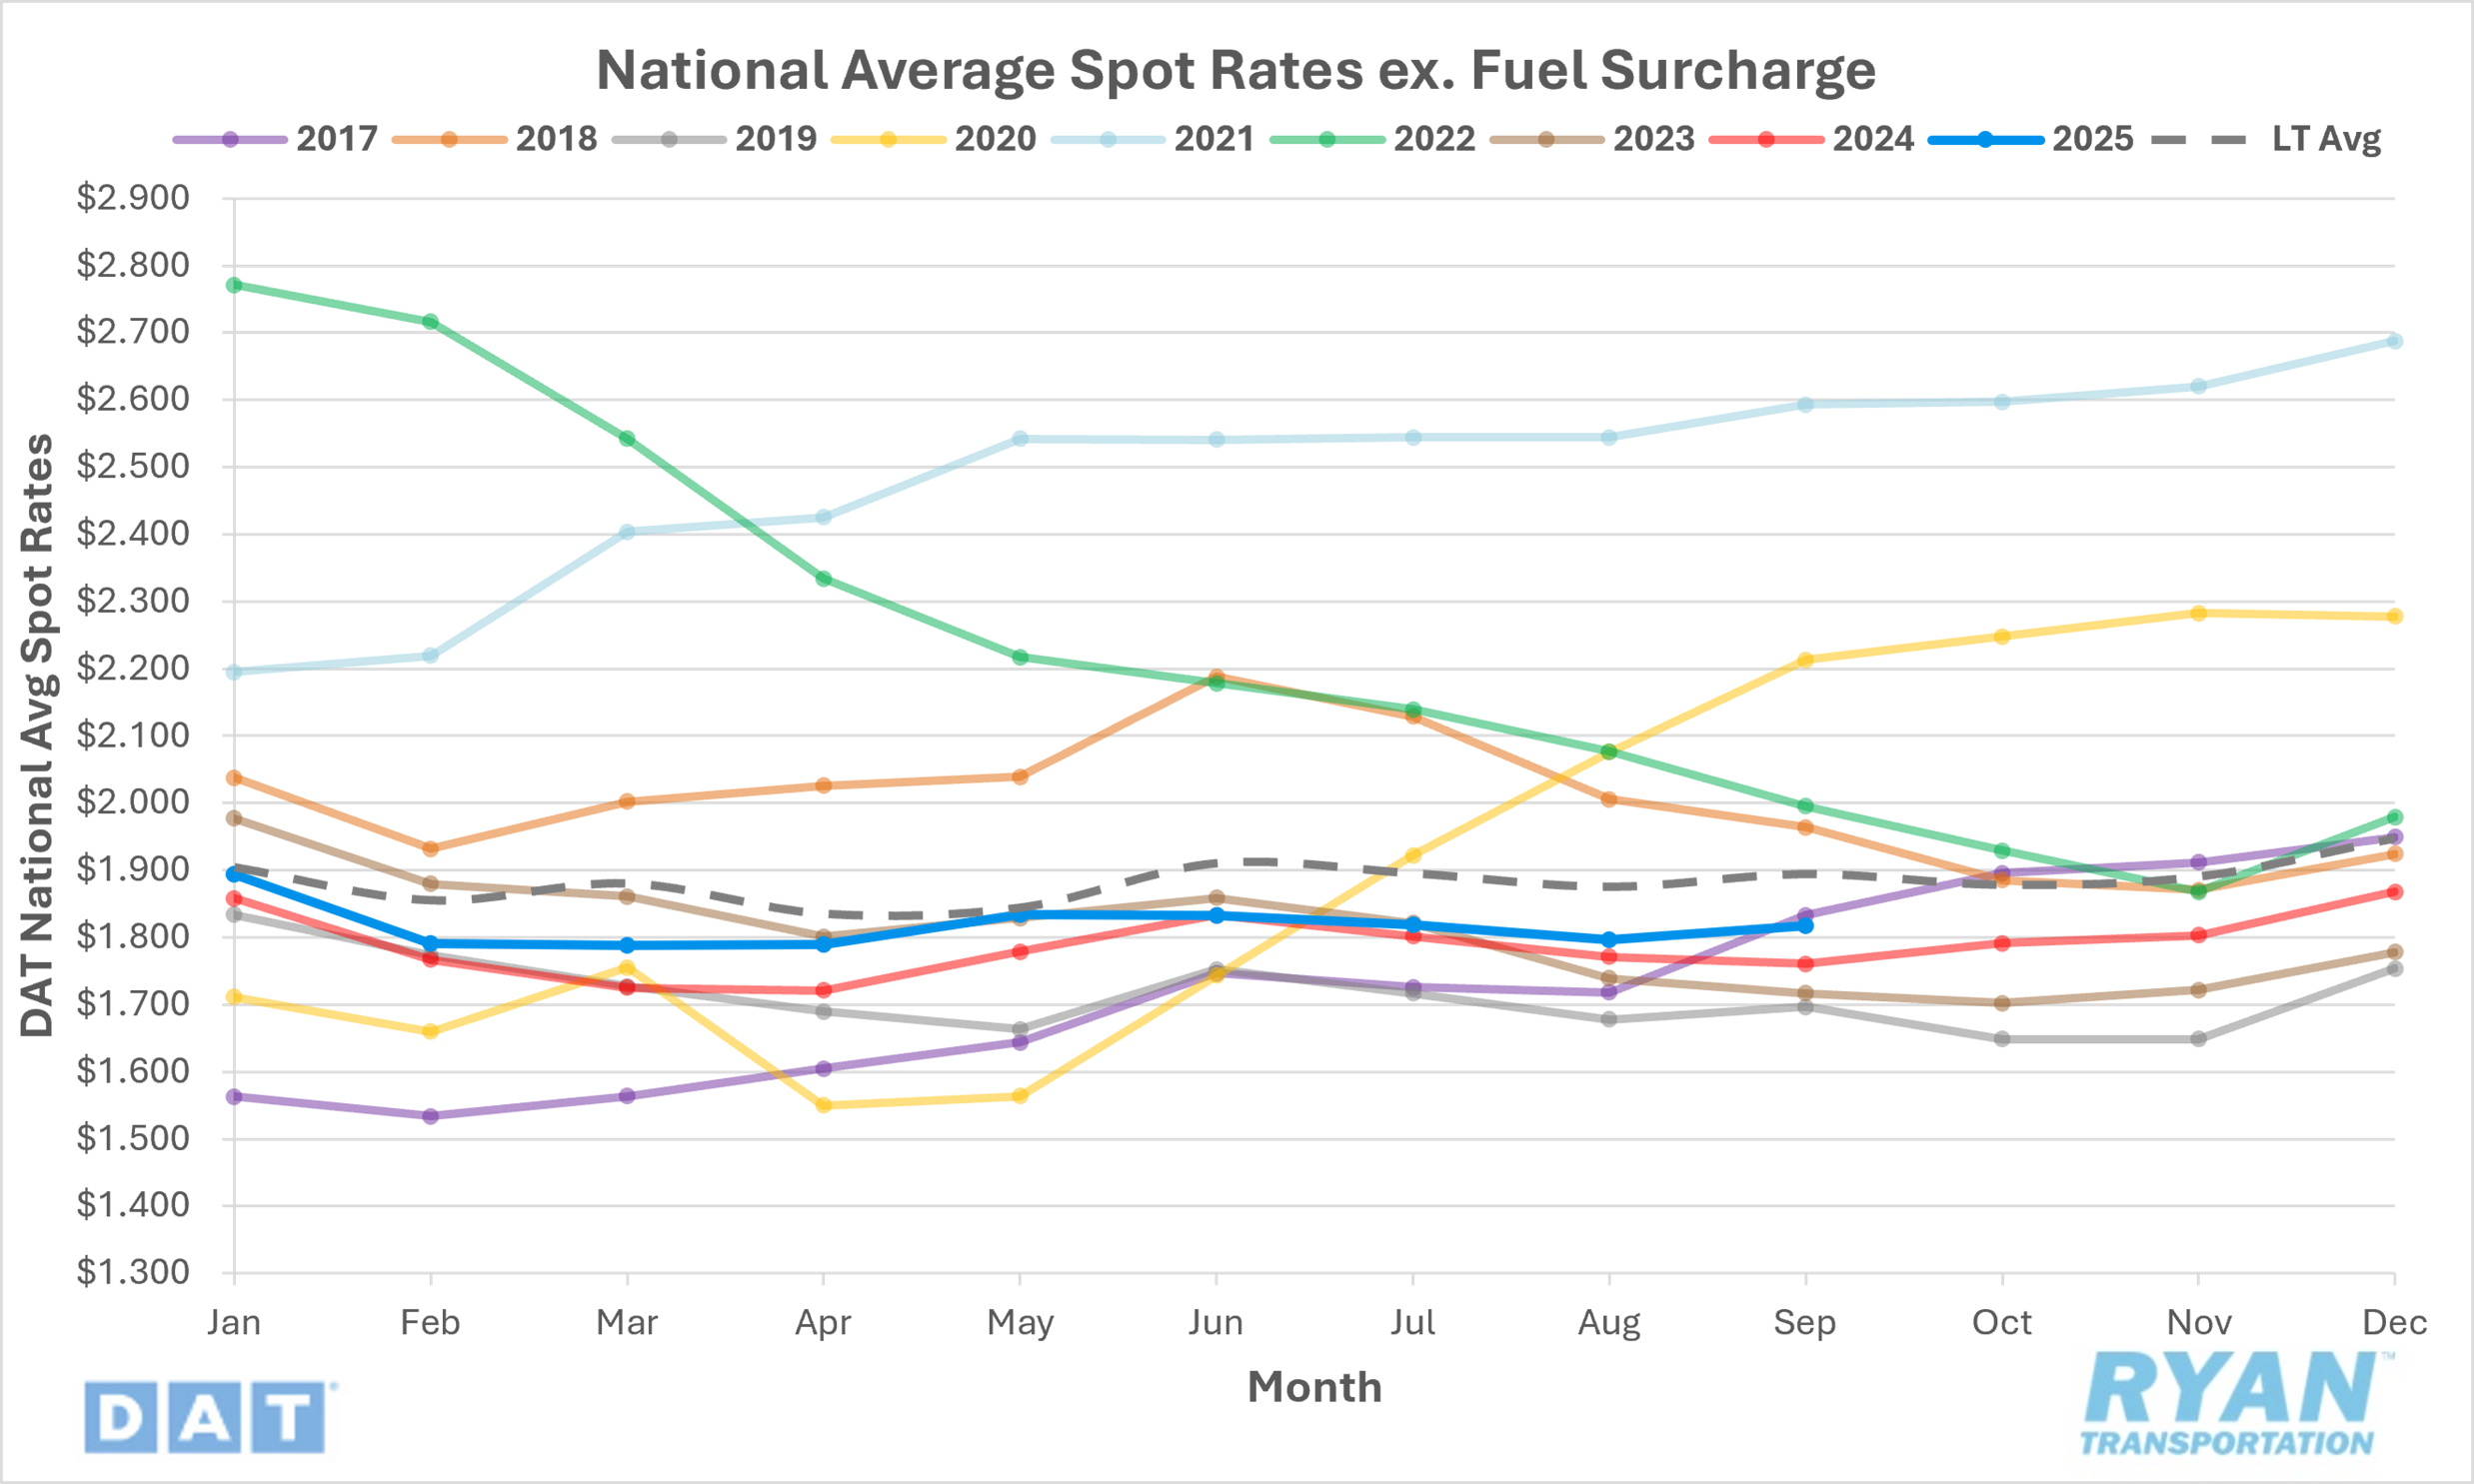
The national average spot rate, excluding fuel, increased 1.2% MoM, or just over $0.02, to $1.82 in September.
Average linehaul rates were up 3.2% YoY compared to September 2024 and remained 4.3% below the long-term (LT) average.
Contract Rates
Key Points
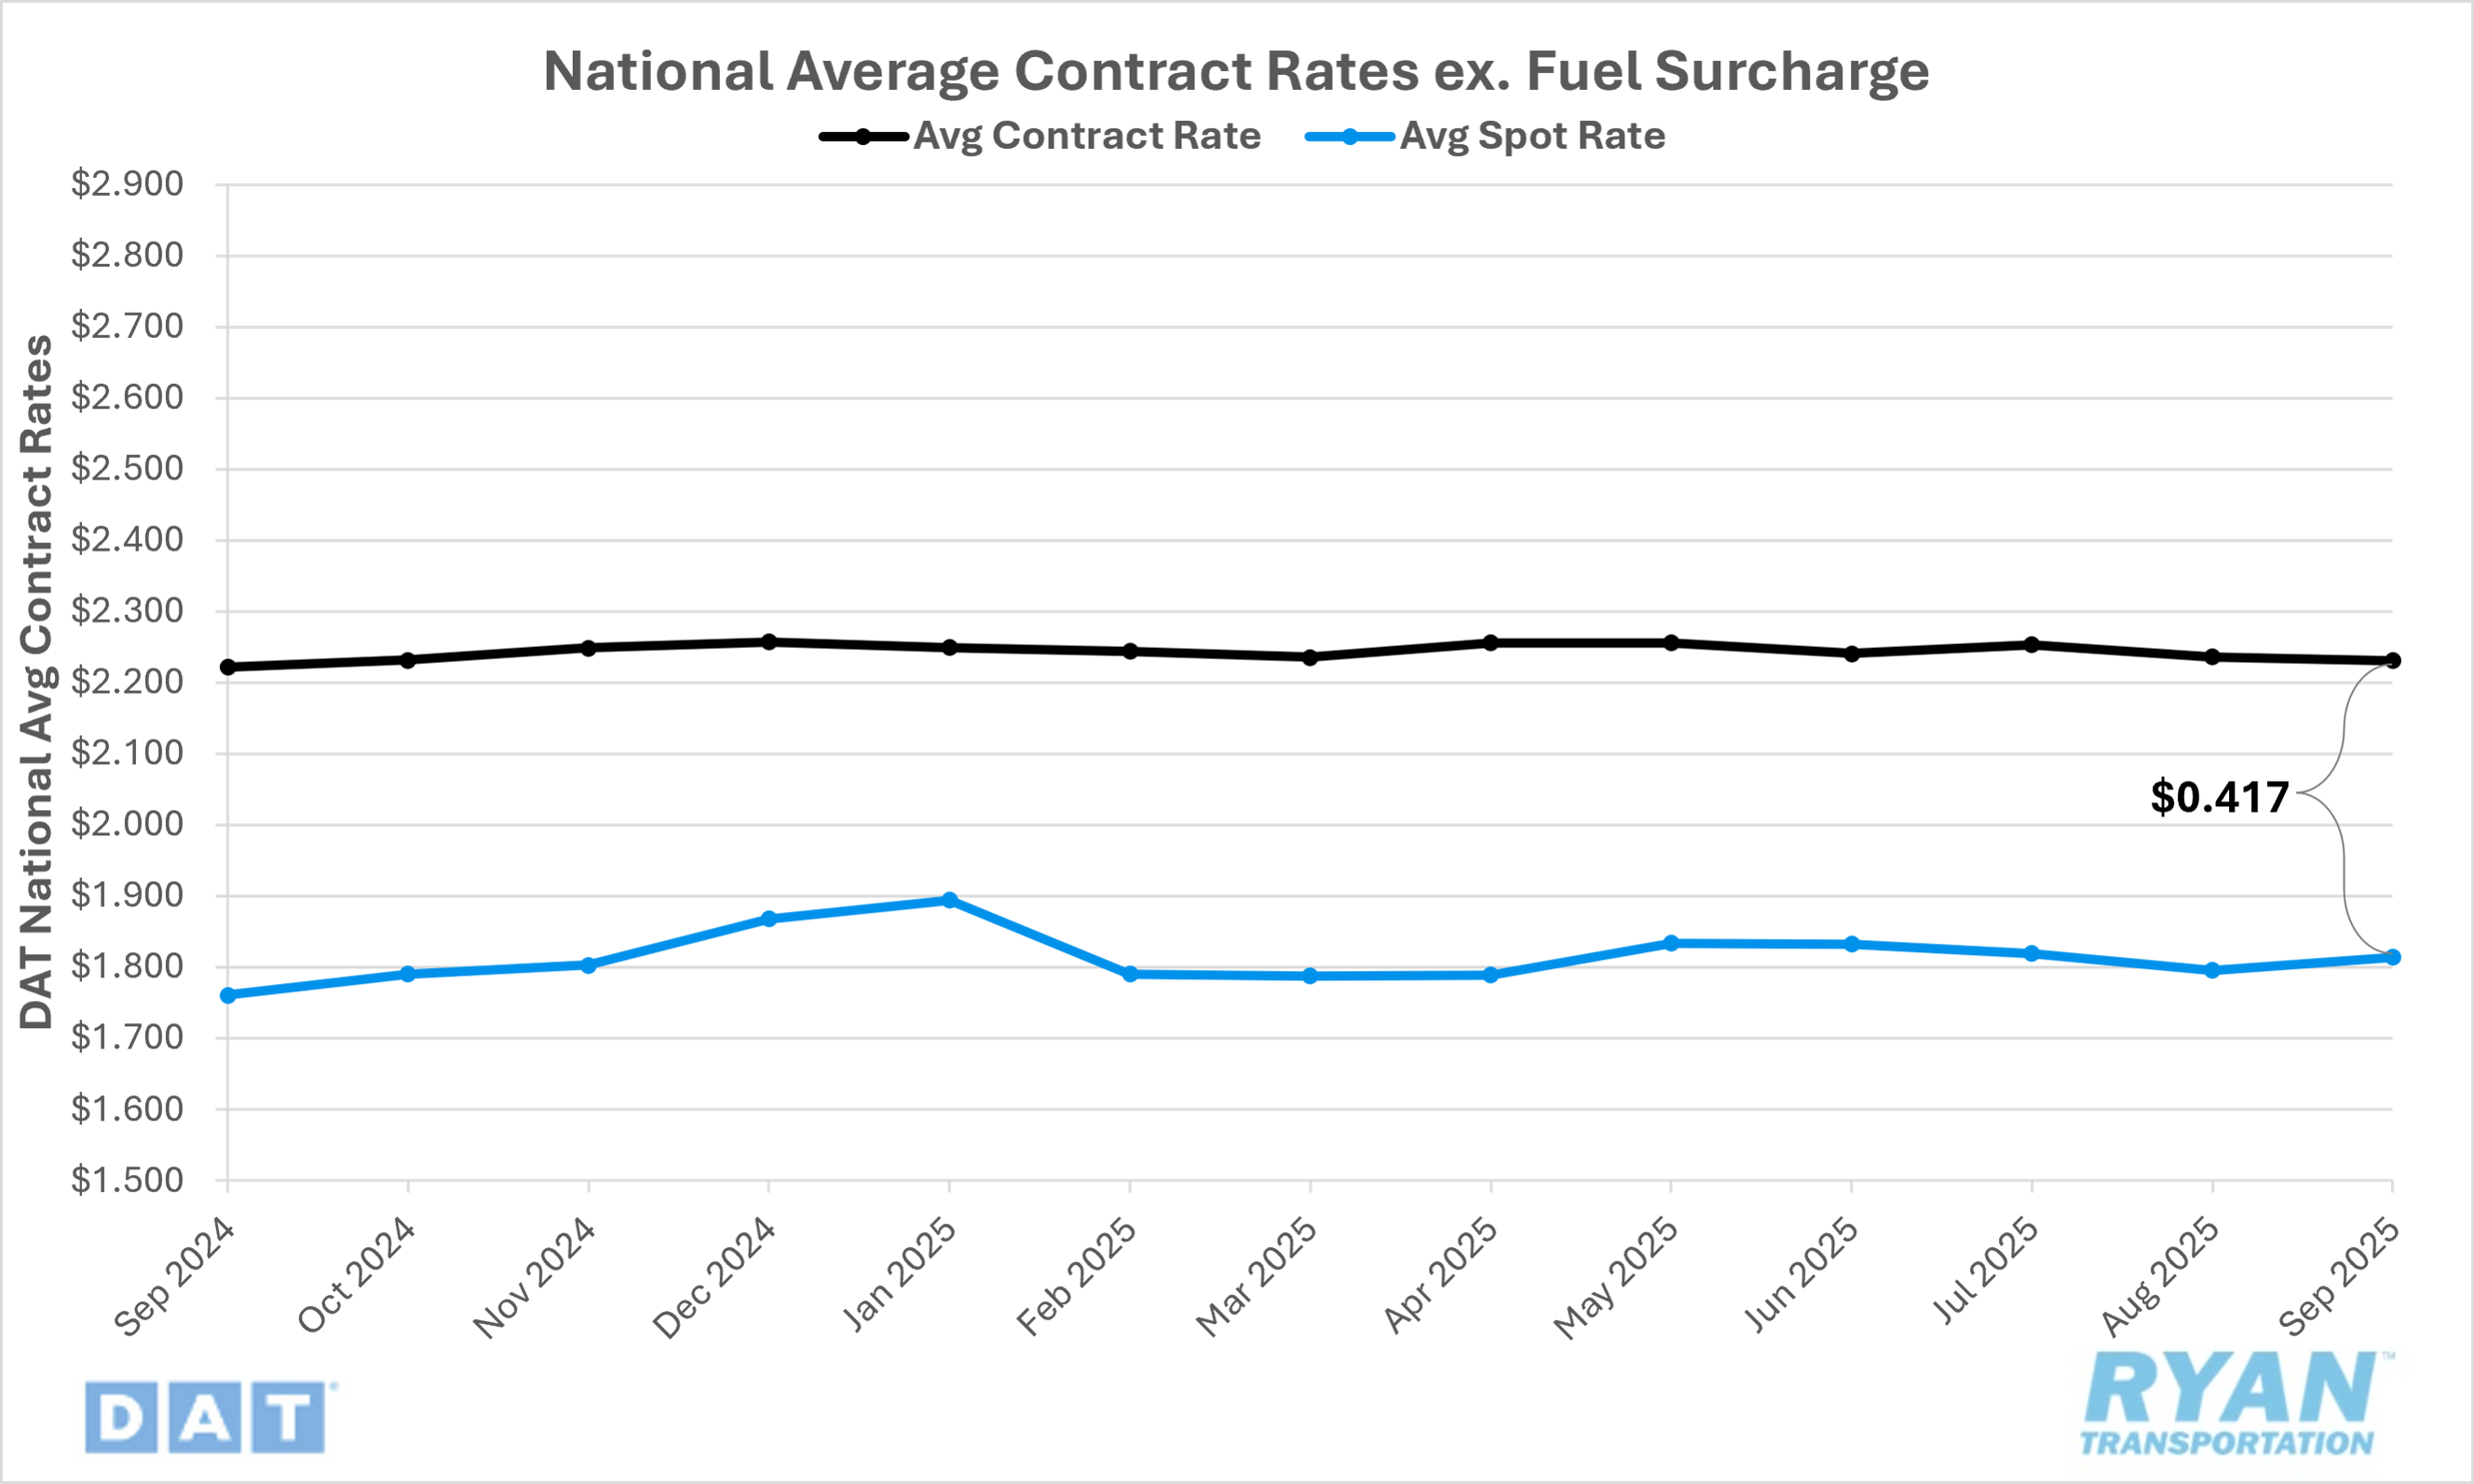
Initially reported average contract rates, exclusive of fuel, were essentially flat in September, dropping by just 0.2% MoM.
On an annual basis, initially reported average contract linehaul rates were 0.5% higher YoY compared to September 2024.
The contract-to-spot spread registered $0.02 lower MoM in September, dropping from $0.441 in August to $0.417.
Summary
National average spot rates broke a three-month losing streak in September, rising 1.0% MoM. The roughly $0.02 increase was consistent with historical seasonality, aligning closely with the long-term average gain of just over $0.01 for the month. The modest uptick marked the third consecutive month of YoY increases and the 13th such gain in the past 14 months, following a brief return to 2024 parity in June.
Weekly movements, as tracked by the DAT 7-Day Average Spot Linehaul Rate Index, continued to exhibit volatility tied to holiday disruptions and seasonal effects. Rates began the month $0.02 higher WoW as capacity remained constrained in the aftermath of the Labor Day holiday. As drivers returned to the road, rates retreated by just over $0.03 WoW in the second week before stabilizing in mid-month trading. Momentum returned in the latter half of September, with rates climbing more than $0.04 over the final two weeks ahead of the quarter’s close, ultimately finishing the month about $0.01 higher than where they began.
In the contract market, initially reported average linehaul rates were virtually unchanged in September after final August data reflected a decline of just under $0.02 MoM — the sharpest monthly drop since October 2023. While contract rates excluding fuel have remained largely stable over the past two years, September’s readings continued to show a modest premium relative to 2024 levels, marking the third consecutive month of YoY gains and only the seventh such occurrence in the last 37 months. With spot rates firming while contract rates held steady, the contract-to-spot spread narrowed to just below $0.42, signaling a gradual rebalancing in market pricing dynamics.
Why It Matters
The uptick in average rates and their continued alignment with typical seasonal patterns in September represent a modestly positive signal as the market heads into the fourth quarter. This period historically benefits from elevated shipping demand and multiple capacity disruptions. However, the durability of this trend remains uncertain amid persistently weak demand and an oversupplied market. Monitoring rate performance through the upcoming peak season will be critical in determining whether current stabilization reflects a true inflection point or merely temporary support driven by seasonal influences.
In its latest monthly outlook, FTR revised its 2025 forecast for total truckload rates (excluding fuel) slightly lower, now projecting a +1.2% YoY increase compared to its prior estimate of +1.6%. The downgrade was primarily attributed to softer expectations for contract rate growth, which FTR now anticipates will rise +1.0% YoY, down from the previously forecasted +1.6%. At the equipment level, flatbed rates are expected to continue outperforming the broader market, with total truck rates projected to climb +1.4% YoY (down slightly from +1.5% previously). Dry van rate growth is now forecasted at +0.8% YoY, a downward revision from +1.4%, while refrigerated rates are expected to rise +0.7% YoY, reflecting a marginal improvement from the prior +0.6% outlook.
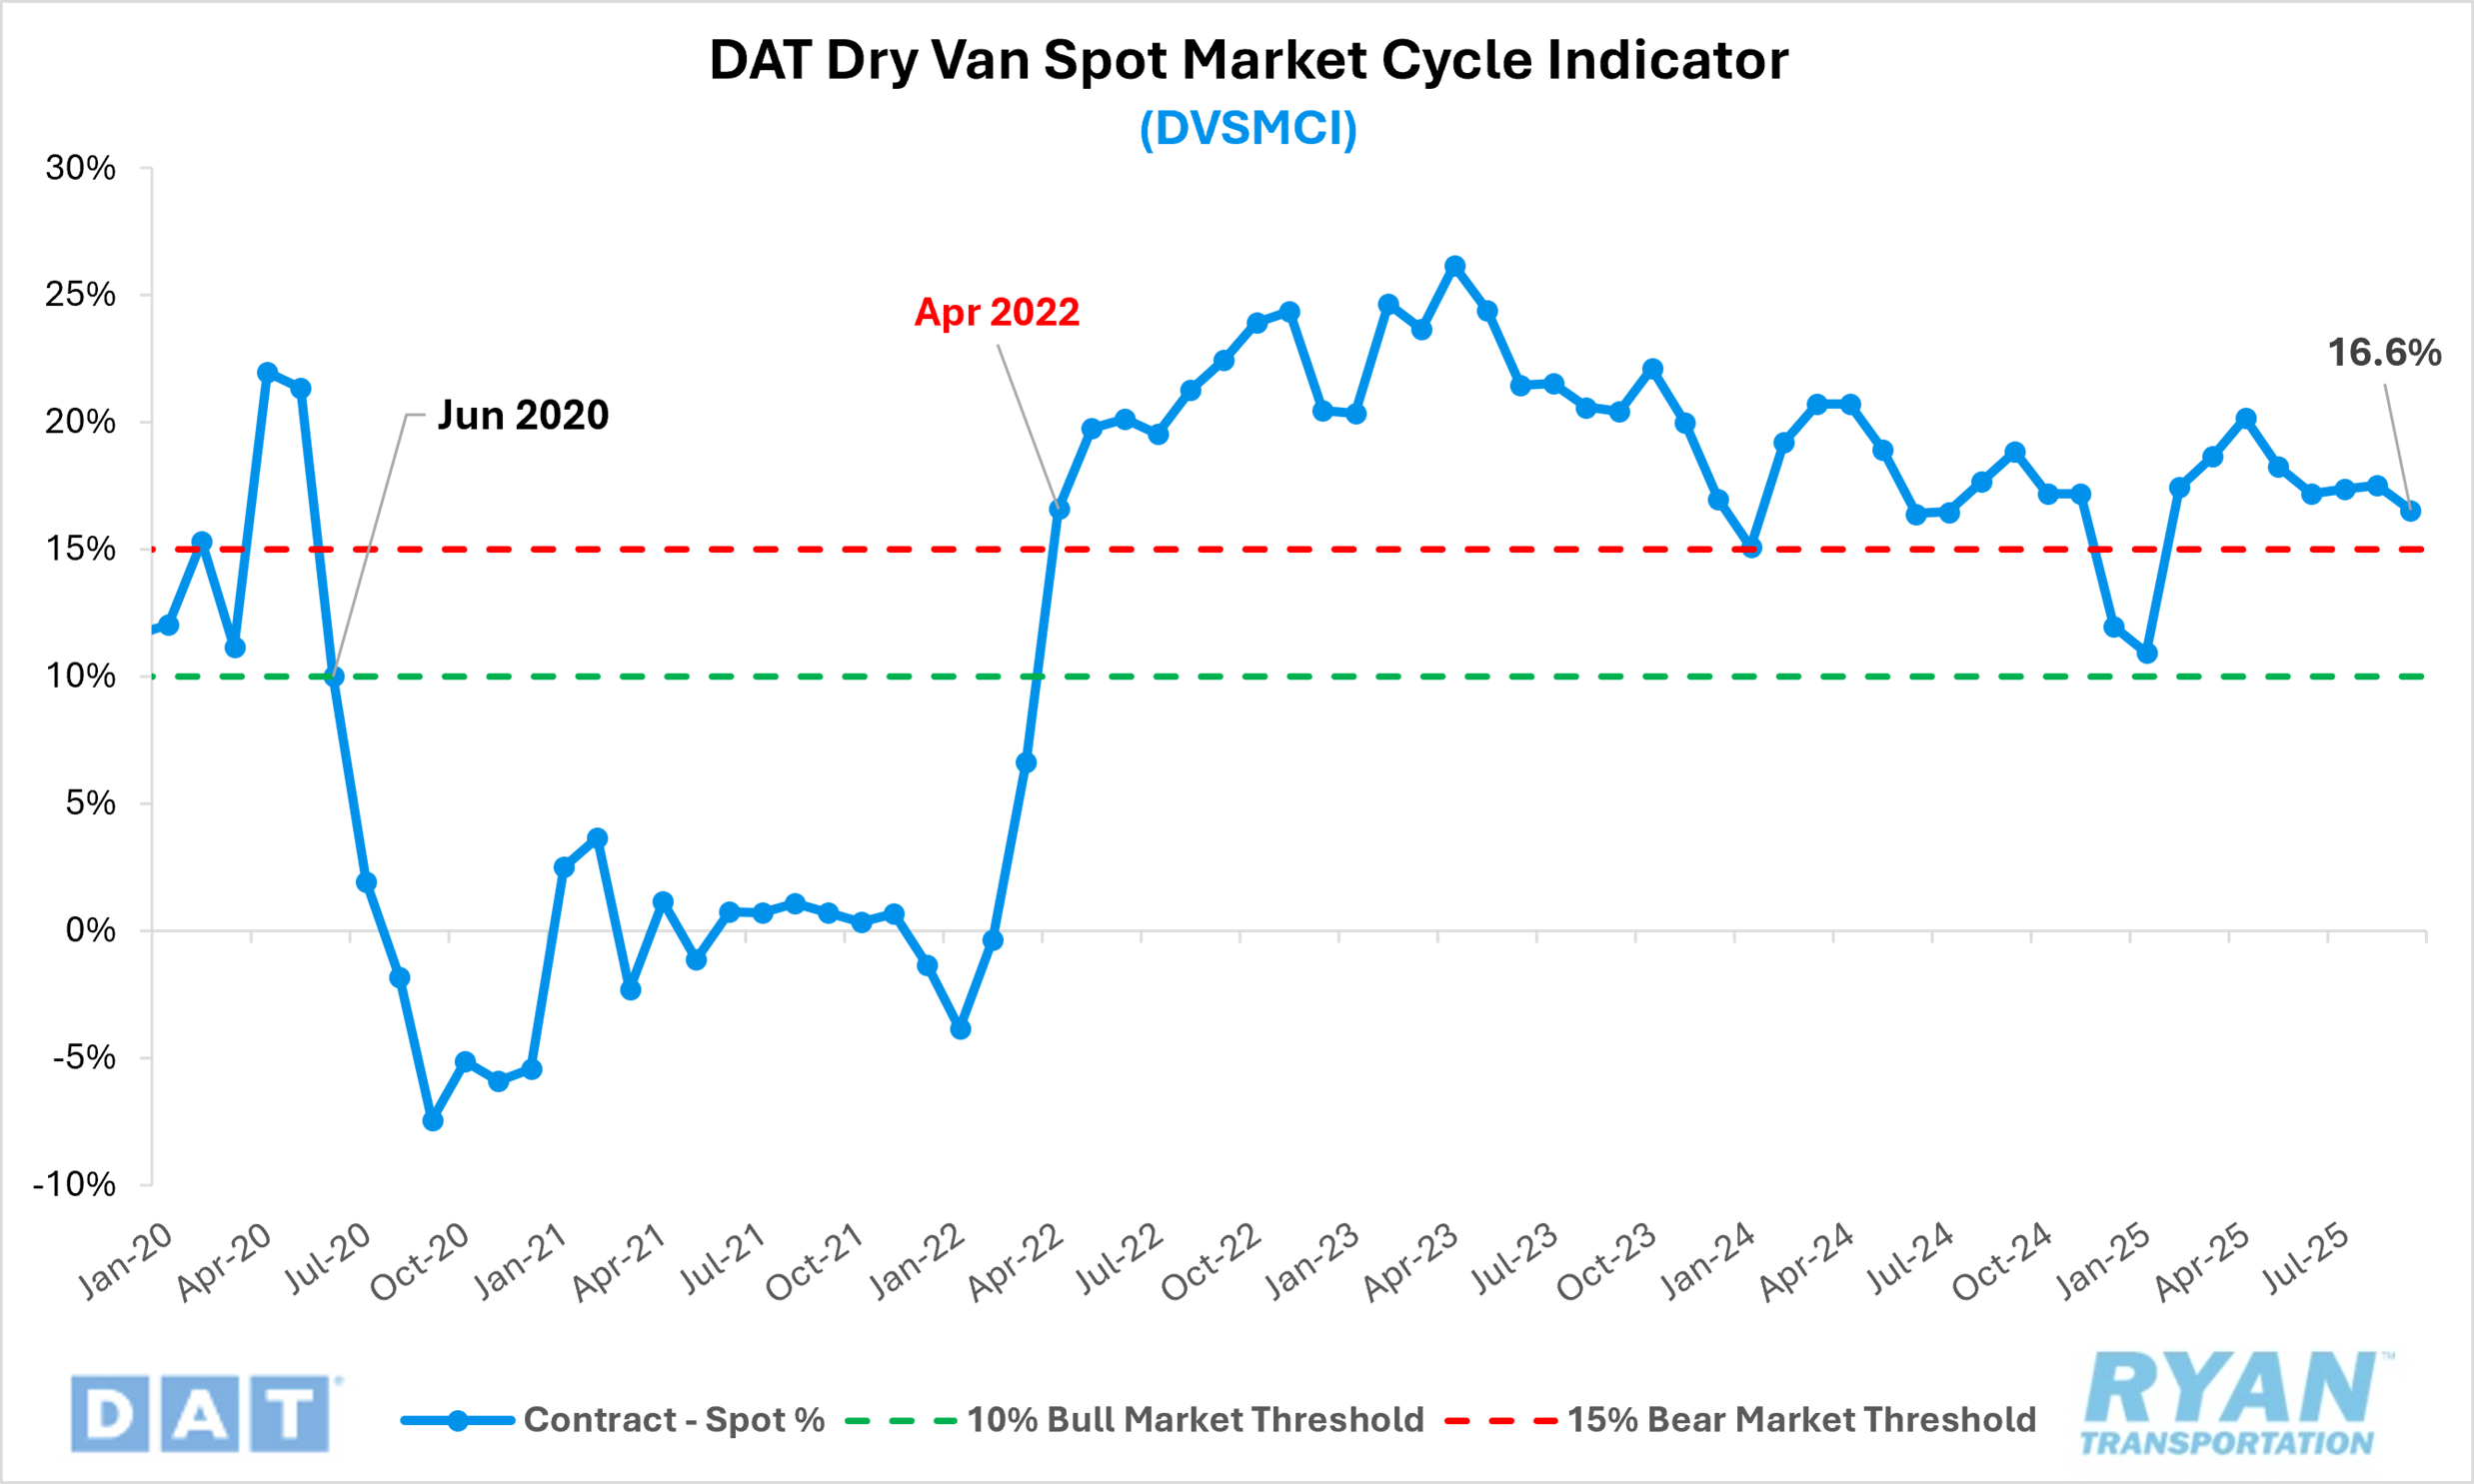
Meanwhile, the marginal increase in average spot rates in September corresponded with a modest improvement in the DAT Dry Van Spot Market Cycle Indicator (DVSMCI) relative to August. According to the latest reading, the DVSMCI declined 0.9% MoM following three consecutive months of gains but remains firmly in bearish territory. Developed by Dr. Jason Miller of Michigan State University, the DVSMCI measures the spread between spot and contract rates relative to their long-term averages; sustained readings above 15% are indicative of bearish conditions, while values below 10% suggest a more bullish market environment. Despite recent stabilization, the indicator’s continued bearish stance underscores the lingering imbalance between capacity and demand that persists across much of the truckload sector.