Back to October 2025 Industry Update
October 2025 Industry Update: Intermodal
Average rail rates improved modestly despite weakening volumes for both the intermodal and carload segments.
Spot Rates
Key Points
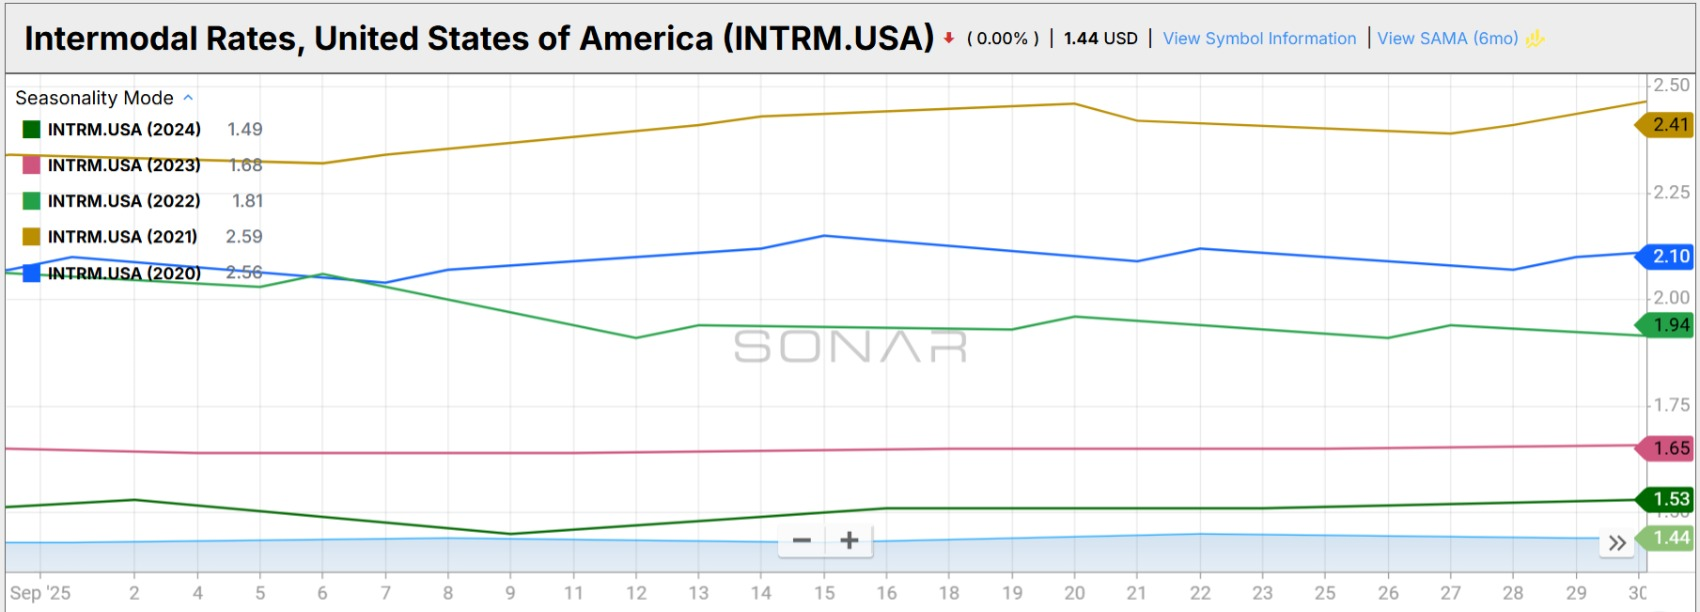
- The FreightWaves SONAR Intermodal Rates Index (INTRM.USA), which measures the average weekly all-in door-to-door spot rate for 53’ dry vans across most origin-destination pairings, increased slightly in September, rising 0.7% MoM, or $0.01, to $1.44.
- Compared to September 2024, average intermodal spot rates were down 5.3% YoY and were 25.3% below the 5-year average.
Volumes
Key Points
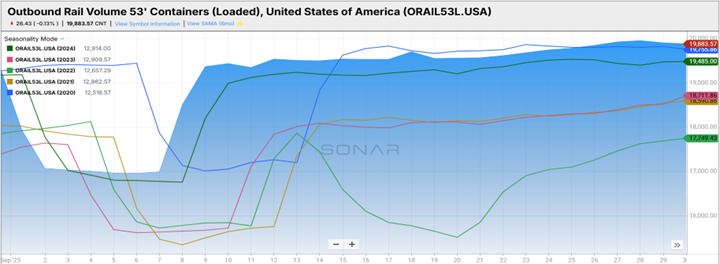
- Total loaded volumes for 53’ containers for all domestic markets, measured by the FreightWaves SONAR Loaded Outbound Rail Volume Index (ORAIL53L.USA), declined 0.4% MoM, dropping from an average of 19,095.86 in August to 19,019.14 in September.
- Average loaded domestic rail volumes for 53’ containers in September were up 1.5% YoY compared to September 2024 and were 6.1% above the 5-year average.
Intermodal Summary
The rail sector’s performance moderated in September, marking a reversal from the brief rebound observed in August as overall activity softened. According to the latest Rail Industry Overview from the Association of American Railroads (AAR), intermodal shipments — which are closely linked to consumer demand and international trade — declined 1.3% YoY compared to September 2024. Despite the annual decrease, weekly intermodal originations averaged 275,559 units, exceeding the YTD weekly average of 271,121 units through the first nine months of 2025. Cumulatively, YTD intermodal volumes reached 10.57 million units, up 3.5% YoY and the highest level for the period since 2021.
Similarly, total U.S. carload traffic fell 1.2% YoY in September, with 12 of the 20 major carload categories posting annual declines. Nonetheless, average weekly carload originations of 225,783 units outpaced the YTD average of 221,853 units, keeping cumulative carloads up 2.1% YoY through September. Despite the moderation in volume trends, intermodal pricing reflected mild improvement, with spot rates registering modest gains while remaining too low to indicate any need for capacity protection among contractual shippers. At $1.64 per mile, intermodal contract rates have increased $0.07 since July — potentially signaling early repricing ahead of the fall bid season. However, rail continues to hold a sizable cost advantage, with contract rates operating at a 20% – 30% discount relative to comparable dry van truckload rates.