Back to October 2025 Industry Update
October 2025 Industry Update: Dry Van
Dry van conditions improved marginally, as average spot rates registered slightly higher while demand improved.
Spot Rates
Key Points
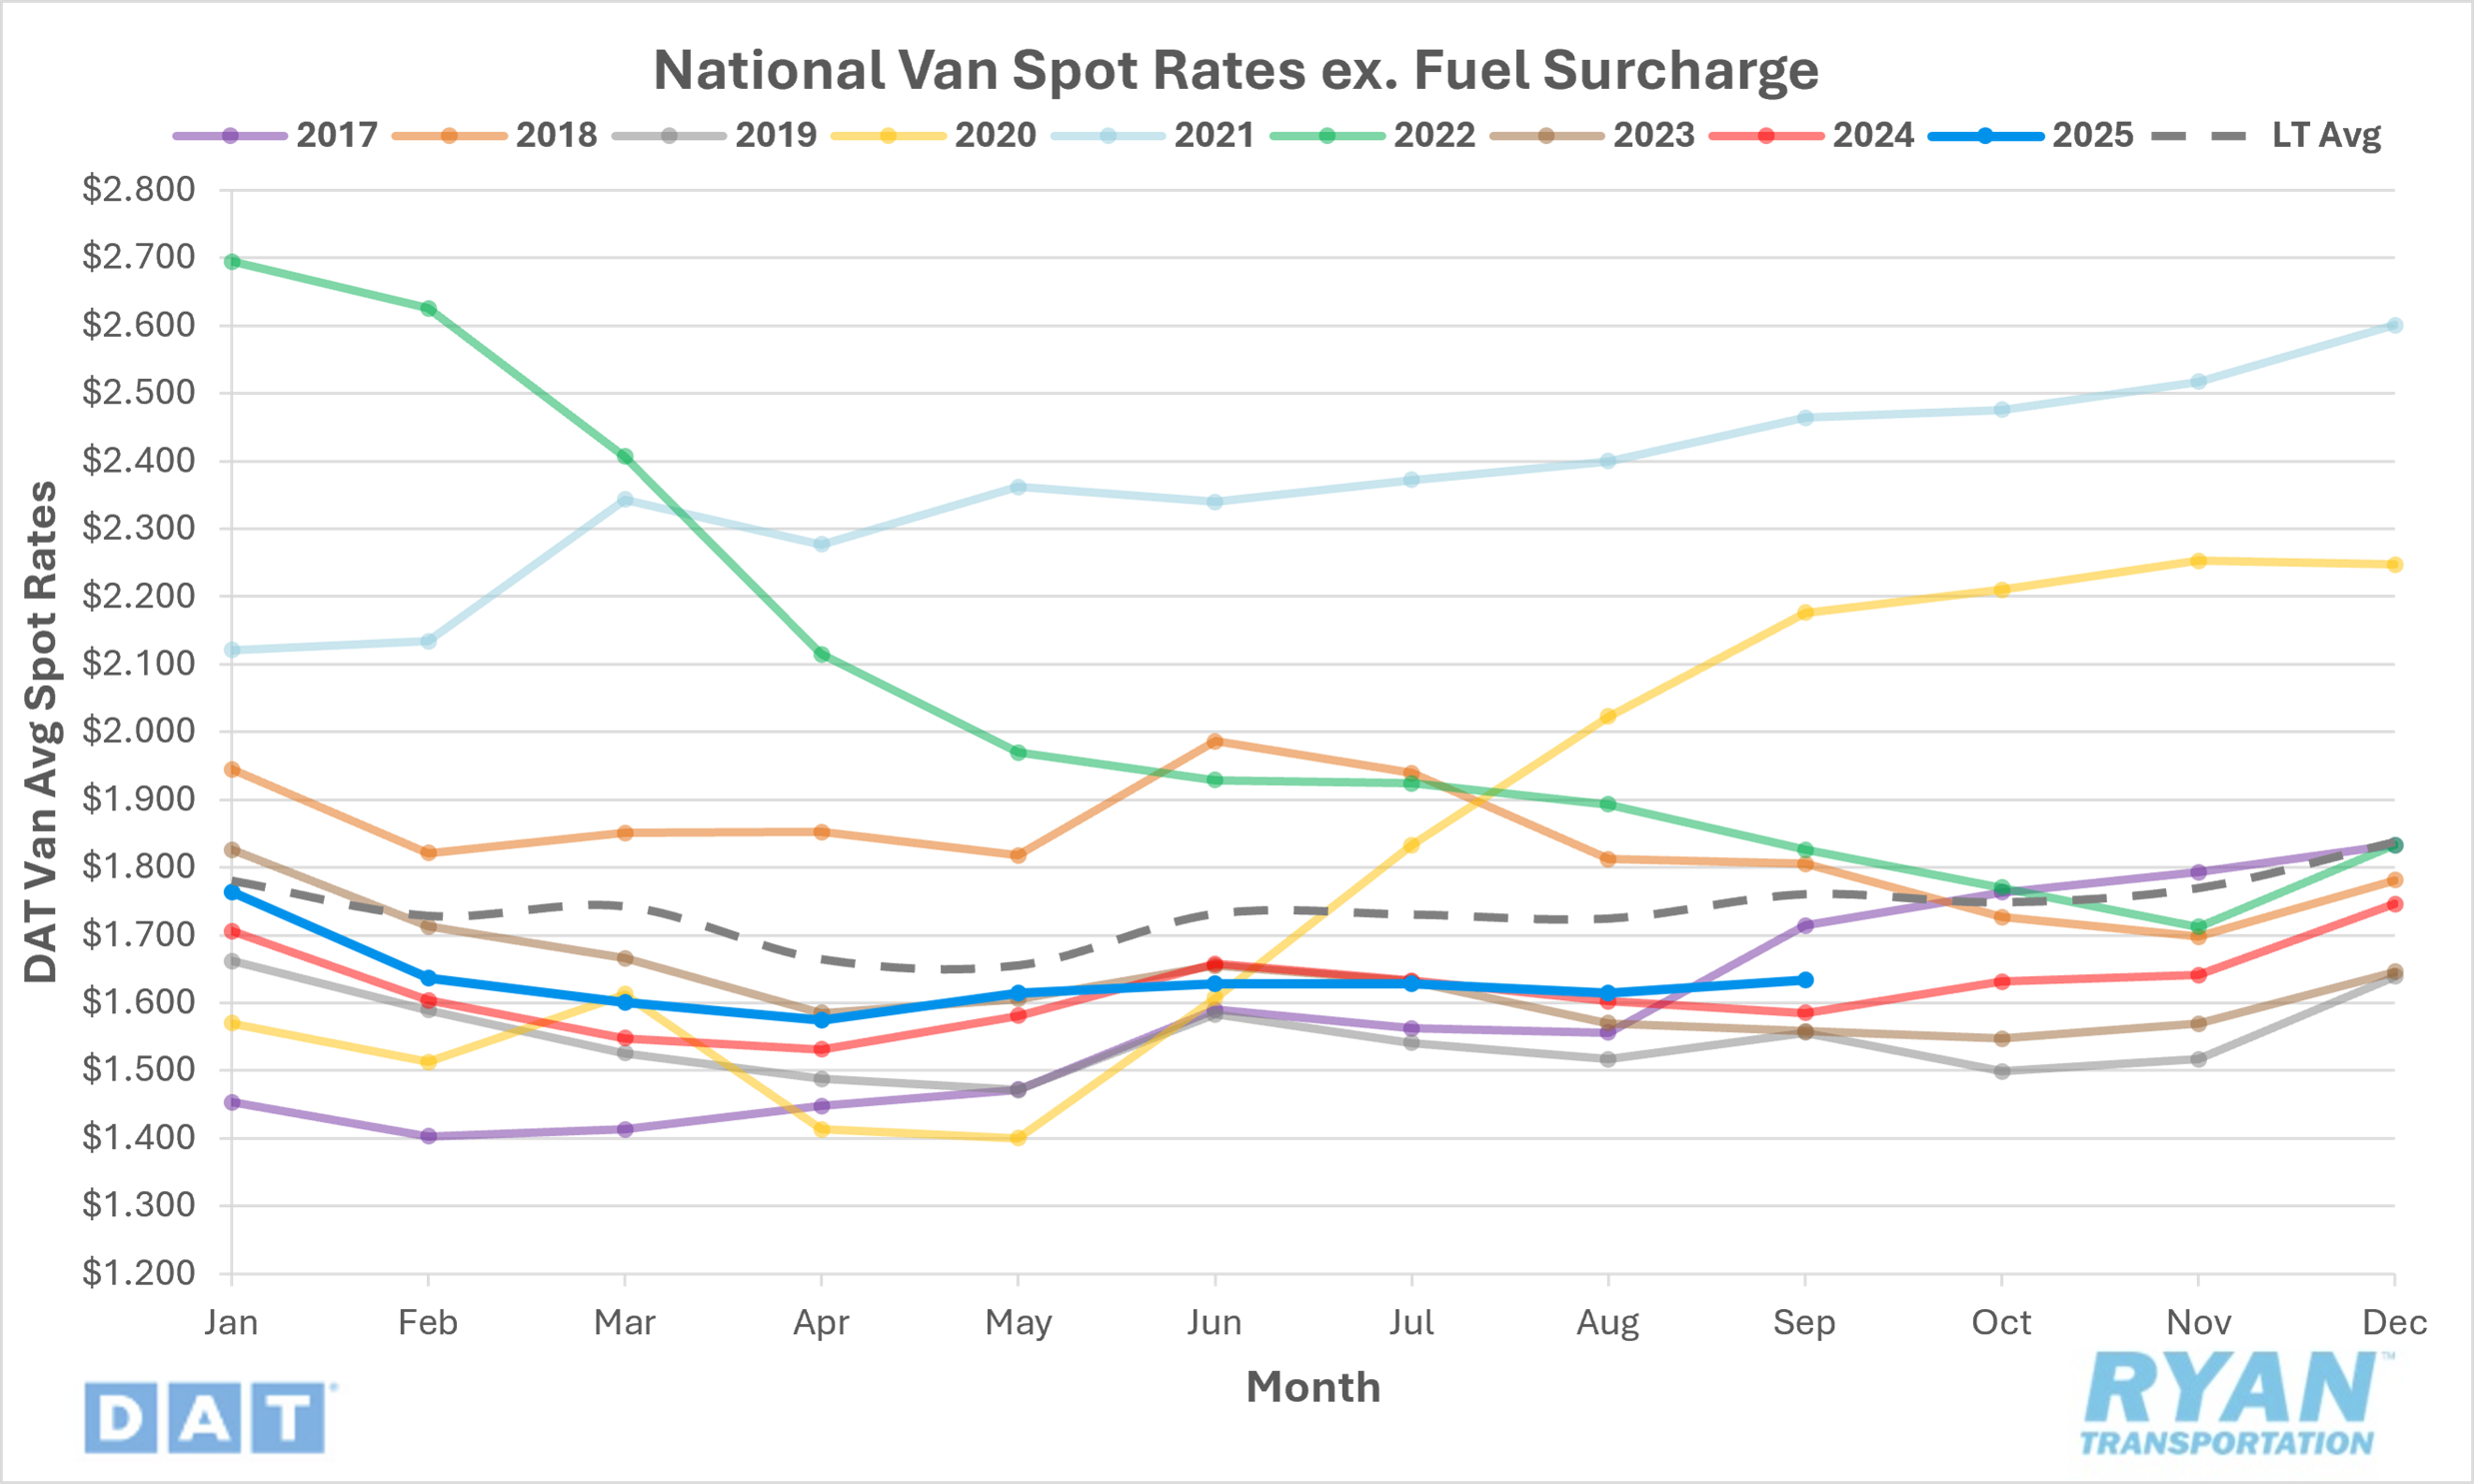
- The national average dry van spot rate, excluding fuel, rose 1.2% MoM, or $0.02, in September to $1.63.
- Compared to September 2024, average dry van spot linehaul rates were up 3.1% YoY but remained 7.3% below the LT average.
- Initially reported average dry van contract rates, exclusive of a fuel surcharge, were unchanged MoM in September and remained 0.5% above YoY levels.
Load-to-Truck Ratio
Key Points
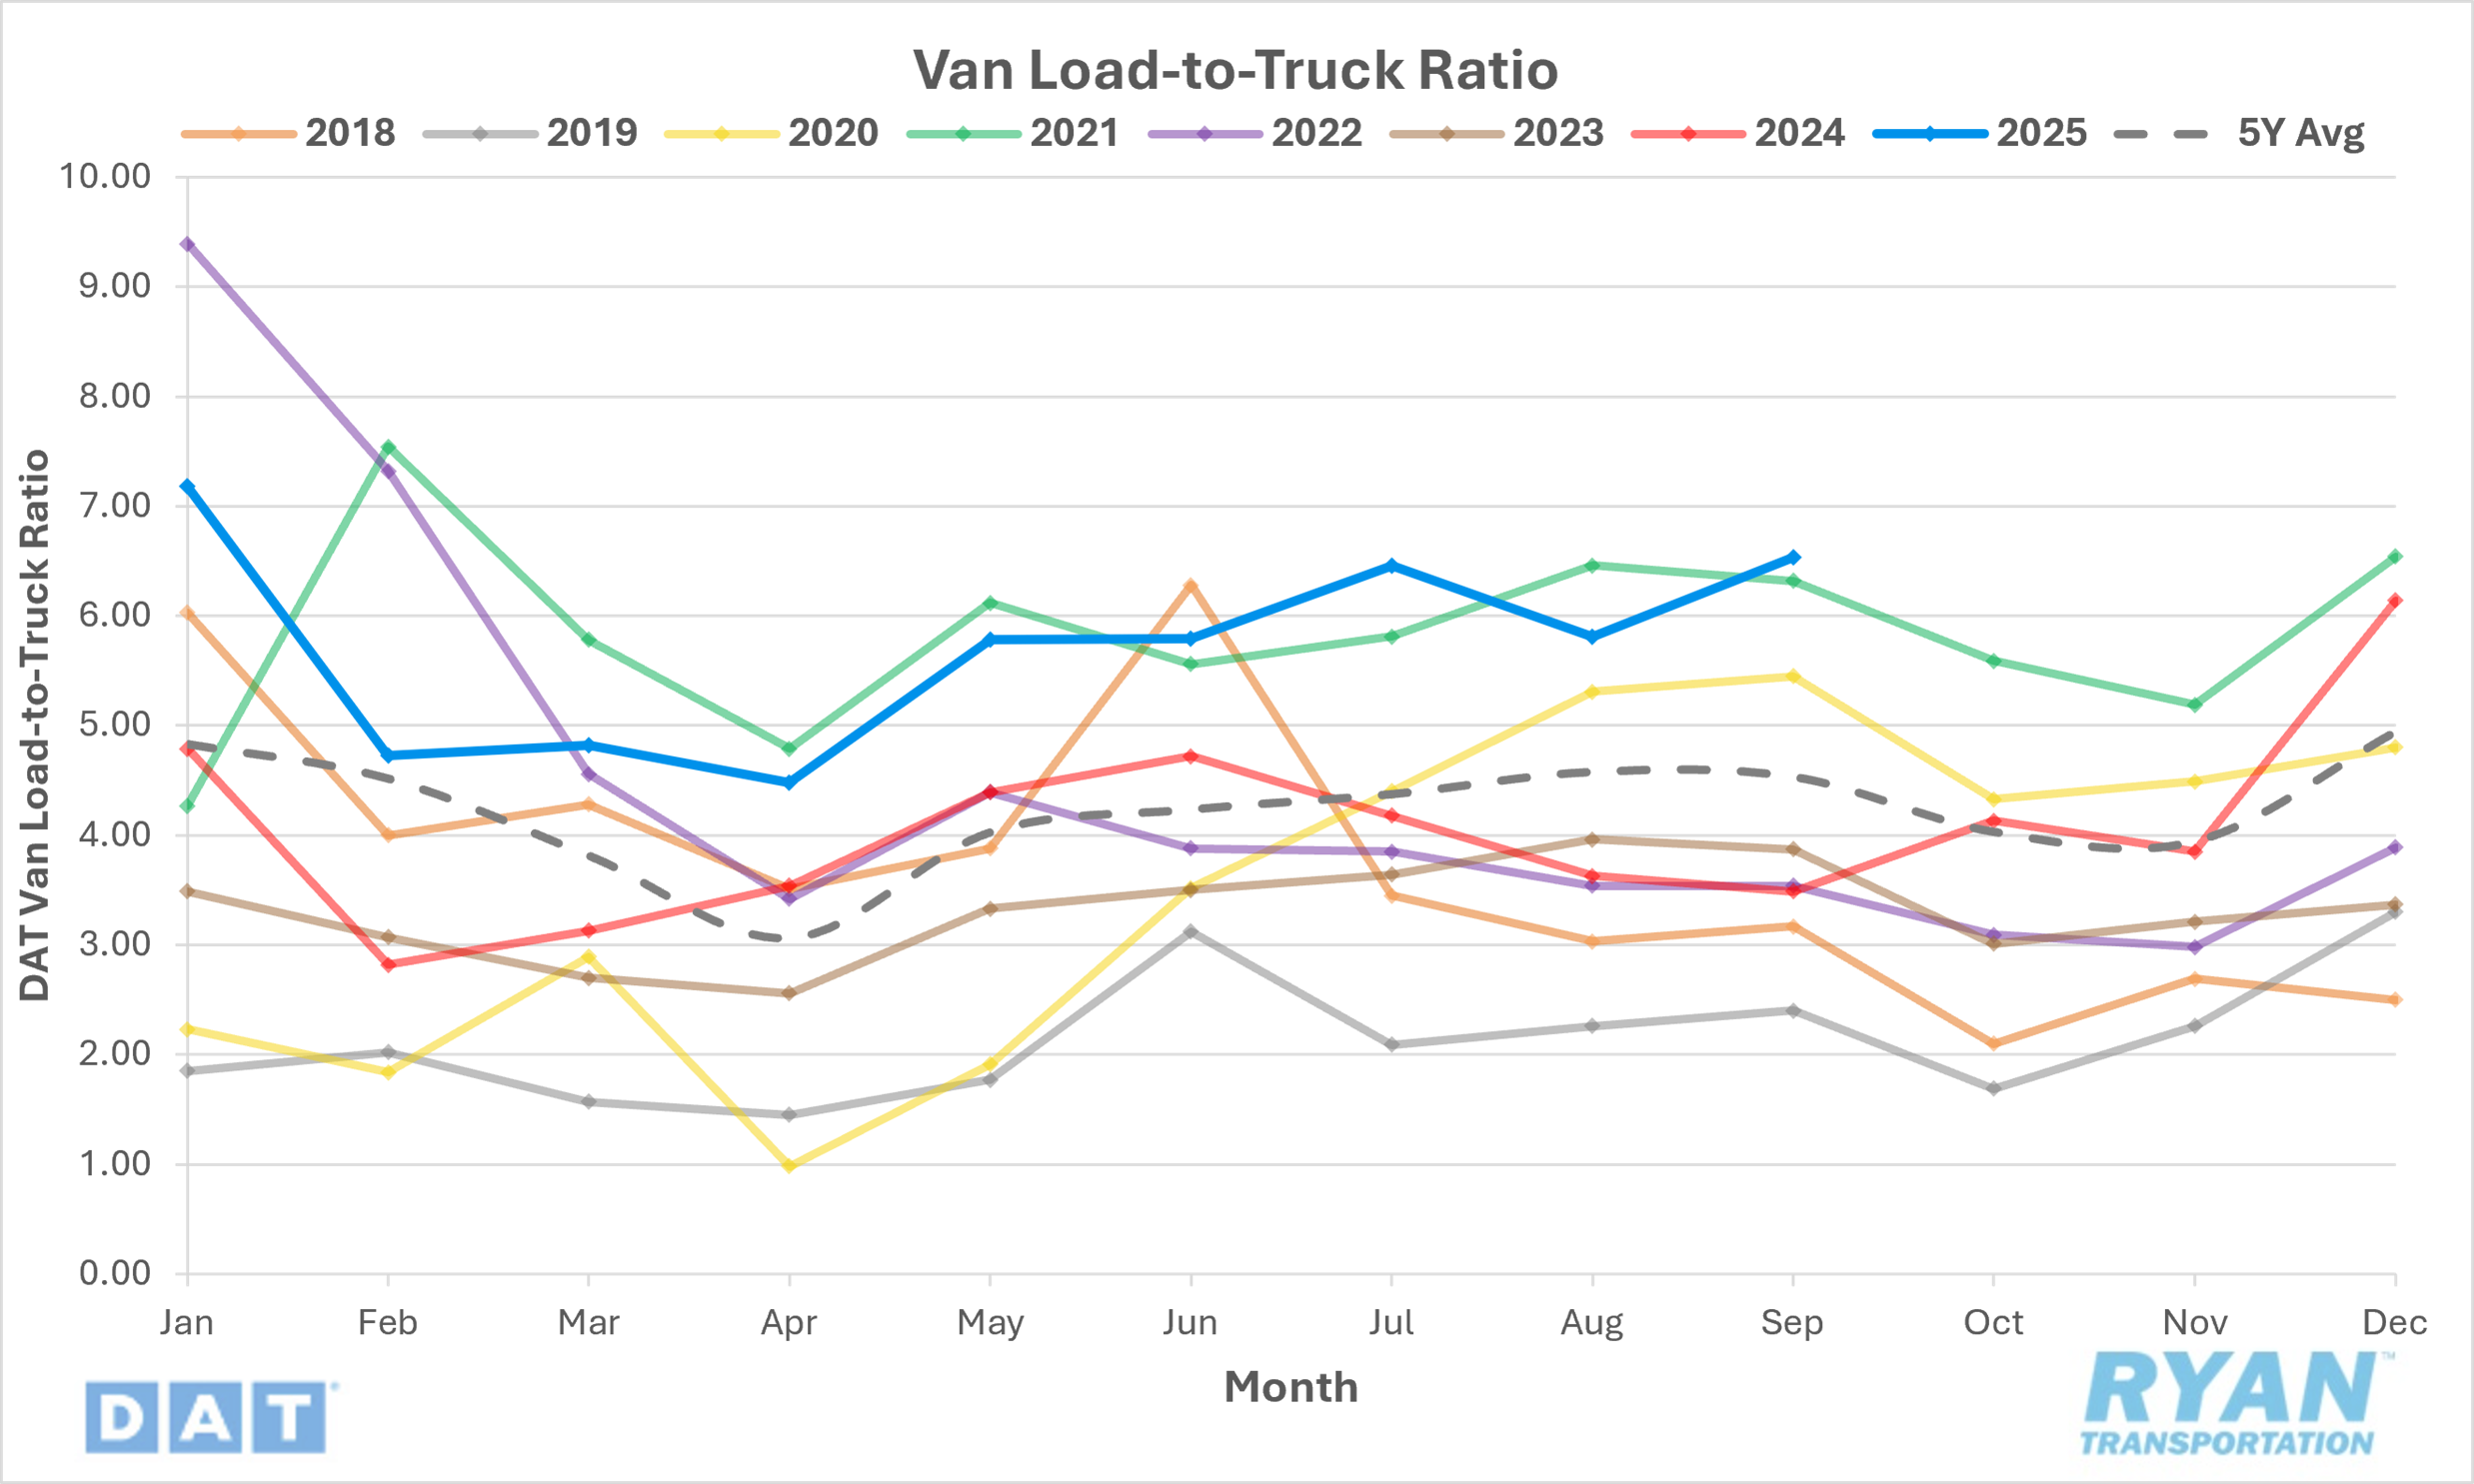
- The dry van load-to-truck ratio (LTR) rose 12.4% MoM in September, rising from 5.81 in August to 6.53.
- Compared to the same time last year, the dry van LTR was up 87.1% YoY and 44.0% above the 5-year average.
- According to load board data collected by DAT Freight & Analytics, dry van load posts were up 13.5% MoM while truck postings for dry vans registered a 1.0% MoM increase.
Market Conditions

Dry Van Summary
The U.S. freight market in mid-2025 shows signs of continued weakness despite modest YoY gains in certain industrial sectors. The trucking ton-mile index declined slightly in June, reflecting uneven demand concentrated in areas like petroleum, machinery and wood products — industries less reliant on dry van freight. Economists suggest that pre-tariff frontloading, declining home construction and weak consumer demand have suppressed expansionary pricing conditions. Cardboard demand, often viewed as a proxy for retail and e-commerce activity, has also fallen, signaling slower consumer goods movement and reinforcing the broader economic slowdown narrative. Rising material costs driven by tariffs, especially on containerboard and key imports, continue to squeeze margins across the supply chain.
Imports fell sharply following July and August’s pre-tariff surge, signaling reduced activity for the remainder of 2025 as trade uncertainty and tariffs reshape global shipping patterns. Analysts project a steep 17.5% drop in U.S. containerized volumes through year-end, marking one of the largest declines in modern trade history. The shift of freight away from U.S. ports to Canada and Mexico further underscores how tariffs are distorting traditional logistics flows. With import normalization and weaker retail demand, dry van freight — closely tied to consumer goods — faces persistent pressure through the remainder of the year.
By September 2025, the U.S. trucking industry had entered a drawn-out correction cycle following its 2023 contraction. Although capacity is tightening slowly, overall freight volumes remain subdued, and rate recovery continues to lag. Spot rates, which briefly improved during pre-tariff shipping, have fallen below seasonal norms, with Q4 likely to be particularly weak. Contract rates remain steady but stagnant as carriers focus on cost control, equipment management and flexibility amid tariff-driven inflation, uncertain emissions regulations and fragile demand.