Back to May 2025 Industry Update
May 2025 Industry Update: Truckload Supply
Tender rejections continue to indicate tighter market conditions but excess supply still remains
Key Points
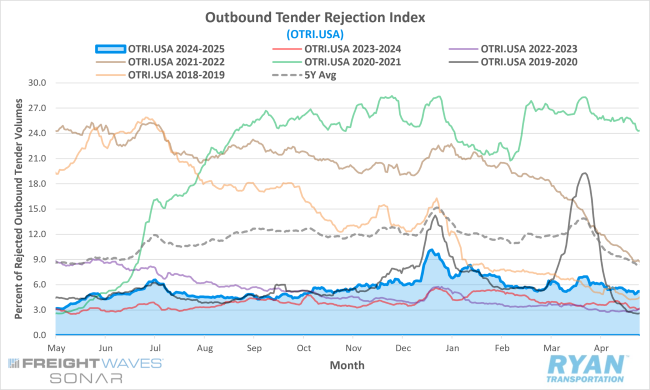
- The FreightWaves SONAR Outbound Tender Rejection Index (OTRI.USA), a measure of relative capacity based on carriers’ willingness to accept freight volumes under contract reflected as a percentage, registered 72 basis points (bps) lower at the end of April compared to the end of March, dropping from 5.94% to 5.22%.
- The monthly average of daily tender rejections in April fell 42 bps MoM, declining from an average of 6.03% in March to 5.61%.
- On an annual basis, average daily tender rejections remained higher by 1.95% YoY compared to April 2024, but were 4.21% below the 5-year average.
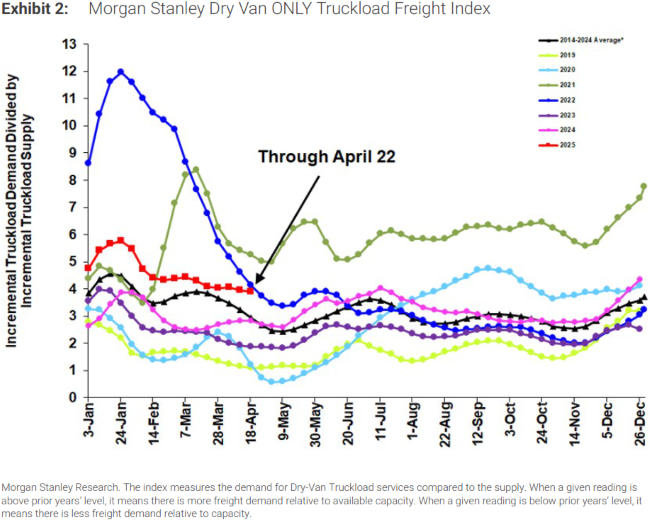
- Despite slight sequential declines in April, the Morgan Stanley Truckload Freight Index (MSTLFI) outperformed seasonality throughout the month driven by outperformance in both supply and demand components.
Summary
Following elevated volatility in March, tender rejections stabilized into a more consistent—albeit downward—trajectory in April. Despite ongoing headwinds in a weakening demand environment, rejection rates held up relatively well, remaining elevated compared to the same period last year and outperforming typical seasonal patterns for the month. April marked the 16th consecutive month of YoY increases in monthly average tender rejections, signaling tighter market capacity relative to April 2024.
From a seasonality standpoint, April’s 42 bps MoM decline in average rejection rates was significantly milder than the historical seasonal average decline of 271 bps for the month. While this relative outperformance could suggest emerging signs of market tightening on a short-term basis, recent spikes in flatbed rejections may have distorted the national index, inflating the overall reading. Flatbed equipment was the primary driver of March’s volatility, with average rejections increasing 16.6% MoM—from 10.4% in February to approximately 27% in March. In contrast, dry van and reefer rejections posted slight MoM declines of 0.1% and 2.5%, respectively. While all three equipment types experienced marginal MoM decreases in April, rejection rates remained meaningfully above year-ago levels: flatbed rejections rose 11.4% YoY, dry van increased 1.6% YoY, and reefer climbed 5.1% YoY.
The latest Morgan Stanley Truckload Freight Index indicated relatively stable performance throughout April, outperforming seasonal expectations after two months of underperformance. This improvement was driven by notable strength in both demand and supply metrics. Demand rose by approximately 170 bps, contrasting sharply with the historical seasonal decline of roughly 600 bps. On the supply side, capacity increased by ~610 bps, well below the typical seasonal surge of ~4,240 bps.
However, the report also underscored a significant shift in market sentiment between the first and second halves of the month across the index’s core components: Truckload Demand, Truckload Supply and Truckload Rates. Early April sentiment was broadly optimistic, driven by perceptions of increased demand and tightening capacity that supported higher rate expectations. By the latter half of the month, sentiment had turned notably negative, with all components reflecting deteriorating outlooks. While certain regions continued to experience isolated pockets of strength, broader market conditions remained challenged by persistent supply-demand imbalances.
Why It Matters:
Despite softening freight volumes, rejection rates remain elevated, aligning with levels observed during the same period last year. This trend indicates that the contraction in available capacity has more than offset the impact of declining demand.
This dynamic was underscored in the Q1 2025 U.S. Bank Truckload Freight Index report, which highlighted that the decline in the National Spend Index was less pronounced than the decline in the National Shipments Index. Specifically, the National Shipments Index declined by 5.8% QoQ and 13.8% YoY, while the National Spend Index decreased by 2.5% from Q4 2024 and 8.6% compared to Q1 2024. While early 2025 increases in diesel prices—and the resulting rise in fuel surcharges—exerted upward pressure on spending, the divergence between spending and shipment volumes more likely reflects tightening industry capacity.
The persistent contraction in capacity over the past year led many analysts and industry stakeholders to anticipate a more constrained market environment in 2025, with expectations of a rebalancing supported by continued economic growth. However, heightened tariff uncertainty has dampened import projections and further curtailed domestic manufacturing output, resulting in deteriorating near-term demand.
In response to weakening volumes and a more uncertain demand outlook, several major publicly traded carriers have initiated operational reductions. As disclosed in recent earnings reports, Werner Enterprises reduced its tractor count by 4.7% YoY in Q1, while Knight-Swift downsized its fleet by 6.0% relative to the same period in 2024.
According to FTR’s latest monthly report, the Active Truck Utilization Index—which measures the percentage of the active truck population required to meet U.S. freight demand—registered 93.5% in March, reflecting a 0.3% MoM decline from February. On a YoY basis, active utilization rose by 1.2% compared to March 2024 and has consistently exceeded the 10-year average of 92.5% since April of last year. This sustained elevation signals a relatively tighter market than a year ago.
FTR forecasts a near-term decline in active utilization due to tariff-driven pull-forward effects and ongoing market uncertainty. Nonetheless, current projections suggest utilization will remain above the 10-year average for the remainder of the year, albeit approximately one percentage point below prior forecasts.