Back to May 2025 Industry Update
May 2025 Industry Update: Intermodal
Both intermodal and carload volumes continued to register growth in April, while overall rates remained static.
Spot Rates
Key Points
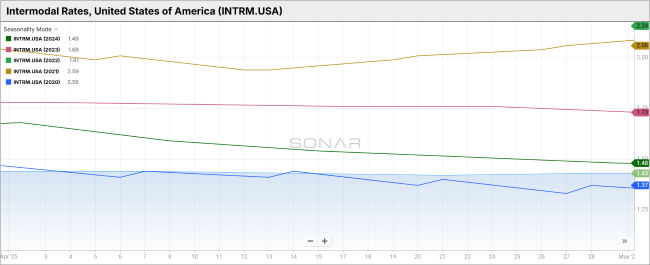
- The FreightWaves SONAR Intermodal Rates Index (INTRM.USA), which measures the average weekly all-in, door-to-door spot rate for 53’ dry vans across most origin-destination pairings, ended April $0.01 lower MoM at $1.43.
- Compared to April 2024, intermodal spot rates were down 3.4% YoY and were 19.5% below the 5-year average.
Volumes
Key Points
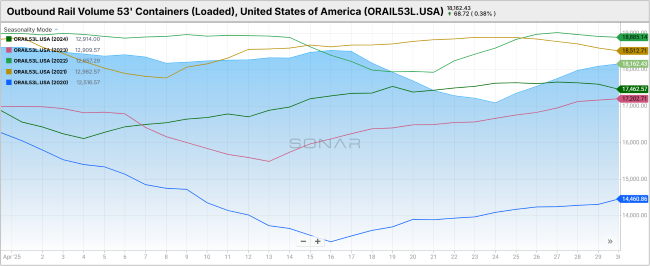
- Total loaded volumes for 53’ containers for all domestic markets, measured by the FreightWaves SONAR Loaded Outbound Rail Volume Index (ORAIL53L.USA), declined 2.4% MoM, dropping from 18,607.71 at the end of March to 18,162.43 in April.
- Loaded domestic rail volumes for 53’ containers in April were up 5.0% YoY compared to April 2024 and are 4.0% higher than the 5-year average.
Intermodal Summary
Rail activity demonstrated continued resilience in April, as the pull-forward of import volumes contributed to rail carriers gaining market share from the softening truckload sector. According to the latest industry report from the Association of American Railroads (AAR), total rail traffic experienced growth during the month, driven by sustained strength in intermodal volumes and gains across several carload categories.
Per AAR data, U.S. railroads originated approximately 1.36 million intermodal containers and trailers in April—representing a 7.4% YoY increase compared to April 2024. On a weekly basis, intermodal volumes averaged 272,300 units, marking the second-highest weekly average for the month of April on record, behind April 2021’s 290,955 units. This strength in intermodal performance is also evident in YTD metrics: through the first four months of 2025, intermodal volumes are up 8.1% YoY, representing the second-highest total ever recorded for this period, only trailing 2021.
Carload activity also registered notable improvements, posting both monthly and annual increases for the second consecutive month. In April, domestic carload originations totaled 1.13 million units, up 6.2% YoY—the largest percentage gain in the past 16 months and the third-largest increase in nearly four years. Weekly average carloads stood at 225,569 units, a slight decrease from March, but otherwise the highest reading since October 2024. The rebound in carload volumes was primarily driven by a significant surge in coal shipments, which have traditionally been a headwind for overall carload growth. Coal carloads increased by 23.2% YoY in April, while carloads excluding coal rose a modest 1.4% YoY.
Despite the ongoing strength in volume, pricing trends have yet to reflect rising utilization levels across the rail sector. On the contract side, rates tracked by the FreightWaves SONAR Intermodal Contract Rate Index (IMCRPM1.USA)—which monitors average initial contract rates excluding fuel—fell to $1.52 in early April, the lowest level since the first week of September 2024. However, rates steadily recovered in the latter half of the month, ending April at $1.70, up $0.06 MoM compared to March and $0.15 higher YoY. Conversely, spot market rates indicate a lack of urgency among carriers to safeguard contracted volumes, as spot pricing fell to its lowest point since September 2017—excluding the early months of the COVID-19 pandemic.