Back to May 2025 Industry Update
May 2025 Industry Update: Economy
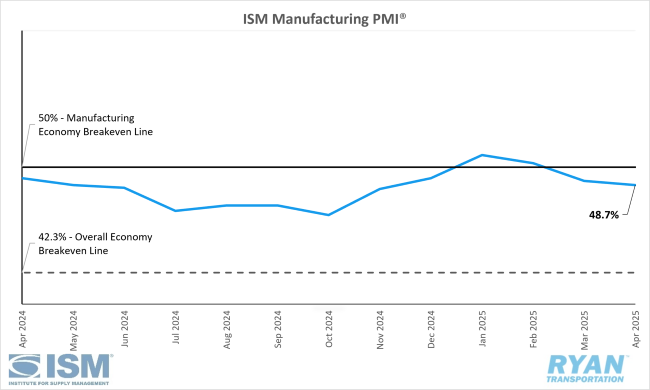
Domestic manufacturing activity contracted as tariff uncertainty further weighed on demand and output.
United States ISM Manufacturing PMI
Key Points
- The Institute of Supply Management® (ISM®) Manufacturing PMI® registered 48.7% in April, a 0.3% decrease from March’s reading of 49.0%, remaining in contraction territory.
- The New Orders Index rose by 2.0% in April, increasing from 45.2% in March to 47.2%.
- The Production Index moved deep into contraction territory in April, dropping 4.3% from March’s reading of 48.3% to 44.0%.
- The Employment Index registered 46.5% in April, 1.8% higher than the 44.7% recorded in March.
- The New Export Orders Index declined significantly in April, registering 43.1% and 6.5% below the March reading of 49.6%.
Summary
Following two months of expansion earlier this year—which ended a 26-month period of contraction—U.S. manufacturing activity returned to contractionary territory for the second consecutive month in April, according to the latest ISM® Manufacturing PMI® report. Similar to March, April’s data reflected continued headwinds for economic growth, characterized by weakening demand and output fundamentals, while input-related components showed ongoing strength.
Despite the contraction in manufacturing, the broader U.S. economy continued its growth trajectory in April, marking 60 consecutive months of economic expansion following a brief contraction in April 2020. (Historically, a Manufacturing PMI® reading above 42.3% over time is consistent with growth in the overall economy.)
On the demand side, persistent softness was underscored by continued contraction in the New Orders Index and a sharp decline in the New Export Orders Index. These declines pushed both the Backlog of Orders and Customers’ Inventories indices deeper into contraction. Panelists cited weakening demand, with sentiment evenly split between positive outlooks and concern over near-term demand. A key area of concern was the significant drop in new export orders, attributed to slowing international growth and the impact of retaliatory tariffs. Notably, the 6.5 percentage point decline in the New Export Orders Index marked the steepest monthly drop since April 2020 (down 11.3%), and—excluding pandemic-related impacts—represented the lowest reading since the Great Recession in April 2009 (42.9%).
This ongoing decline in demand continued to weigh heavily on output. The Production and Employment indices together contributed a 2.5 percentage point drag on the Manufacturing PMI®. While both metrics remained in contraction, the primary driver of weakness was a notable decrease in production. Survey respondents indicated repeated downward revisions to production schedules due to persistent economic challenges. Although employment levels saw a slight uptick, they remained in contraction territory as firms continued to adjust workforce levels. ISM® panelists reported an equal split between hiring and staff reductions, with layoffs serving as the predominant workforce management tool—suggesting an increasing sense of urgency in headcount adjustments.
Input components of the PMI®—including Supplier Deliveries, Inventories, Prices and Imports—continued to exhibit expansion in April, except for Imports. The report attributes much of this input growth to a front-loading of orders in anticipation of further tariffs, a trend viewed negatively in light of softening demand. The most significant gain among the input indices was the 1.7 percentage point increase in the Supplier Deliveries Index. Given the index’s inverse nature, the rise reflects slower delivery times, driven by strained supplier capacity, port processing delays and ongoing negotiations over tariff responsibilities. The Prices Index also increased for the seventh consecutive month, primarily due to rising steel and aluminum costs, as well as the imposition of a broad 10% tariff on many imported goods.
Among the six largest manufacturing sectors—Chemical Products; Transportation Equipment; Computer & Electronic Products; Food, Beverage & Tobacco Products; Machinery; and Petroleum & Coal Products—four (Petroleum & Coal Products; Computer & Electronic Products; Machinery; and Chemical Products) reported growth in April, representing an improvement over the prior month.
Why it Matters:
Despite the impact from tariffs being present across the data in April, alongside the turmoil it caused in the markets, the ISM® Manufacturing PMI® headline figure beat analysts’ expectations and reflected only a mild contraction in manufacturing activity in the U.S. However, according to Timothy Fiore, Chair of the ISM® Manufacturing Business Survey Committee, the underlying data from the five subindexes that directly factor into the PMI®, as well as the other five that support them, were signaling quite a bit of negativity in what he labeled as an “alarming report.”
According to Fiore, the index is heading in the wrong direction with little hope for fixing itself without some clarity in the tariff environment. The most notable red flags cited by Fiore in the report revolved around the further expansion of input components despite ongoing contracts in both demand and output. In terms of input readings, the rise in the Suppliers Deliveries and Inventories indices was more so indicative of trade turbulence rather than being driven by demand factors. The decline in output, however, does appear to be a result of weakening demand given the Production Index’s resiliency over the past three months in the face of persistent sluggish demand. According to Fiore, the declining Production Index figure is a signal for declining revenues, which ultimately leads to declining headcounts and the start of a vicious circle. Fiore noted that April’s Production Index reading of 44.0%, its lowest since May 2020, remains a flashing yellow light, while anything under 44% becomes red.
The uncertainty surrounding tariffs have also exacerbated the already weak demand levels as people and companies remain unsure of where and how to spend their money given the continuous shifts in policies. According to Fiore, the confusion and complexity surrounding the roll-out of tariffs has created an artificial constraint on supply chains. While it has yet to be lethal, as companies have become more adaptable to fluctuating demand following the pandemic, there still remains the potential for a bullwhip effect once the confusion has been cleared up, resulting in another supply shock.
Macroeconomic Conditions
Inflation
The Federal Reserve’s preferred inflation gauge came in cooler than expected while consumer spending remained strong in March according to the most recent Personal Income and Outlays report from the Bureau of Economic Analysis (BEA). The Core Personal Consumption Expenditures (PCE) Price Index, which excludes volatile food and energy prices, was flat MoM in March, softer than the +0.1% consensus and +0.5% in February, revised up from the initially reported +0.4%. Annual comparisons reflected an increase of 2.6% YoY in March, matching the consensus and lower than the +3.0% in February, revised up from +2.8%. Meanwhile, headline PCE rose 0.7% MoM compared to the +0.5% consensus and February increase, up from the initial +0.4% and increased 2.3% annually, 0.1% above the +2.2% consensus and +2.5% in the prior month.
Real Gross Domestic Product (GDP)
The advanced estimate of U.S. real GDP indicated an annualized 0.3% QoQ decrease in Q1 2025, coming in lower than the +0.2% consensus and well below the 2.4% annualized growth recorded in Q4 2024, according to the latest GDP report from the BEA. Per the report, the drop in real GDP in Q1 reflected an increase in imports, which are a net drag on the GDP calculation, as well as a decline in government spending. However, those were partly offset by increases in private investment, consumer spending and exports.