Back to May 2025 Industry Update
May 2025 Industry Update: Dry Van
Declining demand continued to push down overall rates for dry vans.
Spot Rates
Key Points
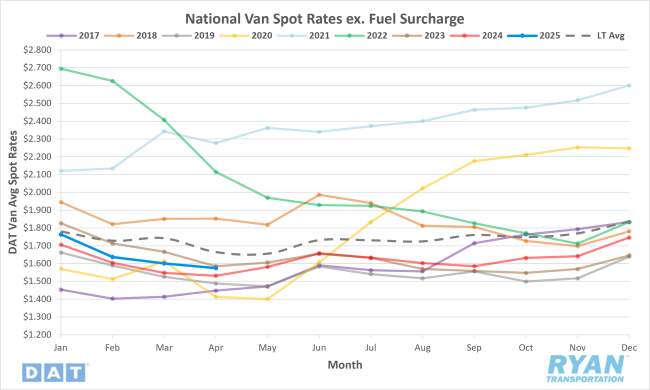
- The national average dry van rate exclusive of a fuel surcharge declined by 1.7% MoM, or just under $0.03, in April to $1.57.
- The average dry van spot linehaul rate was up 2.8% YoY compared to April 2024 and 5.5% below the LT average.
- Initially reported dry van contract linehaul rates were up 0.1% MoM in April and 1.2% higher YoY compared to April of last year.
Load-to-Truck Ratio
Key Points
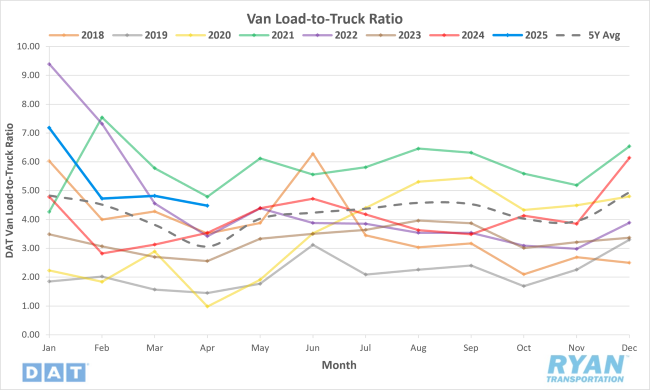
- The dry van load-to-truck ratio (LTR) fell 7.1% MoM, dropping from 4.82 in March to 4.48 in April.
- Compared to April 2024, the dry van LTR was up 26.6% YoY and 46.5% higher compared to the 5-year average.
- According to DAT load board data in April, dry van load posts were 1.9% lower MoM compared to March while equipment posts were up 5.7% MoM.
Market Conditions

Dry Van Summary
In February, the ports of Savannah and Charleston stood out among U.S. ports, registering significant increases in imported container volume while national figures declined. This growth was driven primarily by a surge in furniture imports, as importers rushed to bring in goods ahead of anticipated tariff hikes—particularly on goods from China. Furniture imports in these ports rose by 18% and 36% respectively, with Asia accounting for 90% of those volumes. The increased import activity bolstered inbound and outbound freight volumes in the Southeast, with High Point, NC, seeing a 45% YoY increase in outbound shipments. This regional strength reflects a longstanding infrastructure advantage and central access to much of the U.S. population.
Nationally, freight volumes showed early signs of recovery in 2025, with truck tonnage increasing 3% in February and 0.2% YoY in March, despite a monthly 1.5% decline. These figures mark the first consecutive YoY gains since early 2023, suggesting positive momentum after a lengthy downturn. Much of February’s strength was attributed to tariff-driven frontloading of goods, masking weaker demand from key sectors such as domestic manufacturing. Analysts note that current volumes are even exceeding pandemic-era peaks, though this is likely unsustainable given macroeconomic headwinds. The mixed freight data highlights how sensitive the market is to geopolitical and trade developments.
March’s Logistics Manager’s Index fell sharply to 57.1, the lowest since August 2024, as all cost-related metrics—inventory, warehousing and transportation prices—declined significantly. This points to a slowdown in activity following the early-year shipping rush, with supply chains pulling back as trade uncertainty intensifies. With sweeping tariffs now enacted across all major U.S. trade partners, the Global Port Tracker projects a steep drop in imports through the summer, ending a streak of 19 months of YoY growth. Major ports, especially Los Angeles, have already seen double-digit declines in import volume from China, driven largely by reduced furniture shipments.
Back to May 2025 Industry Update