Back to June 2025 Industry Update
June 2025 Industry Update: Truckload Supply
Multiple capacity disruptions throughout the month led to rejection rates trending higher in May.
Key Points
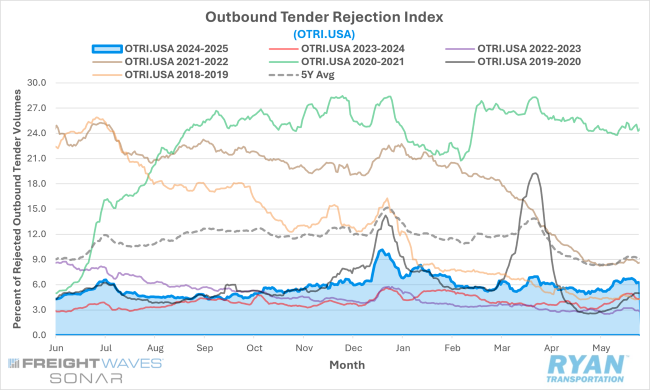
- The FreightWaves SONAR Outbound Tender Rejection Index (OTRI.USA), a measure of relative capacity based on carriers’ willingness to accept freight volumes under contract reflected as a percentage, registered 40 basis points (bps) higher MoM at the midway point in May compared to April, increasing from 5.49% to 5.89%.
- The monthly average of daily tender rejection in May was up 34 bps MoM, rising from 5.61% in April to 5.95%.
- On an annual basis, average daily tender rejections remained elevated by 1.89% YoY but were 2.77% below the 5-year average.
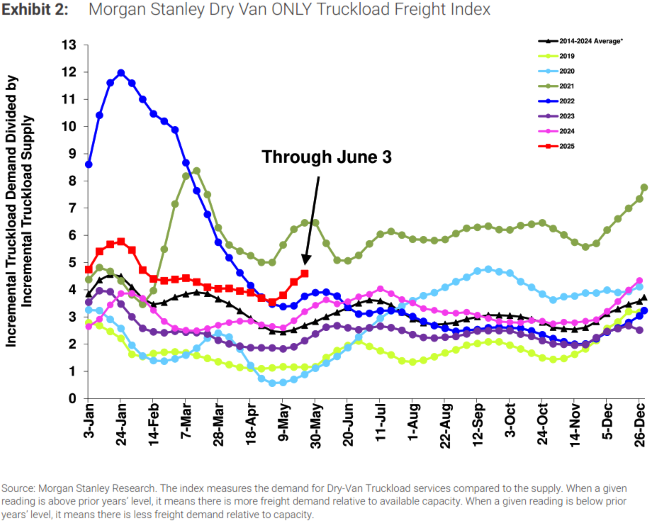
- The Morgan Stanley Truckload Freight Index (MSTLFI) registered strong sequential increases in May and outperformed typical seasonality, driven by demand in the first half of the month followed by a strong outperformance in supply in the second half of the month.
Summary
Outbound tender rejections regained upward momentum in May, supported by multiple capacity disruptions, most notably the CVSA International Roadcheck and the Memorial Day holiday. Following a sustained decline throughout April, which drove the OTRI below 5% for the first time since early October 2024, rejection rates steadily increased throughout May, ultimately peaking at 6.76% in the days immediately following Memorial Day.
On a WoW basis, the rise in rejection rates was gradual early in the month, increasing by 18 bps over the first 12 days relative to the end of April. The onset of Blitz Week, which ran May 13-15, resulted in a 50 bps increase in OTRI values during the three-day event. However, the most significant shift occurred the day after the International Roadcheck concluded, with rejection rates surging by 68 bps, leading to a 1.18% WoW gain and pushing the index back above the 6% threshold for the first time since mid-April. Rejection rates continued to climb during the week preceding Memorial Day, rising an additional 21 bps WoW and reaching their monthly high. However, the typical post-holiday slowdown in freight volumes contributed to a 41 bps WoW decline in the final week of the month, with the OTRI settling just below 6.3% at month-end.
Simultaneously, the Morgan Stanley Truckload Freight Index rebounded strongly in May following consecutive declines in April, reaching its highest level above the long-term average in 2025 to date. According to the latest Morgan Stanley report, the index exhibited a sharp positive inflection ahead of typical seasonal trends. The performance in the first half of the month was largely demand-driven, with demand rising by approximately 1,490 bps compared to a historical seasonal decline of around 50 bps. This contributed to a total monthly increase of roughly 2,290 bps—more than double the typical seasonal gain of 980 bps. In the second half of the month, the supply component became the primary contributor to outperformance, declining sequentially by approximately 850 bps, compared to the average seasonal decrease of ~500 bps.
The report also highlighted a notable shift in market sentiment between the first and second halves of May, marking a clear reversal from the prevailing trends observed in April across the index’s three primary components: Truckload Demand, Truckload Supply and Truckload Rates. During the first half of the month, sentiment was broadly negative, with both current and forward-looking indicators registering in the “red” for all three categories. This pessimism was driven largely by perceptions of weakening freight volumes and persistent overcapacity, which continued to exert downward pressure on rates. However, sentiment notably improved in the latter half of the month, with survey responses turning broadly positive. Both current and forward-looking sentiment shifted to “green” across all components, with the exception of current truckload demand, which moved into a more neutral range. Late month survey responses noted an increase in regional pockets of tighter capacity conditions but that the market is still in need of a demand catalyst.
Why It Matters:
May marked the 17th consecutive month in which tender rejection rates remained elevated relative to the prior year, and the fifth straight month in which year-over-year comparisons trended upward—despite a broader backdrop of weaker annual freight volumes. This suggests that the truckload market remains tighter than it was during the same period last year. The prolonged exit of capacity from the market over the past two and a half years has left the industry more exposed to external shocks, allowing seasonal fluctuations to become more visible in tender rejection data.
That said, recent increases in the national tender rejection index appear to have been driven more by volatility across equipment types and regional capacity imbalances than by a generalized tightening of capacity. As a result, interpreting May’s gains in rejection rates is more complex. While recurring annual events such as the CVSA International Roadcheck and major holidays typically reduce available capacity, the divergence in rejection rates across equipment types and regional markets may be distorting the aggregate figures.
From an equipment-type perspective, flatbed tender rejections surged from March to early April, while dry van and refrigerated rejections remained flat or declined. This created artificial inflation in national rejection index values. Following the conclusion of the seasonal pull-forward in industrial commodities and large-format summer goods, flatbed rejection rates declined significantly from their year-to-date highs recorded in late March. After opening May approximately 6.6% higher on a WoW basis, flatbed rejections steadily fell throughout the month, ultimately ending 12.8% below where they began. In contrast, dry van and refrigerated rejection rates increased modestly by 2.1% and 1.8% MoM, respectively.
Geographically, rejection rate dynamics also varied sharply. The Los Angeles market, for instance, saw an influx of carrier capacity, with rejection rates climbing from 1.64% at the start of May to 4.37% by month-end. Conversely, the Atlanta market experienced more pronounced volatility—rejection rates began the month at 8.14%, rose to just over 12% ahead of Memorial Day and declined to below 9% by the end of the month.
In its latest monthly market update, FTR reported that its Active Utilization Index stood at 93.7% in April, a 0.1 percentage point increase from the slightly revised March figure of 93.6%. On a YoY basis, April’s utilization was 1.3% higher than in April 2024 and continues to exceed the 10-year average. However, FTR’s outlook has grown more pessimistic, with the updated forecast showing a notable decline in expected utilization beginning early next year. The revision, nearly a full percentage point lower than the previous forecasts, is attributed to a significantly weaker outlook for truck loadings. Current projections suggest that a recovery in active utilization is unlikely before 2027.