Back to June 2025 Industry Update
June 2025 Industry Update: Truckload Demand
Despite registering slightly higher compared to April, the fallout from tariff uncertainty continued to hinder sustainable freight demand growth in May.
Key Points
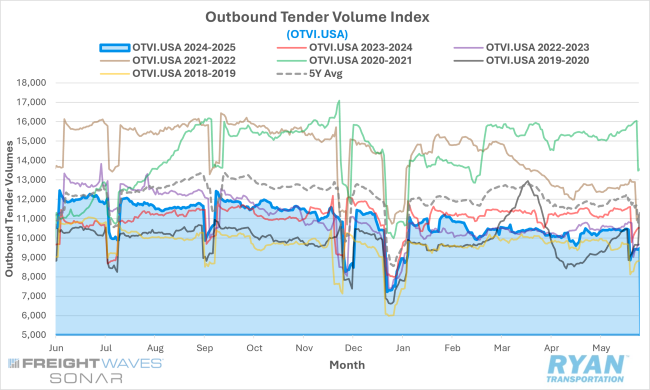
- Mid-month comparisons of the FreightWaves SONAR Outbound Tender Volume Index (OTVI.USA), a measure of contracted tender volumes across all modes, registered a 1.8% increase MoM in May compared to April, rising from 10,258.27 to 10,444.93.
- The monthly average of daily tender volumes in May rose slightly by 0.5% MoM compared to April, increasing from 10,104.24 to 10,154.10.
- Compared to May 2024, average daily tender volumes were down 9% YoY and were 14.2% below the 5-year average.
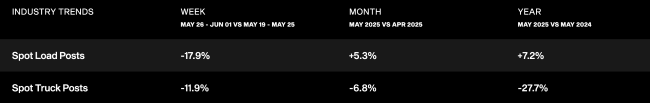
- Spot market shipping activity registered its third consecutive month of gains, rising 5.3% MoM compared to April and was up 7.2% YoY compared to May 2024.
- The Cass Transportation Index Report, which analyzes the number of freight shipments across North America and the total dollar value spent on those shipments, registered higher for both shipments and expenditures on a monthly basis by 0.4% and 3.3%, respectively, while annual comparisons were mixed as shipments registered 3.6% lower YoY and expenditures were up 1.2% YoY in April.
Summary
Outbound tender volumes registered a modest but unremarkable increase in May, rebounding from an unseasonably soft April and returning to levels more consistent with historical seasonal patterns. Despite the MoM improvement, volumes continued to underperform relative to prior-year benchmarks, trending approximately 7–10% below 2024 levels since mid-February. Contract tenders tracked by the FreightWaves SONAR OTVI had largely mirrored 2023 levels until April, when a divergence emerged and volumes began to trend lower. Notably, in the days leading up to the Memorial Day holiday, tender volumes were down 2.7% on a two-year stacked basis.
At a modal level, dry van activity represented the strongest performer on a MoM basis, while flatbed volumes remained the standout in terms of YoY growth. The 0.5% MoM increase in average daily tender volumes in May was driven by a 0.2% MoM rise in dry van tenders, whereas both flatbed and refrigerated volumes declined by 3.9% and 2.0% MoM, respectively. On a YoY basis, overall volumes declined 9.0%, led by an 11.5% YoY drop in dry van tenders and an 8.5% YoY decline in refrigerated volumes. Flatbed volumes, while still elevated, decelerated from April's pace—rising 10.8% YoY in May compared to a 14.5% YoY gain the previous month.
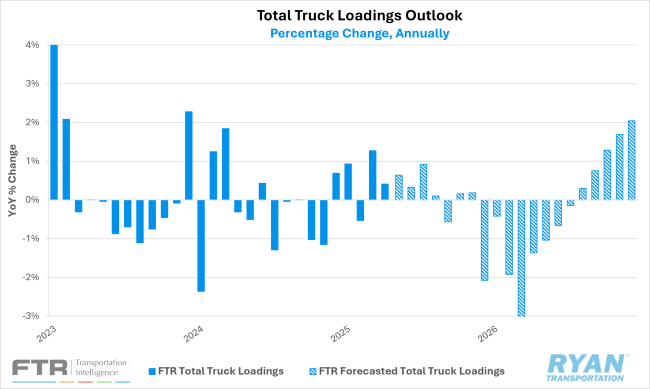
According to the latest Cass Transportation Shipment Report, shipments increased 0.4% MoM in April following a flat reading in March. However, on an annual basis, shipments declined 3.6% YoY, marking the 27th consecutive month of YoY contraction. The decline, however, narrowed from the 5.3% YoY decrease reported in March. The report highlights that after recording shipment growth of 13.0% YoY in 2021 and 0.6% YoY in 2022, the index has since posted declines of 5.5% YoY in 2023 and 4.1% YoY in 2024. Based on the current trajectory, the index is on pace for a third straight year of contraction in 2025. Should seasonal trends hold, the Cass report projects a 1.0% YoY decline in shipments for May.
Why it Matters:
While the slight uptick in truckload demand in May was better than the alternative, it was still a disappointing outcome given the current situation within the transportation industry. Several factors have contributed to the ongoing stagnancy in freight volumes so far this year, with much of it being tied back to the trade war and the ever-evolving policies surrounding it.
For starters, the limited amount from the recent pull-forward in imports that translated into over-the-road (OTR) volumes is notable. While imports only account for a small portion of overall truckload tonnage, it suggests that companies are either continuing to hold inventories or utilizing alternative transport methods. According to the May 2025 Logistics Managers’ Index Report, Inventory Costs continued to increase in May, reaching its highest reading since October 2022 and indicating that the inventories that were rushed into the country earlier in the year are now static and holding them is expensive. This rise in Inventory Costs coincides with the ongoing expansion in Warehouse Utilization as well as the Warehousing Capacity moving out of expansion territory into neutral territory in May.
Of the inventories that are being moved, rail carriers are seeing the majority of the share due to their current cost efficiency relative to OTR rates and as a means for alternative storage given the additional time it takes to move produce through the intermodal network. In its quarterly earnings call for Q1 2025, domestic intermodal provider Hub Group pegged the intermodal cost advantage around 30% below truckload, on average.
The reduction in tariffs being levied against China has already led to a flurry of ocean activity resulting in ocean container spot rates surging nearly 40% from China to the US. Some analysts have indicated that the surge in imports could be similar to what was observed during COVID that would test the flexibility of supply chains and result in higher volumes and pricing for truckload carriers. However, other analysts have pointed to the recent uptick of imports from frontloading in Q1, suggesting it will not be a sustainable demand catalyst through the rest of the year.