Back to June 2025 Industry Update
June 2025 Industry Update: Truckload Capacity Outlook
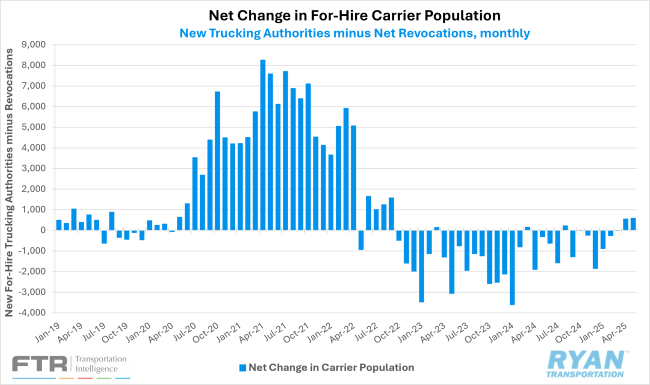
The carrier population expanded for the second consecutive month as new entrants continue to post strong gains despite weak truckload conditions.
Key Points
- Total net revocations, a measure of total authority rejections minus reinstatements, registered lower in May by roughly 500 carriers, dropping from just over 4,900 carriers in April to just over 4,400 carriers, according to FTR’s preliminary analysis of data collected by the Federal Motor Carrier Safety Administration (FMCSA).
- Per FTR, the FMCSA authorized just over 5,000 new carriers in May, down from the roughly 5,500 new for-hire authorizations in April.
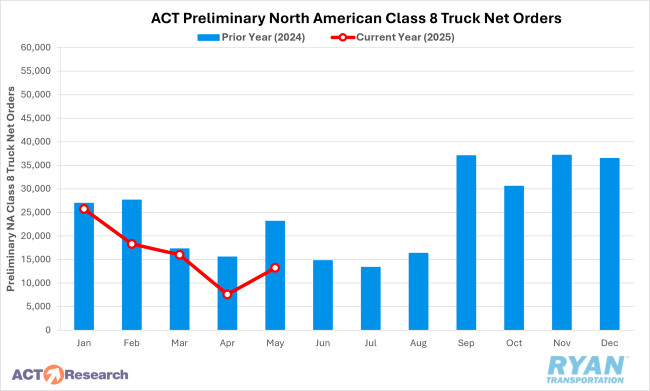
- Preliminary North American Class 8 net orders rebounded in May from the low figures in April with estimates ranging from 12,000 units according to FTR to 13,200 as reported by ACT Research.
Summary
Following the modest increase observed in April, the carrier population recorded another net gain in May, adding just under 600 carriers, slightly surpassing the prior month’s increase of 555. Such growth remains relatively rare in the current freight cycle, as net increases in the carrier population have occurred only five times in the past 32 months. Notably, April and May represent the first instance of consecutive monthly gains since August and September of 2022, indicating a potential, albeit tentative, shift in market dynamics.
The growth in May was largely driven by sustained momentum in new entrants, which recorded their second-highest monthly total since August 2023, trailing only April. The issuance of new operating authorities in May marked one of the strongest showings in recent history, with levels not seen consistently since September of last year. Over the past three months, the average number of new entrants has exceeded the 2023 monthly average by more than 500, underscoring renewed interest in market participation. Conversely, net carrier revocations continued to trend downward, declining for the third consecutive month to their second-lowest level since February 2022, just above the trough recorded in February of this year.
On the equipment front, preliminary North American Class 8 truck orders rebounded sharply from April’s historically low levels. FTR reported a 40% MoM increase, while ACT Research noted a more pronounced 59% MoM gain. Despite the sequential improvement, annual comparisons remained negative, with ACT and FTR reporting YoY declines of 44% and 47%, respectively. Moreover, order volumes remained significantly below the seven-year average for May, which stands at 18,319 units. According to FTR, May’s preliminary order count was the weakest for the month since 2020, bringing YTD net orders for 2025 to 32% below the same period in 2024.
Why It Matters:
Despite signs that the market is gradually moving toward equilibrium, a significant surplus of capacity persists, making the continued rise in new entrants and the overall growth in the carrier population increasingly concerning.
In a recent analysis of current capacity conditions and driver supply, FTR reported that as of the end of April, there remained approximately 90,000 more authorized for-hire trucking firms than in February 2020, equivalent to a 35% increase. According to the report, FMCSA registration data through May indicated nearly 237,000 carriers operating with one to five trucks, representing approximately 410,000 drivers, while 1,900 carriers with fleets of 100 or more trucks accounted for over 790,000 drivers. Compared to March 2020 levels, large carriers (100+ trucks) employ 2.4% fewer drivers, whereas small carriers (1–5 trucks) have expanded their driver base by 38.7%.
While the outsized growth in small carriers remains the primary disruptor of market stability, the expansion of private fleets operating under for-hire authority has further eroded the for-hire sector’s freight volume share. According to FTR, roughly 28,000 private fleets currently hold for-hire authority, making their presence far from negligible. The report also noted that, based on the 2024 Occupational Employment and Wages Statistics (OEWS) from the Bureau of Labor Statistics (BLS), employment of heavy truck drivers within private fleets surpassed that of the for-hire segment in 2021 and, by 2024, exceeded it by more than 65,000 drivers.
Although the number of for-hire operating authorities remains significantly elevated relative to pre-pandemic levels, employment figures reported by theBLS have continued to normalize. According to preliminary estimates in the most recent BLS employment report, the for-hire truck transportation sector shed 900 jobs in May on a seasonally adjusted basis. This followed upward revisions to March and April’s employment figures totaling 1,800 additional jobs. On a YoY basis, May payroll employment in truck transportation was up just 0.2% and 0.6% higher than levels recorded in February 2020.
The recent increases in both the carrier population and driver employment occurred during a period influenced by preemptive supply chain activity aimed at avoiding potential tariff-related disruptions—conditions that may prove to be temporary. Nevertheless, this activity resulted in additional hiring and market entries, suggesting that supply and demand may be more closely aligned than at other points during the ongoing freight recession. However, if tariffs are enacted and freight volumes decline as anticipated, the path to market rebalancing and pricing recovery could be further delayed. Even if Q1’s demand strength persists, elevated capacity levels will likely remain the dominant barrier to any sustained market recovery or meaningful inflection point.