Back to June 2025 Industry Update
June 2025 Industry Update: Intermodal
Rail activity registered moderate increases as carload volumes showed strength while intermodal traffic expanded at a much slower rate.
Spot Rates
Key Points
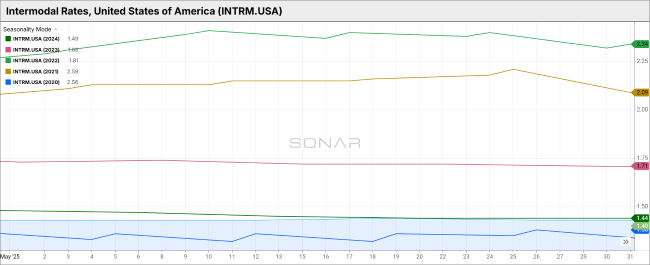
- The FreightWaves SONAR Intermodal Rates Index (INTRM.USA), which measures the average weekly all-in, door-to-door spot rate for 53’ dry vans across most origin-destination pairings, ended May flat MoM compared to April at $1.43.
- Compared to May 2024, intermodal spot rates were down 0.7% YoY and were 20.2% below the 5-year average.
Volumes
Key Points
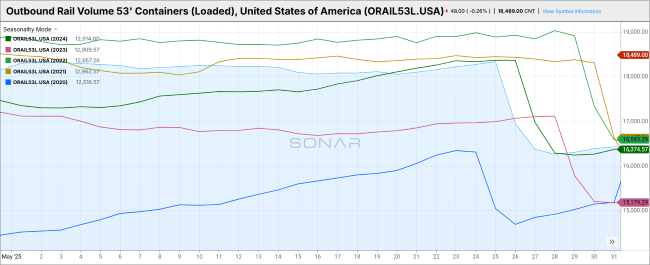
- Total loaded volumes for 53’ containers for all domestic markets, measured by the FreightWaves SONAR Loaded Outbound Rail Volume Index (ORAIL53L.USA), declined 2.5% MoM, dropping from 18,528.14 in April to 18,062.71 in May.
- Loaded domestic rail volumes for 53’ containers in May were up 1.9% YoY compared to May 2024 and were 3.4% higher than the 5-year average.
Intermodal Summary
Rail activity continued to show overall improvement in May, although mixed performance indicators underscored ongoing uncertainty within the broader economy, according to the latest monthly report from the Association of American Railroads (AAR). The report highlighted a shift in dynamics during the month, as carload traffic demonstrated solid growth while intermodal momentum appeared to decelerate.
Total carload originations increased 5.9% YoY compared to May 2024, averaging approximately 224,000 carloads per week. While this represented a meaningful gain, it was slightly below the 6.2% YoY increase recorded in April and fell marginally short of the weekly averages seen in March and April. Notably, 13 of the 20 major carload commodity categories posted YoY gains, with cumulative carload volume for the first five months of 2025 up 2.5% YoY.
In contrast, intermodal traffic—long a pillar of strength for rail carriers—registered a modest 0.6% YoY increase in May, marking the softest growth rate in the past 21 consecutive months of intermodal expansion. The slower growth resulted in a weekly average of 259,400 intermodal units, the lowest weekly volume in a year and roughly in line with the 10-year historical average for May. Despite this slowdown, total intermodal volume YTD remains up 6.7% over the same period in 2024, driven largely by robust activity during the first quarter.