Back to July 2025 Industry Update
July 2025 Industry Update: Truckload Supply
Rejection rates continued to trend above previous year’s levels despite weaker demand, indicating market conditions are getting tighter.
Key Points
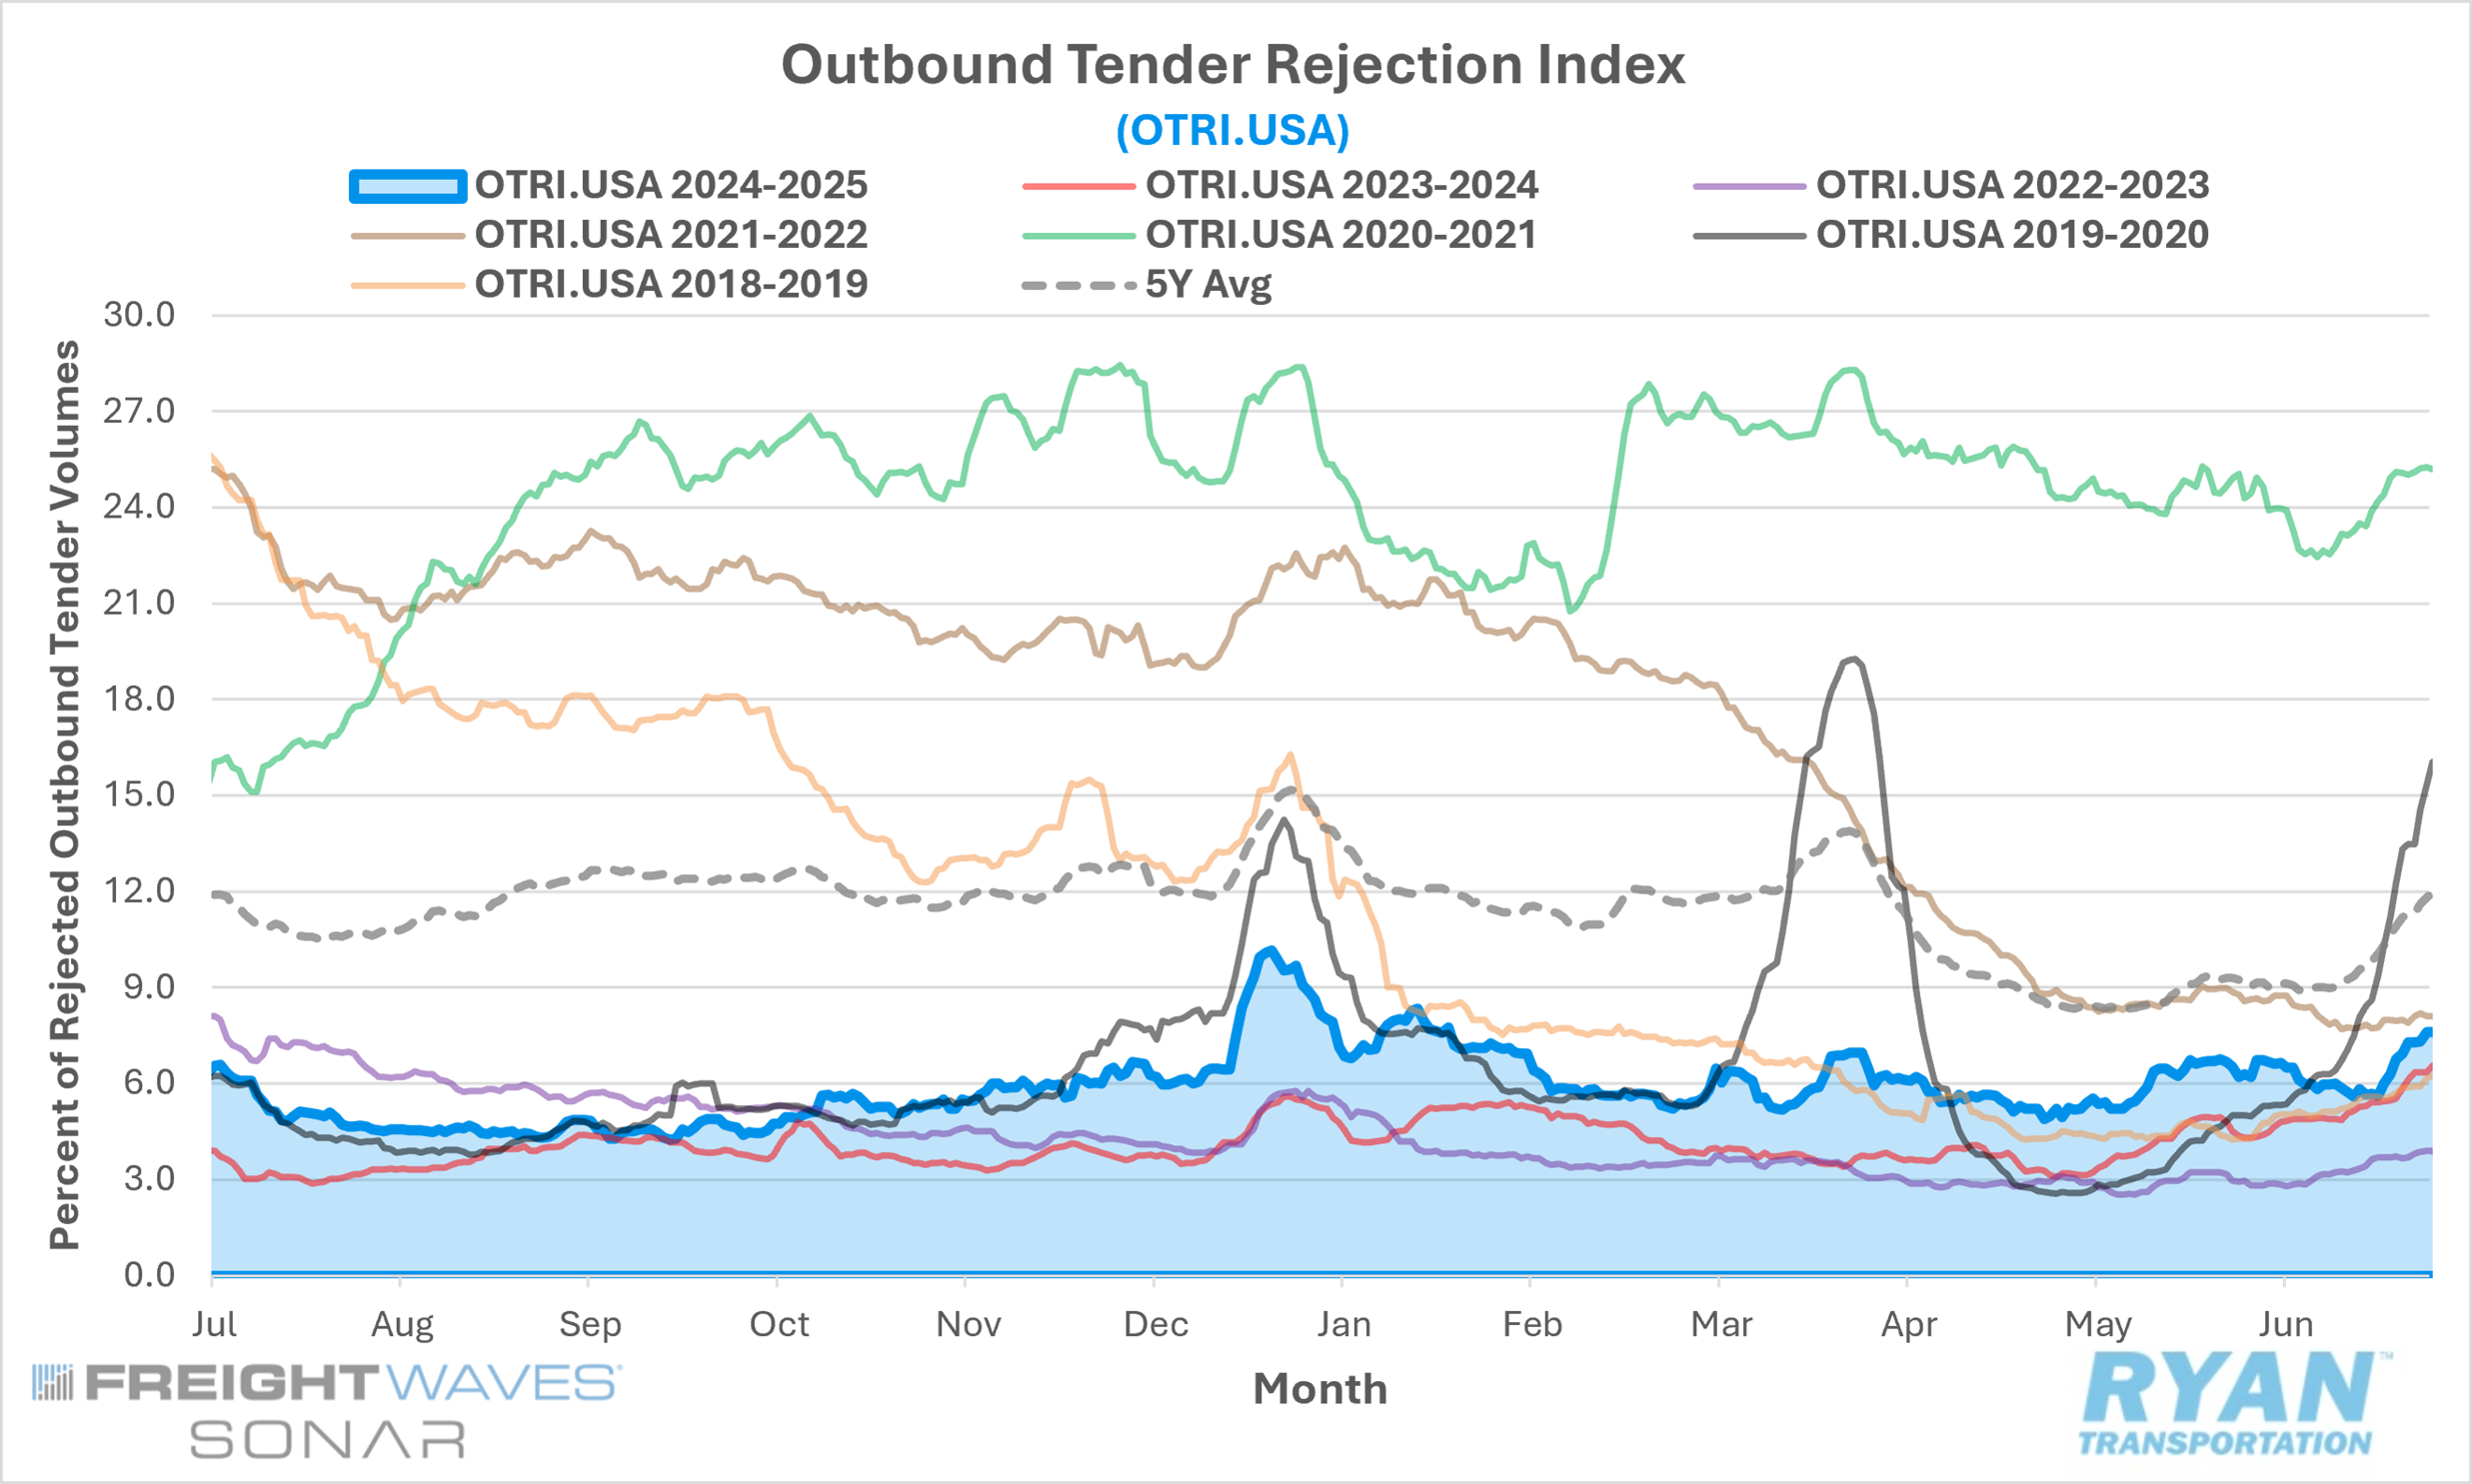
Monthly comparisons of outbound tender rejections recorded by the FreightWaves SONAR Outbound Tender Rejection Index (OTRI.USA), which measures relative capacity based on carriers’ willingness to accept freight volumes under contract, were mixed in June. Rejections were 40 basis points (bps) lower MoM midway through the month but roughly 130 bps higher MoM at the end of the month.
The monthly average of daily tender rejections was up nearly 40 bps MoM, rising from 5.6% in May to 6.3% in June.
On an annual basis, average daily tender rejections remained elevated by 1.2% YoY but were 3.4% below the 5-year average.
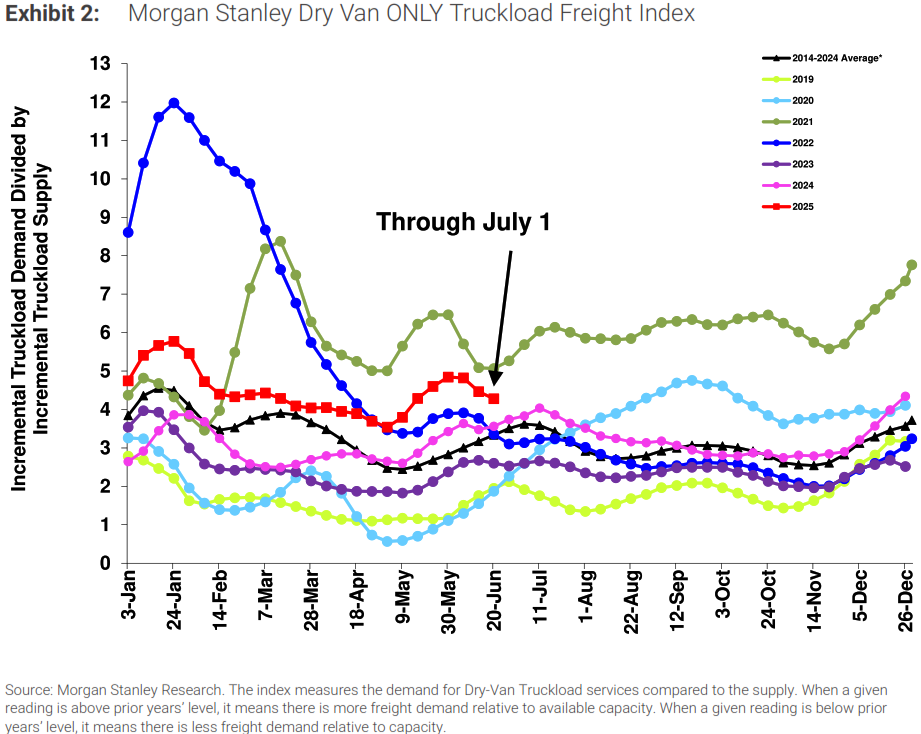
The Morgan Stanley Truckload Freight Index (MSTLFI) declined sequentially throughout June and underperformed typical seasonality, driven by strong underperformances in both supply and demand.
Summary
Relative to the volatility observed in May, which was driven by multiple capacity disruptions, tender rejections exhibited greater stability throughout June. Although rejection rates declined from their post-Memorial Day peak for much of the month, they remained elevated relative to the current weak demand environment.
Weekly trends captured by the FreightWaves SONAR OTRI reflected a generally steady but moderate decline through most of June. After reaching their highest level since March in the days immediately following Memorial Day, tender rejections declined during the first half of the month, falling 28 bps by mid-June compared to where they ended in May but holding around the 6.0% level. The decline extended into the third week, with rates falling an additional 34 bps, bringing the cumulative drop to 62 bps below month-end May levels. However, rejection rates reversed course in the final week of June, rising 15 bps WoW at the start of the week and climbing an additional 160 bps to reach a monthly peak of 7.6% on the final day of the month.
From a YoY perspective, tender rejections remained elevated for the 18th consecutive month, continuing to signal tighter market conditions relative to the same period in 2024. On a quarterly basis, however, the trend weakened in Q2. After posting four consecutive quarters of QoQ growth and averaging 6.4% in Q1 2025, average rejection rates declined by just over 40 bps QoQ in Q2, settling just below 6.0%. Still, this represented a 1.7 percentage point increase compared to Q2 2024, maintaining positive YoY momentum.
As for the MSTLFI, it recorded sequential declines in June and underperformed seasonal expectations following a strong performance in May. Both the supply and demand components contributed to the shortfall. Demand registered sequential declines throughout the month—the first such trend since early April—falling by ~550 bps, compared to a historical average increase of ~2,030 bps for the month. Conversely, the supply component rose by ~410 bps, diverging from the typical seasonal decline of ~1,000 bps and marking the first sequential increase since early March.
The report also noted a stark shift in market sentiment across the MSTLFI’s three primary components: Truckload Demand, Truckload Supply and Truckload Rates. After ending May with broadly positive current and forward-looking sentiment across all three areas, sentiment turned sharply negative in early June—except for current rate sentiment, which remained modestly positive. By the second half of the month, forward-looking sentiment rebounded, turning positive across all categories, while current sentiment declined across the board. Survey commentary echoed this transition, skewing more negative in the early weeks of June before shifting to a more neutral tone in the latter half of the month.
Why It Matters:
Despite steady WoW declines throughout much of June, tender rejections have continued to trend higher on a broader timeline, a trend that began in May 2023. This sustained upward movement remains a key indicator of tightening carrier availability, which is particularly relevant in the current market environment. In a soft freight market, carriers are typically more inclined to accept tenders; therefore, an increase in rejection rates under these conditions carries greater significance and signals potential supply-side constraints.
As has been the case in recent months, tender rejection trends have varied significantly by equipment type and across regions due to localized capacity imbalances. Flatbed rejections, which peaked at just over 40% in late March and lifted the monthly average to just under 27.5%, have since declined sharply. Since March, average flatbed rejections have fallen by more than 13.7%, with the majority of that decline occurring in June, during which flatbed rejection rates dropped approximately 9.8% MoM. In contrast, dry van and reefer rejections have shown steady increases over the past two months, with average reefer rejection rates rising by 181 bps MoM in June, signaling a tightening in capacity for temperature-controlled freight.
According to FTR’s latest monthly market update, its Active Truck Utilization Index remained unchanged in May at 93.6%, following a slight downward revision of April’s figure by 0.1 percentage points. On a YoY basis, active utilization in May was up 0.7% compared to May 2024 and remains above the 10-year historical average of 92.5%. FTR’s outlook remains consistent with prior forecasts, anticipating a modest decline in utilization in Q4 2025 before recovery begins in Q2 2026.
While the continued decline in available capacity is making the market more sensitive to external disruptions such as holidays and adverse weather events, the number of additional carrier exits needed to bring the market back into balance remains uncertain. Ongoing demand weakness continues to weigh heavily on market dynamics, and uncertainty surrounding trade policy only further complicates the outlook. The trajectory of tender rejections will be a critical metric to monitor in the months ahead, particularly as trade negotiations evolve and potentially provide more clarity on demand trends. With major holiday-related disruptions largely absent in Q3, external capacity shocks may be limited to weather-related events, including hurricane season.