Back to July 2025 Industry Update
July 2025 Industry Update: Truckload Demand
Freight volumes were slightly stronger compared to May but still remain well below typical peak summer shipping season levels.
Key Points
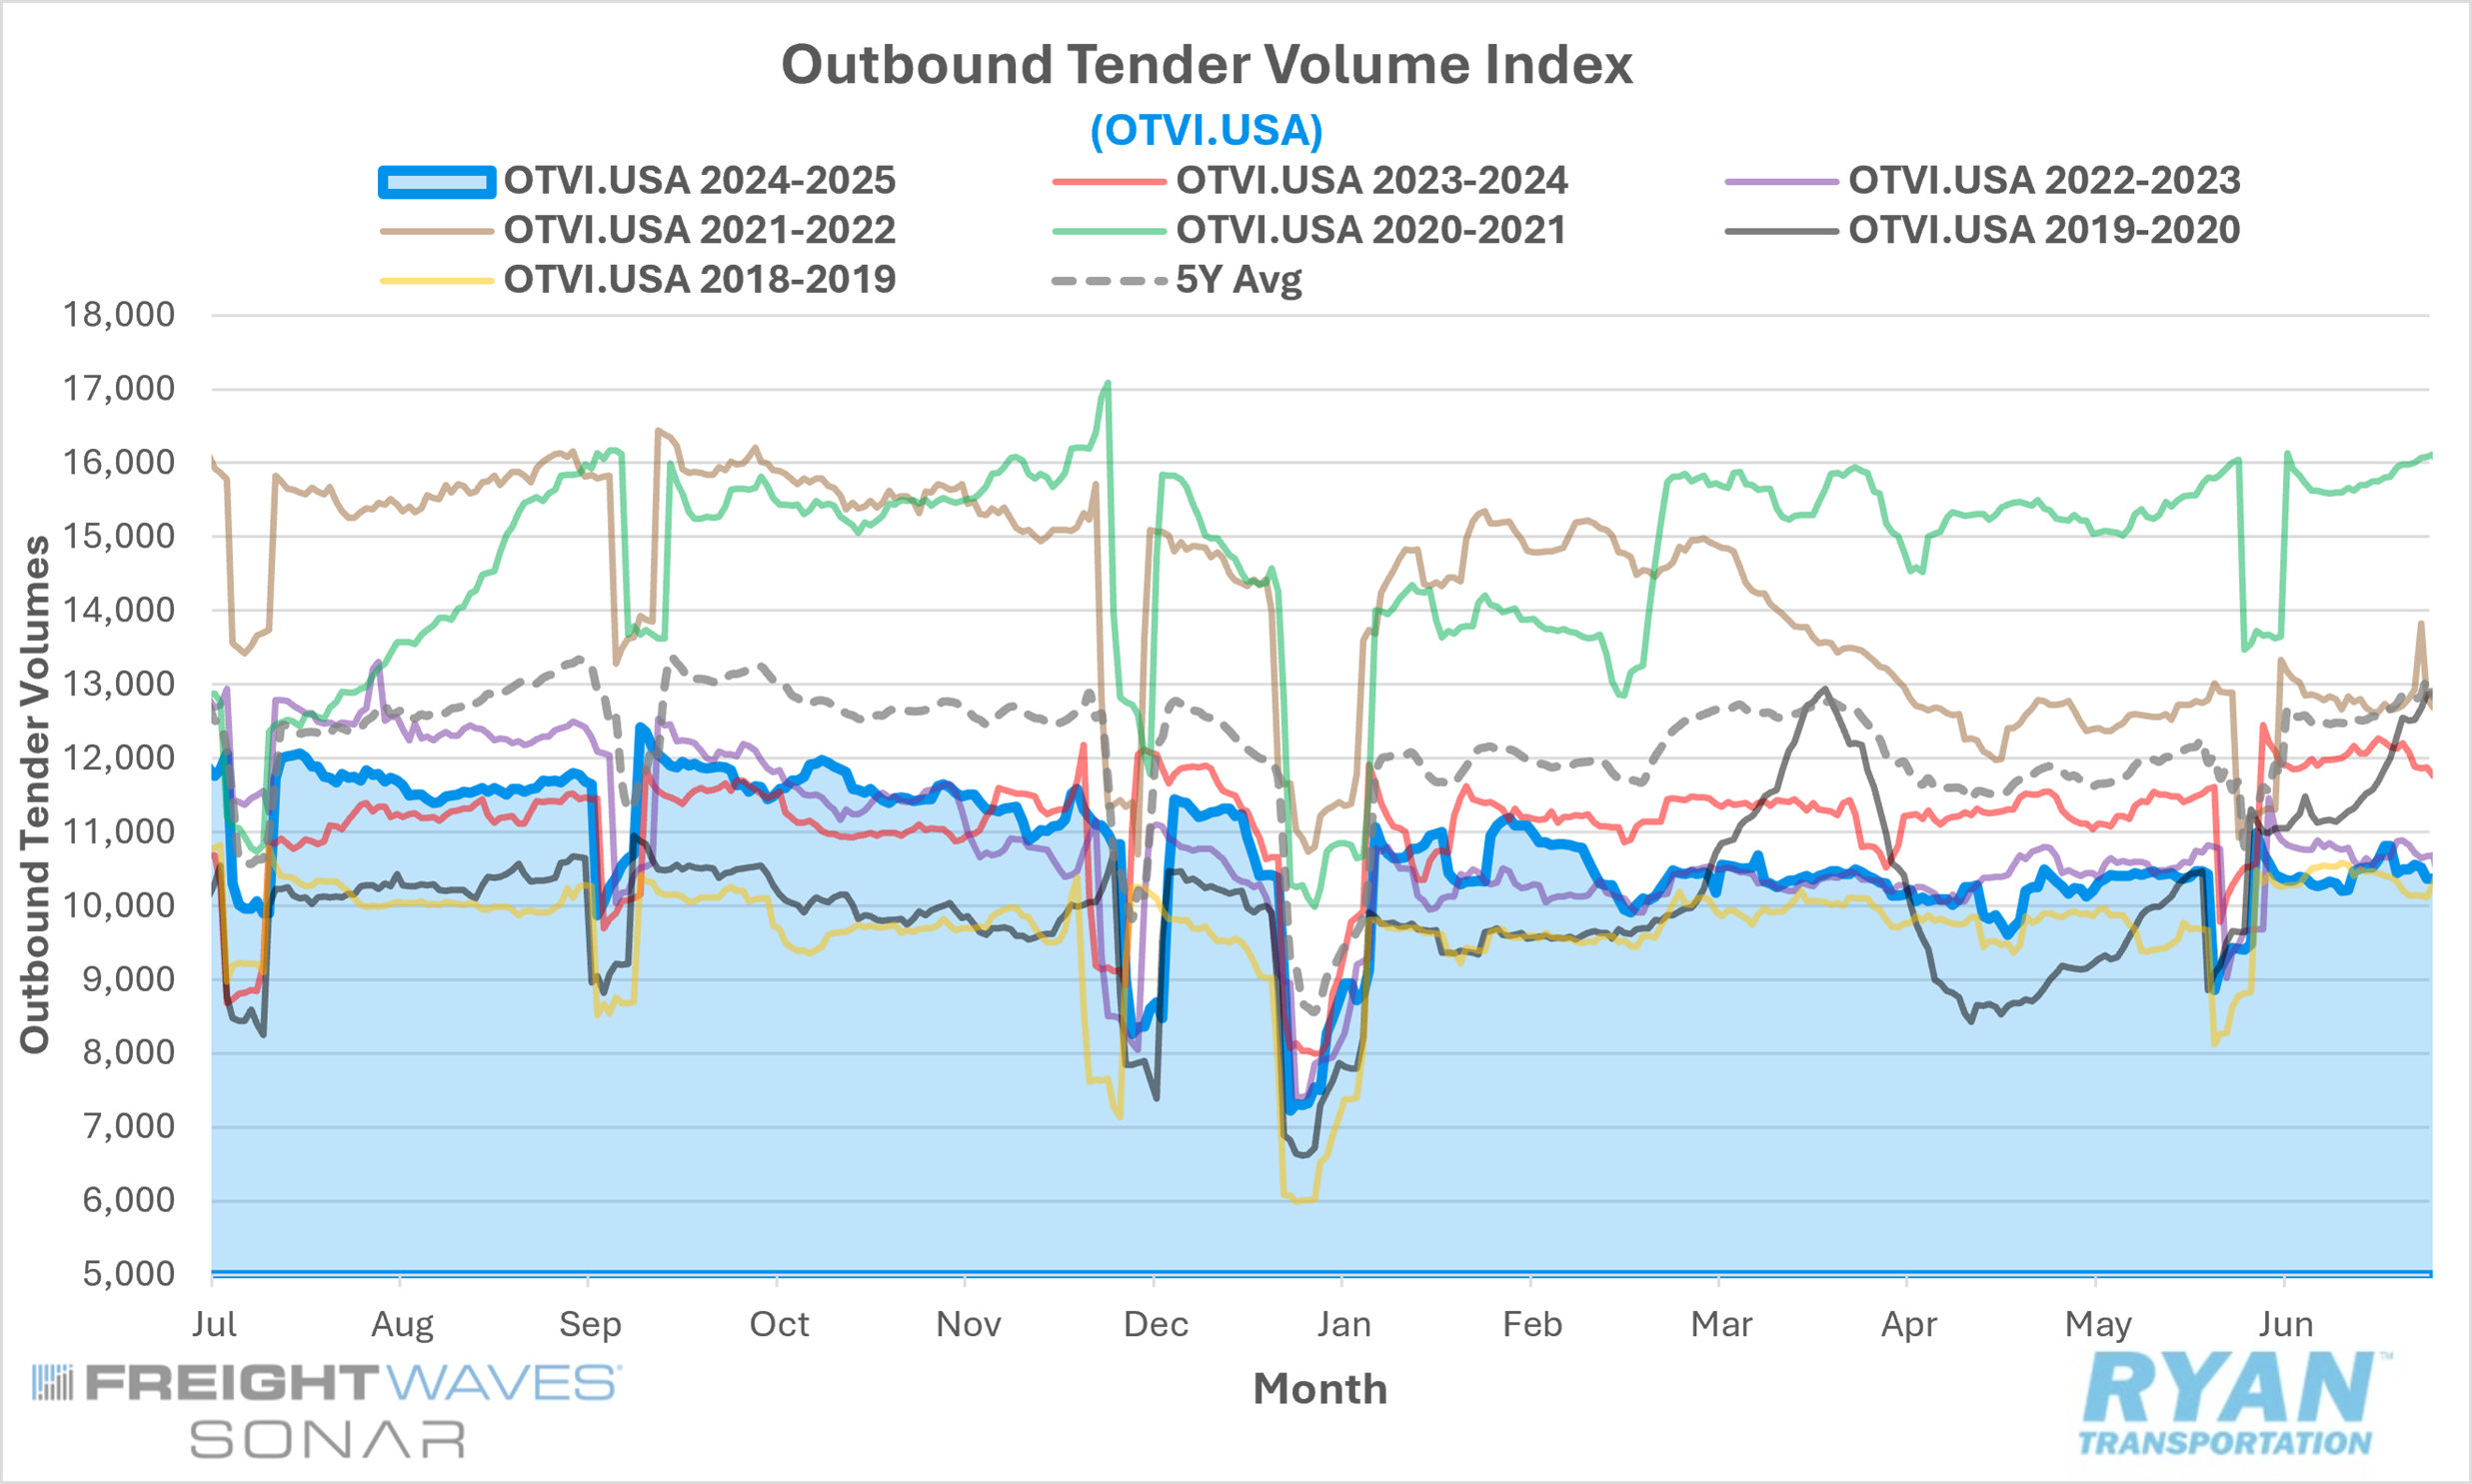
Mid-month comparisons of the FreightWaves SONAR Outbound Tender Volumes Index (OTVI.USA), a measure of contracted tender volumes across all modes, registered a 1.5% decline MoM in June compared to May, dropping from 10,471.23 in May to 10,309.89 in June.
The monthly average of daily tender volumes in June increased 2.8% MoM compared to April, increasing from 10, 154.10 to 10,437.13.
Compared to June 2024, average daily tender volumes were down 12.6% YoY and were 15.9% below the 5-year average.
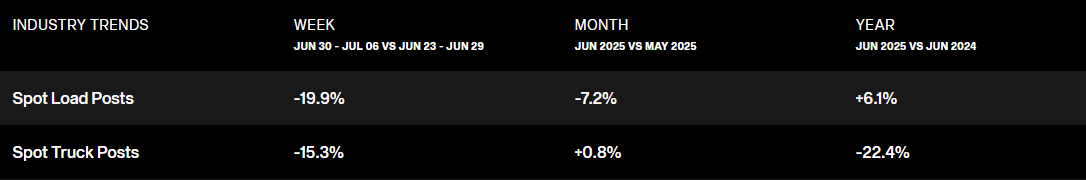
Spot market activity softened in June following three consecutive months of gains, dropping 7.2% MoM but remaining elevated on an annual basis by 6.1%.
The Cass Transportation Index Report, a measure of U.S. freight activity that tracks shipment volumes and expenditures across all domestic transportation modes, reflected monthly and annual declines in shipments in May of 0.4% MoM and 4.0% YoY while expenditures were up 1.4% MoM and 0.8% YoY.
Summary
Following a modest increase in May, freight volumes remained stable throughout June, registering a second consecutive month of moderate growth but continuing to underperform typical seasonal expectations. The 2.8% MoM increase in average daily tenders fell well short of the historical seasonal average of 6.3% for June. When adjusting for the distortion caused by the post-Memorial Day lull in shipping activity, the underperformance becomes more pronounced: average daily tender volumes rose by less than 1%, while the adjusted seasonal average increase climbs to 6.6%.
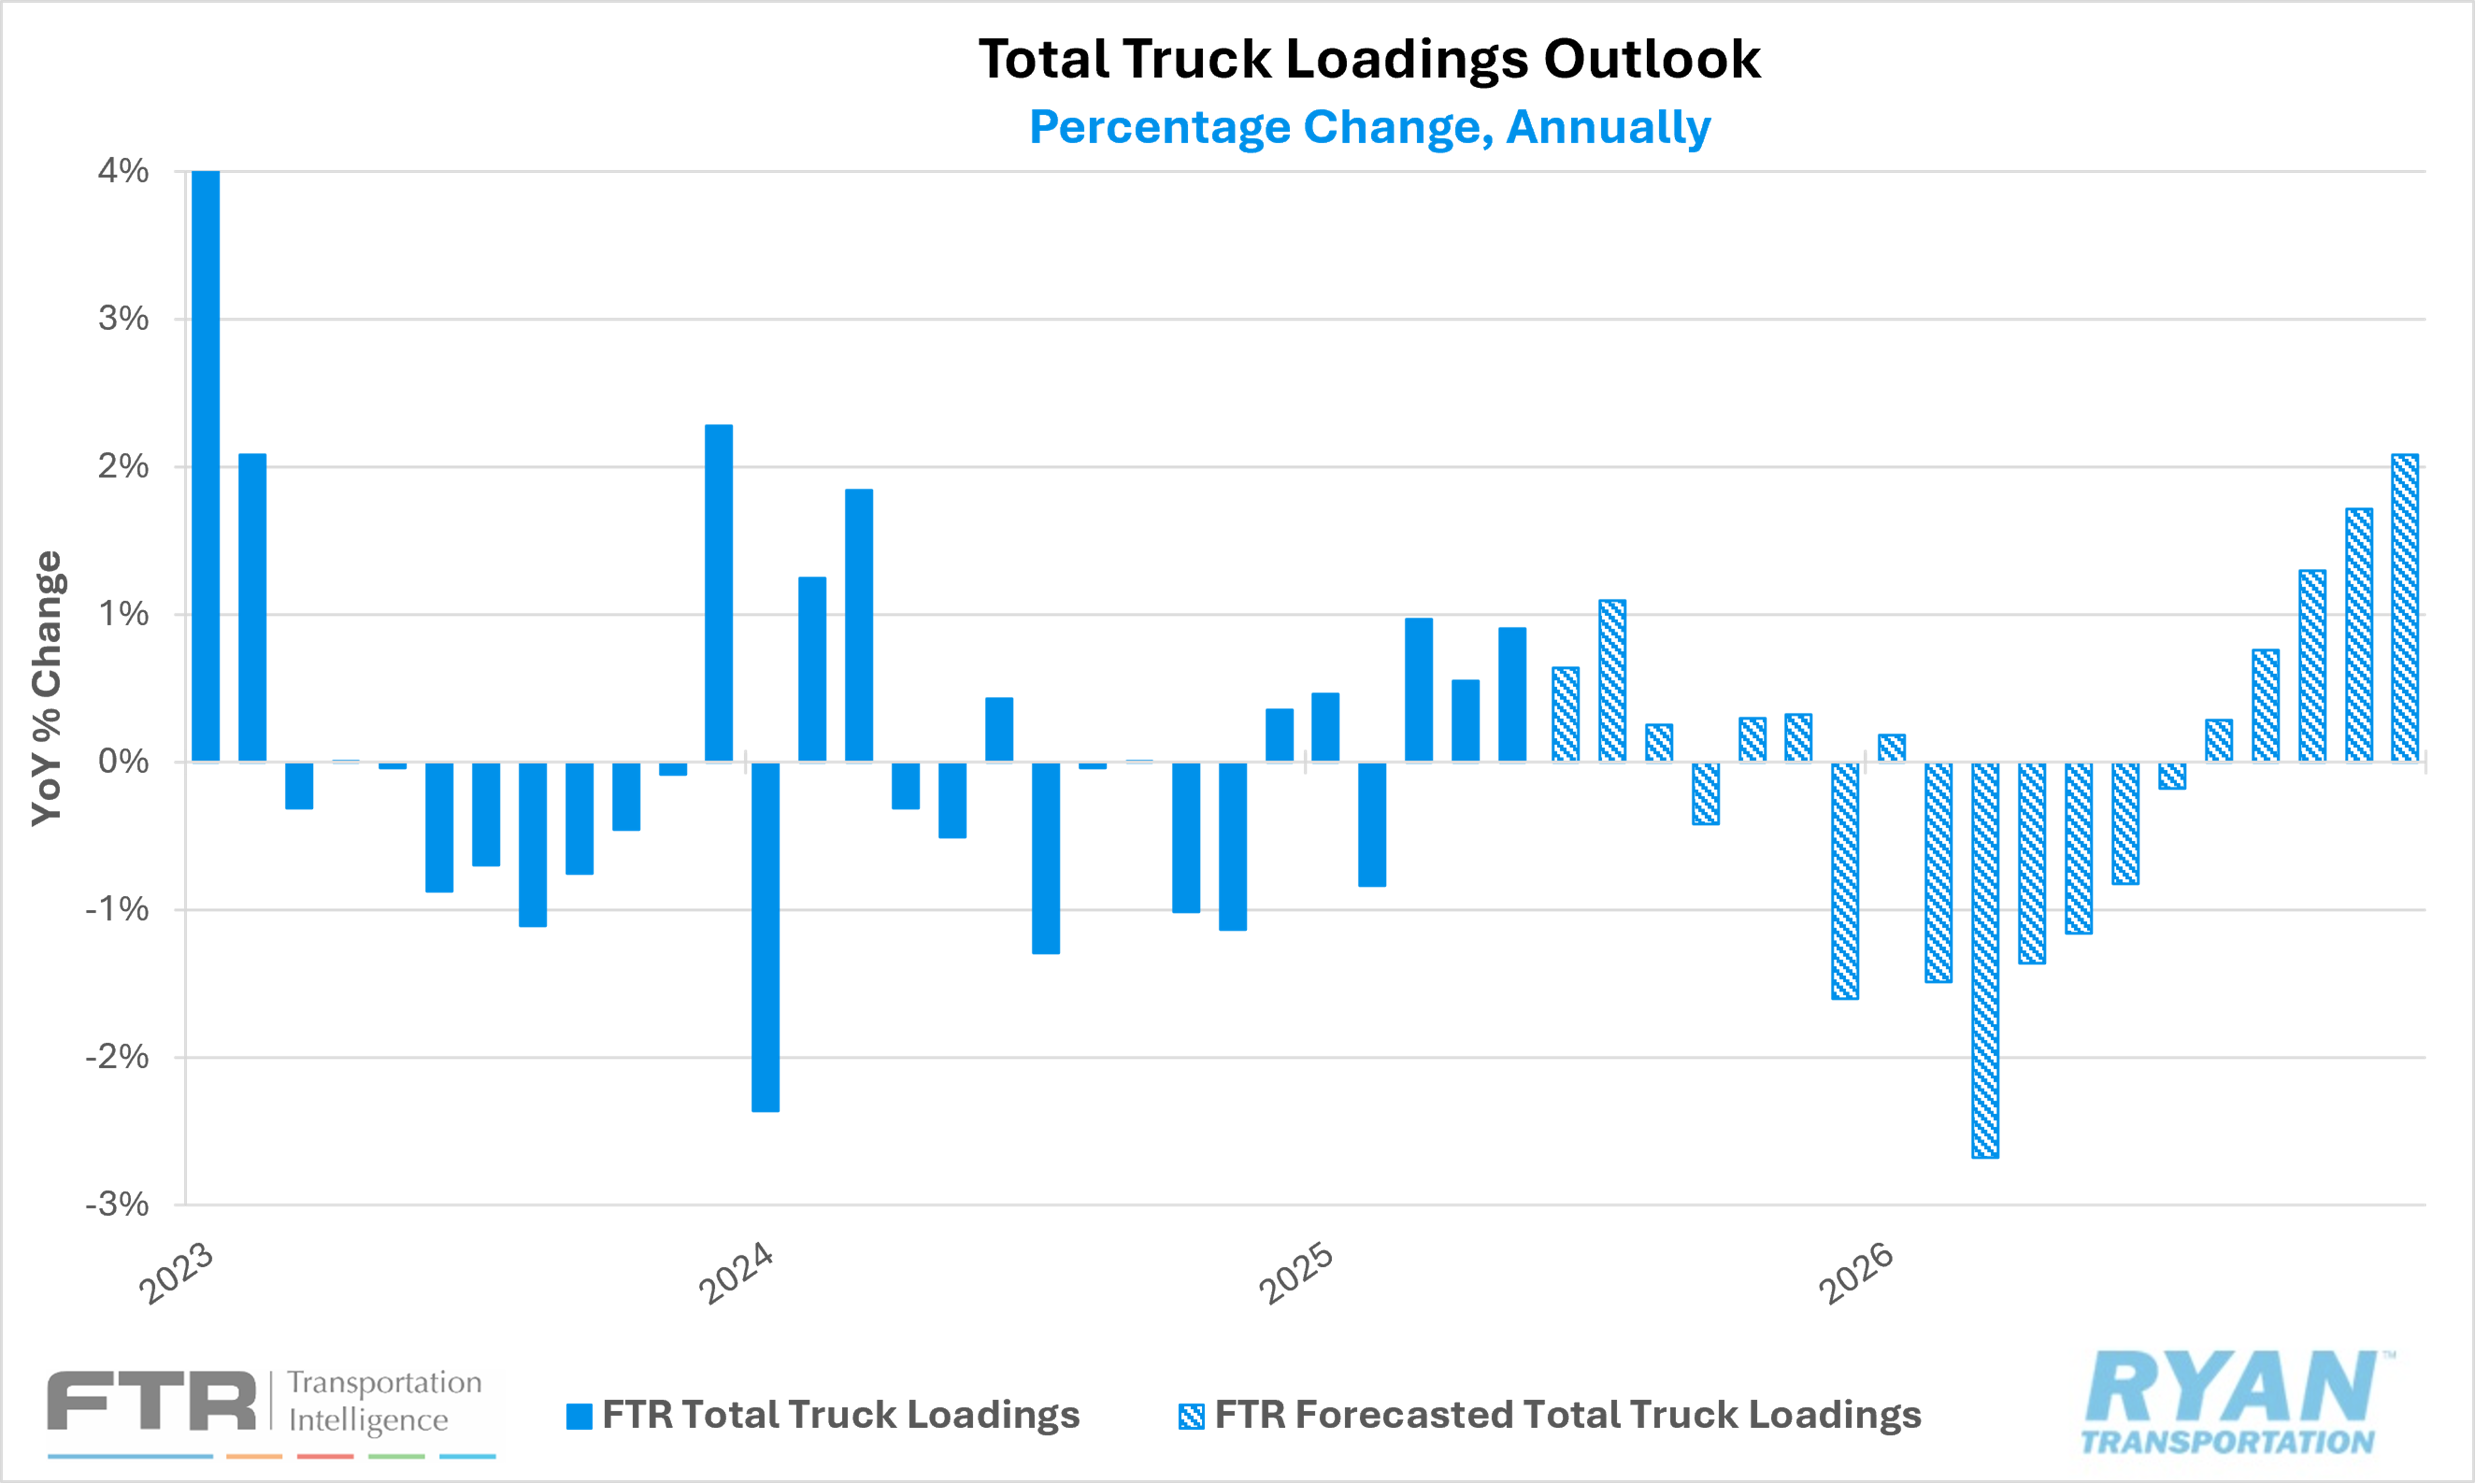
On a YoY basis, freight demand has trended 7–10% below 2024 levels since mid-February, with that gap widening steadily in recent months. In June, tender volumes declined 12.6% YoY, marking the largest annual deficit since July 2023. The softness in demand is evident not only in annual comparisons but also in quarterly performance. In the second quarter of 2025, average tender volumes declined 1.7% q/q versus Q1 2025 and were 10.6% lower than the Q2 2024 average. At 10,231.82, the Q2 2025 figure represents the lowest quarterly average since Q1 2023.
The latest Cass Transportation Index Report further reflects this weakening trend. While shipments were down only 0.4% MoM in May, seasonally adjusted data revealed a more noticeable decline of 3.4% MoM, given the historical expectation for volume increases during the month. On an annual basis, shipments declined 4.0% YoY in May, following a 3.6% YoY decrease in April. The report notes that while pre-tariff consumer spending is still supporting overall freight demand, the full impact of tariffs has yet to be realized. At the current pace, the index is on track for a third consecutive annual decline in 2025, following YoY decreases in 2023 (-5.5%) and 2024 (-4.1%), which came after increases in 2021 (+13.0%) and 2022 (+0.6%).
Why it Matters:
Despite a modest MoM increase, the persistent weakness and ongoing underperformance in truckload demand during what is traditionally the peak summer shipping season remains a point of concern—not only for the transportation sector, but for the broader economy as well. Viewed in isolation, truckload volume trends signal that the industry remains in a severe recessionary state. However, this contraction has been somewhat offset in recent months by relative strength in tender rejections and spot market rates, suggesting that the deterioration in over-the-road (OTR) shipping volumes is not solely attributable to declining consumer confidence or weakness in interest rate-sensitive sectors. Instead, it reflects broader structural changes in freight procurement strategies, including shippers’ increasing reliance on private and dedicated fleets, as well as the intermodal sector’s ongoing recovery of market share previously ceded to truckload carriers.
While sustained softness in truckload volumes continues to represent a major headwind for a full industry recovery, certain indicators offer cautious optimism for the second half of 2025. One such signal comes from shipper behavior following the 90-day suspension of U.S.-China trade tariffs announced in May. The June 2025 Logistics Managers’ Index (LMI) Report registered a 1.3% MoM increase in the overall index to 60.7%, driven primarily by an 8.3% MoM acceleration in Inventory Levels. Notably, the underlying dynamics varied significantly across supply chain segments. Upstream firms (wholesalers and distributors) reported robust expansion in inventories, reaching 66.4% in June, while downstream firms (retailers) reported a sharp contraction at 44.2%. The report suggests that retailers are actively working to draw down excess inventories accumulated earlier in the year in order to make space for back-to-school and holiday merchandise, as evidenced by the combination of contracting inventory levels and rising inventory costs.
Although rail carriers are expected to capture the majority of volumes from renewed import activity, a potential convergence of inventory drawdowns, restocking cycles and frontloaded imports could introduce volatility into transportation markets. This may create incremental opportunities for OTR carriers to benefit from increased demand. As noted in the Cass Transportation Index Report, the full impact of tariffs has yet to be felt by consumers, who have remained resilient thus far. While many analysts anticipate that continued tariff escalation could prolong the freight recession by eroding consumer purchasing power, any further delay in tariff implementation could postpone those negative effects, potentially supporting freight volumes and consumer spending during the remainder of the traditional peak shipping season.