Back to February 2026 Industry Update
February 2026 Industry Update: Truckload Supply
Main Takeaways
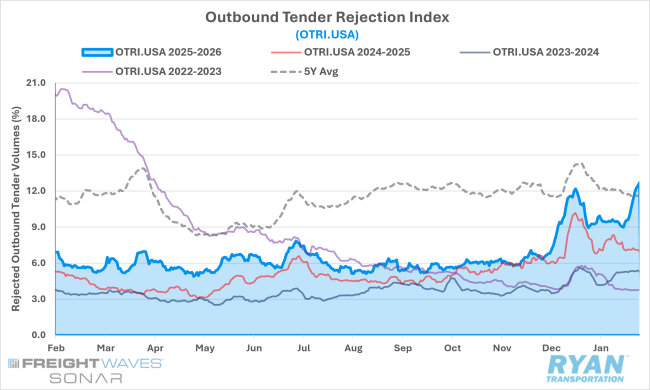
- Tender rejections surged past their holiday peaks at the end of January after starting to stabilize midway through the month and reaching their highest level since April 2022.
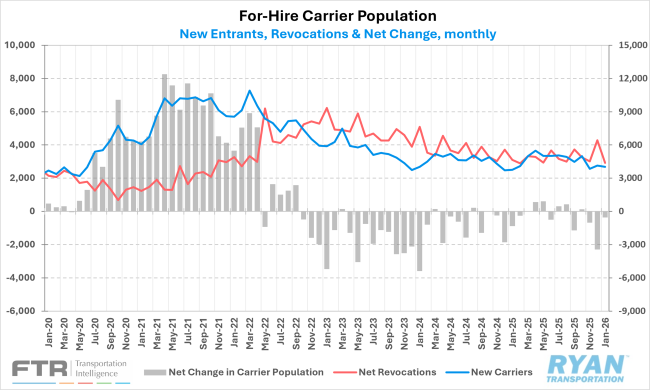
- Following the sharp contraction in December, declines in the for-hire population continued in January but at a much more moderate rate as excess capacity continues to move closer to balance.
Summary
Similar to the rate trajectory observed in January, the impact of Winter Storm Fern late in the month temporarily halted the post-holiday normalization in tender rejection rates, keeping them elevated throughout January. The heightened volatility in market conditions remains primarily supply-driven, as continued capacity attrition further tightens the market and shifts the imbalance from isolated regional pressures to broader national implications — particularly as longer average haul lengths support upstream replenishment activity.
Meanwhile, equipment orders have continued to trend higher year-over-year. However, much of the recent strength likely reflects deferred replacement cycles rather than meaningful capacity expansion. That said, the sustained improvement in order activity could also represent an early signal of improving sentiment for 2026, contingent on firmer economic conditions and the realization of potential demand-side tailwinds.
SONAR Outbound Tender Rejection Index
Key Points
- Tender rejections remained elevated throughout January after pulling back from pre-Christmas peaks, holding above 9% for much of the month before spiking sharply in response to Winter Storm Fern and peaking just below 12.5%. On an annual basis, rejection rates were 241 basis points higher than January 2025 levels and remained 4.9% above the two-year average, underscoring continued tightening despite softer underlying demand.
Morgan Stanley Truckload Freight Index
Key Points
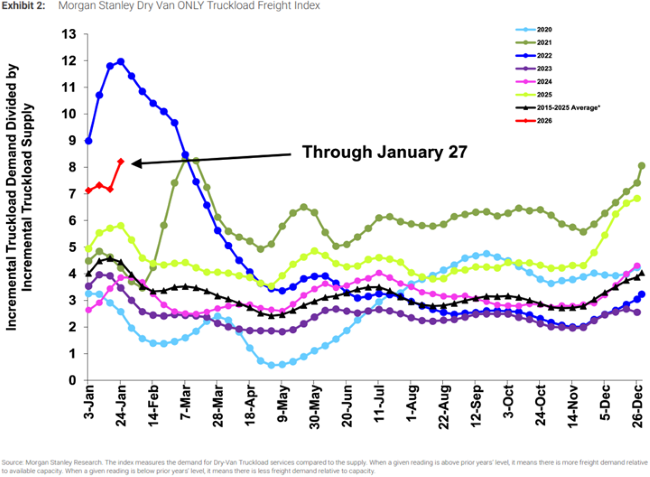
- After a prolonged period of outperformance, the Morgan Stanley Truckload Freight Index (MSTLFI) underperformed in early January, driven by weakness in the demand component. However, the index rebounded sharply later in the month. It ultimately outperformed typical seasonality, supported by strong supply-side outperformance. In contrast, both the reefer and flatbed indices mirrored this pattern with early-month underperformance followed by strength in the second half of January.
New Authorities, Net Revocations & Net Change in For-Hire Carrier Population
Key Points
- The for-hire carrier population declined by 359 carriers in January, a markedly smaller contraction than the nearly 2,300-carrier decline recorded in December and modestly below the 680-carrier decrease observed in November. According to FTR’s preliminary analysis of FMCSA data, the sharper month-to-month contrast was largely driven by a calendar effect, as the agency processes most revocations on Mondays — of which December had five compared to four in January. Despite the continued sequential declines, the number of active for-hire authorities remains materially elevated, standing roughly 85,000 carriers, or 33.2%, above pre-pandemic levels in February 2020.
Truck Transportation Payroll Employment
Key Points
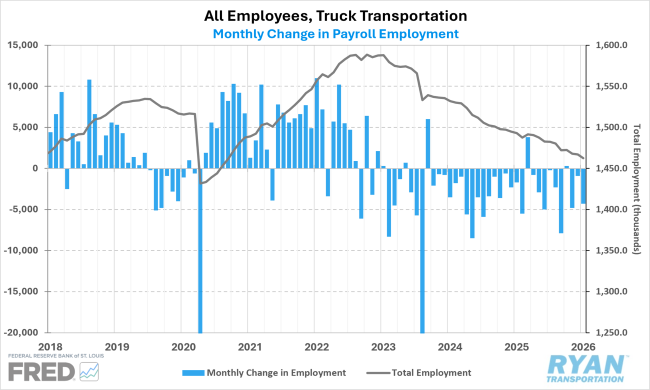
- Following its annual benchmark revision in its latest report, payroll employment in truck transportation declined by 4,300 jobs MoM in January. The annual revisions, which are based on the more complete employment counts from the Quarterly Census of Employment and Wages (QCEW), reflected a much bleaker picture for truck transportation employment than initially estimated. The industry shed roughly 28,000 jobs throughout 2025, compared to the previously reported decline of 3,500 jobs. Since peaking in January 2023, employment levels have fallen by 125,000 jobs through last month.
Preliminary North American Class 8 Tractor Net Orders
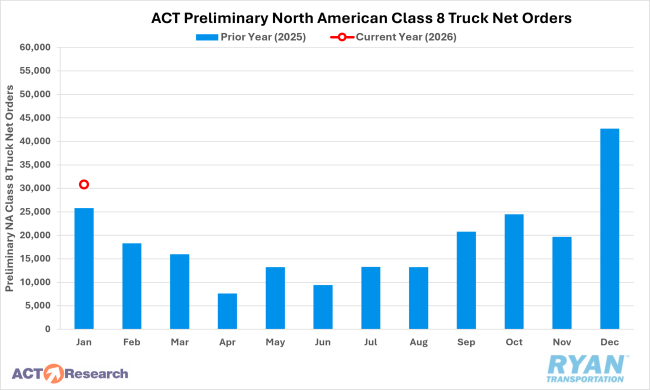
Key Points
- Class 8 truck orders declined sequentially in January following the sharp surge in December, but remained elevated on an annual basis, with preliminary estimates from ACT Research and FTR indicating orders were 19 – 27% higher YoY compared to January 2025. Despite the consecutive annual gains over the past two months, both firms noted the rebound primarily reflects fleets executing delayed replacement cycles rather than expanding capacity. ACT Research and FTR cautioned that a durable recovery in orders will require sustained YoY growth alongside a meaningful improvement in broader freight market conditions, which remain uncertain amid elevated costs and ongoing macroeconomic and geopolitical risks.
FTR Active Truck Utilization
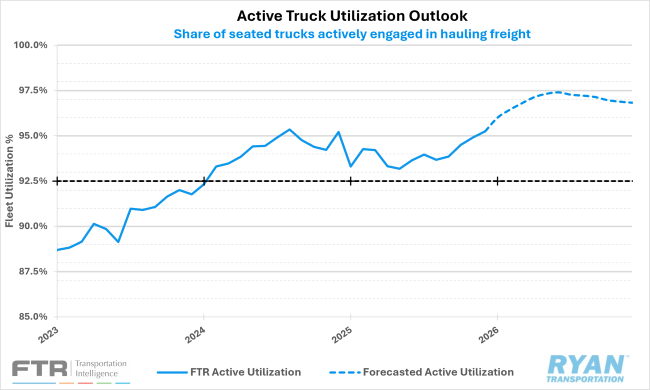
Key Points
- FTR revised its outlook for active truck utilization in its latest report, now forecasting utilization to exceed 97% by early Q2, driven largely by an improved outlook for freight volumes. According to FTR, active utilization last surpassed the 97% threshold in mid-2021, when the market was in the early stages of normalization.
Outlook
With February historically representing the snowiest month of the year — particularly in the early weeks — the risk of weather-related volatility remains elevated, although likely less severe than the widespread disruptions associated with Winter Storm Fern. As conditions stabilize later in the month and the industry transitions into the spring shipping period, market dynamics should gradually realign with typical seasonal patterns. However, absent a sustained rebound in freight demand, continued supply erosion is likely to incrementally tighten capacity and increase the market’s sensitivity to even modest short-term demand shocks throughout 2026.
Back to February 2026 Industry Update