Back to December 2025 Industry Update
December 2025 Industry Update: Truckload Supply
Truckload capacity continued to tighten as tender rejections remained elevated amidst weaker demand
Key Points
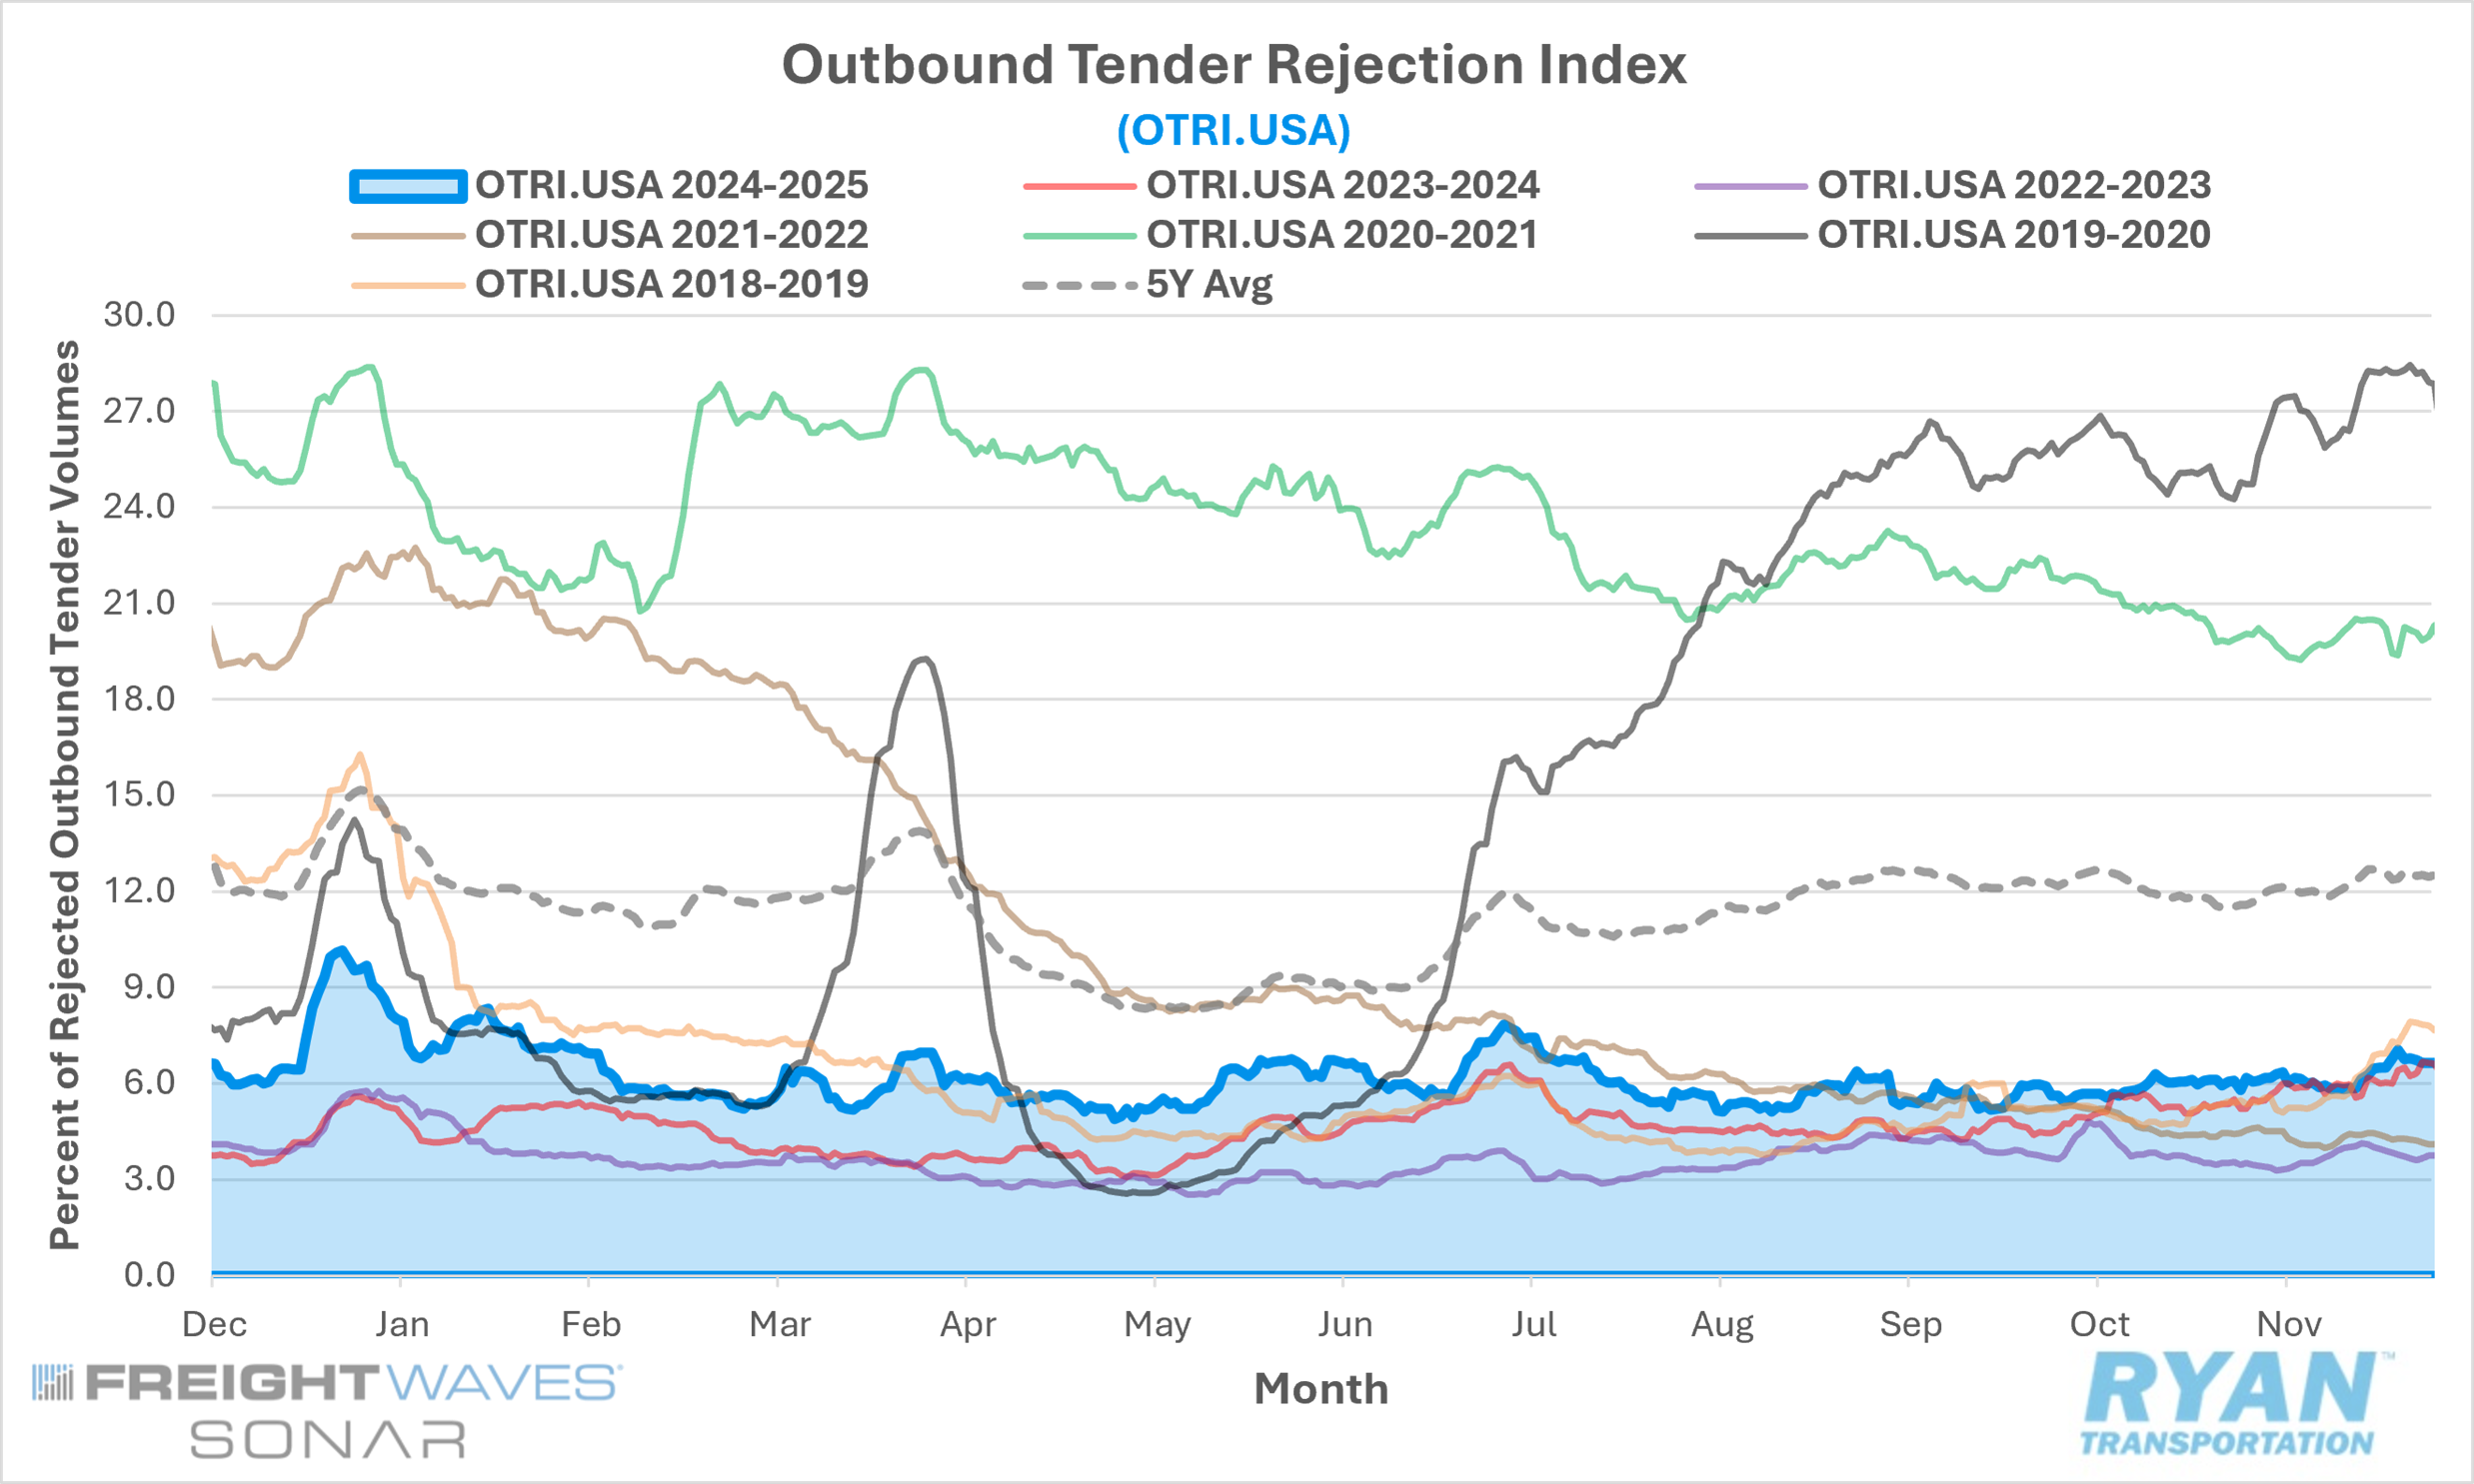
- Mid-month comparisons of the FreightWaves SONAR Outbound Tender Rejection Index (OTRI.USA), which measures relative capacity based on carriers’ willingness to accept freight volumes under contract, registered a 19 bps decline MoM in November, falling from 6.03% in October to 5.84%.
- The monthly average of daily tender rejections increased 38 bps MoM in November, rising from 5.88% in October to 6.26%.
- On an annual basis, average daily tender rejections remained 29 bps higher YoY but remained 5.96% below the 5-year average.
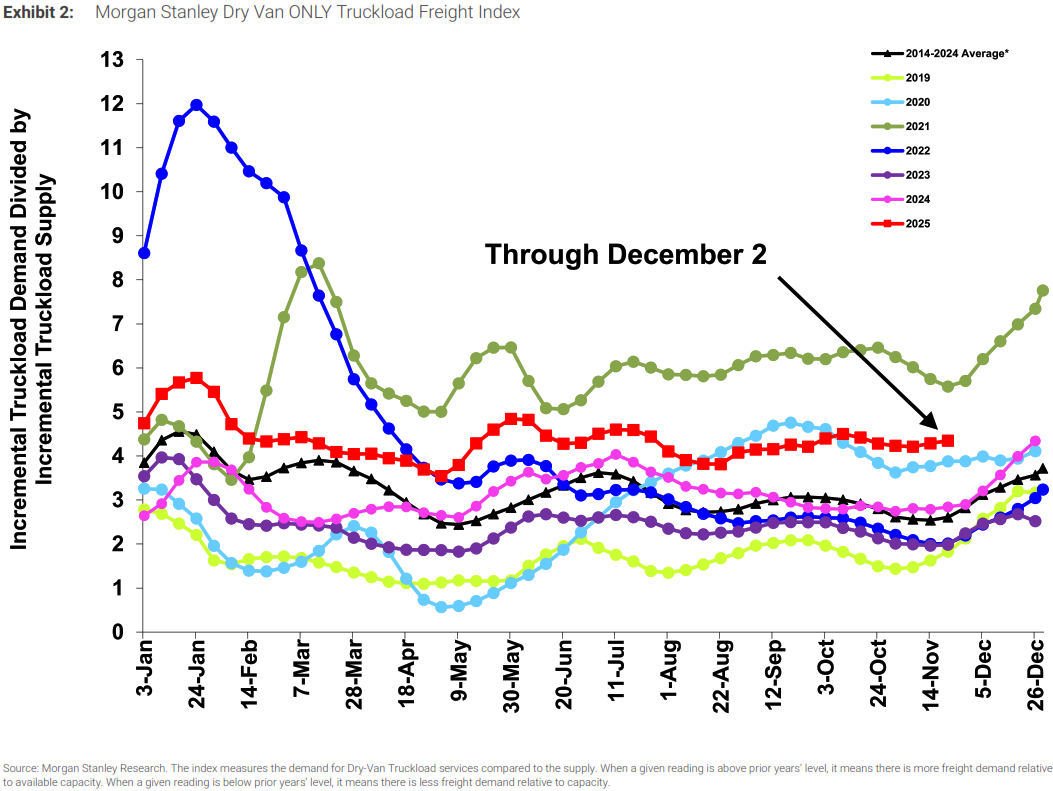
- Following sequential declines (directionally inline with seasonality) and a strong outperformance in early November, the Morgan Stanley Truckload Freight Index (MSTLFI) flipped in the back half of November, increasing sequentially but underperforming typical seasonality driven by both supply and demand.
Summary
Outbound tender rejections appeared reasonably stable in November when compared to the heightened volatility observed in October. Rejection rates increased somewhat steadily, yet modestly, through most of the month, briefly softening during the second week before rallying late in the period and reaching a peak of 7.06% in the days leading up to Thanksgiving — the highest level recorded since the Fourth of July holiday. The pre-holiday lift resulted in average rejection rates increasing 38 basis points MoM, marking the third consecutive month of gains and outperforming the historical seasonal average increase of 20 bps for November. Annual comparisons remained positive for the 23rd consecutive month; however, the YoY spread continued to narrow, with November registering the smallest differential since March 2024, suggesting that the pace of normalization may be decelerating. By equipment type, the November increase translated to MoM gains of 0.4% for dry van rejections and 0.5% for refrigerated equipment, while flatbed rejections rose 1.3% MoM. On a YoY basis, flatbed and dry van rejections remained elevated by roughly 50 and 60 basis points, respectively, while refrigerated rejections declined 0.9% YoY, marking the first annual contraction in reefer rejections in 26 months.
Ongoing capacity contraction dynamics were also reflected in the latest MSTLFI, despite a notable deterioration in overall sentiment. The index registered its strongest outperformance relative to seasonality since May during the first half of November, driven by continued strength in the supply component and the demand component posting its largest seasonal outperformance since August. These trends reversed in the latter half of the month, however, as both components underperformed typical seasonal patterns. Specifically, the demand component declined by ~80 basis points versus an average seasonal decrease of ~420 basis points, while the supply component fell by ~420 basis points compared to its typical seasonal decline of ~250 basis points. Concurrently, survey sentiment shifted materially more bearish in November following a relatively constructive October, with both current conditions and forward-looking indicators turning negative across all three primary components of the index: Truckload Demand, Truckload Supply and Truckload Rates.
Why It Matters
While seasonal dynamics and holiday-related disruptions were the primary catalysts, the persistence of elevated tender rejections amid sharply weakening demand further underscores the degree of capacity attrition that has occurred over the course of the year. Ongoing capacity exits have increased the market’s sensitivity to external shocks — including weather events and calendar-driven disruptions — as evidenced by the pronounced pre-holiday spike in rejection rates observed in November. Rejection rates consistently trending within the 5% to 7% range over the past several months suggests the truckload market is gradually moving closer to balance. From an operational standpoint, however, with rejection rates currently hovering near 6%, shippers should continue to expect relatively strong contract carrier compliance as the industry moves through the final holiday shipping period of the year.
This tightening dynamic was also reflected in the November 2025 Logistics Managers’ Index, where the Transportation Capacity index declined 4.5% MoM to a reading of 50.0, indicating no net expansion or contraction. According to the report, Transportation Capacity has not registered contraction since early 2022, and November’s reading represents one of the lowest levels recorded since the onset of the current freight recession. Capacity conditions were bifurcated across the month, with modest expansion early in November followed by contraction in the latter half. Importantly, the tightening appeared broadly distributed across the market, as both large and small firms reported identical Transportation Capacity readings of 50.0, signaling a more uniform reduction in available capacity rather than concentration within a specific segment of the industry.
Looking ahead to the final month of the year, the direction and magnitude of tender rejection volatility remain highly uncertain. Unlike the steady and sustained increases observed in late 2024 — when rejection rates briefly exceeded 10% and fueled expectations of an imminent market recovery — the pattern in 2025 has been characterized by episodic spikes followed by retracements. This peak-and-valley dynamic, albeit with a higher frequency of valleys, has elevated uncertainty and reinforced speculation over whether rejection rates can meaningfully approach the 9% threshold before year-end or whether continued demand erosion will remain the dominant force constraining further tightening in the truckload market.