Back to December 2025 Industry Update
December 2025 Industry Update: Dry Van
Dry van rates registered little change in November despite a slowdown in shipping activity.
Spot Rates
Key Points
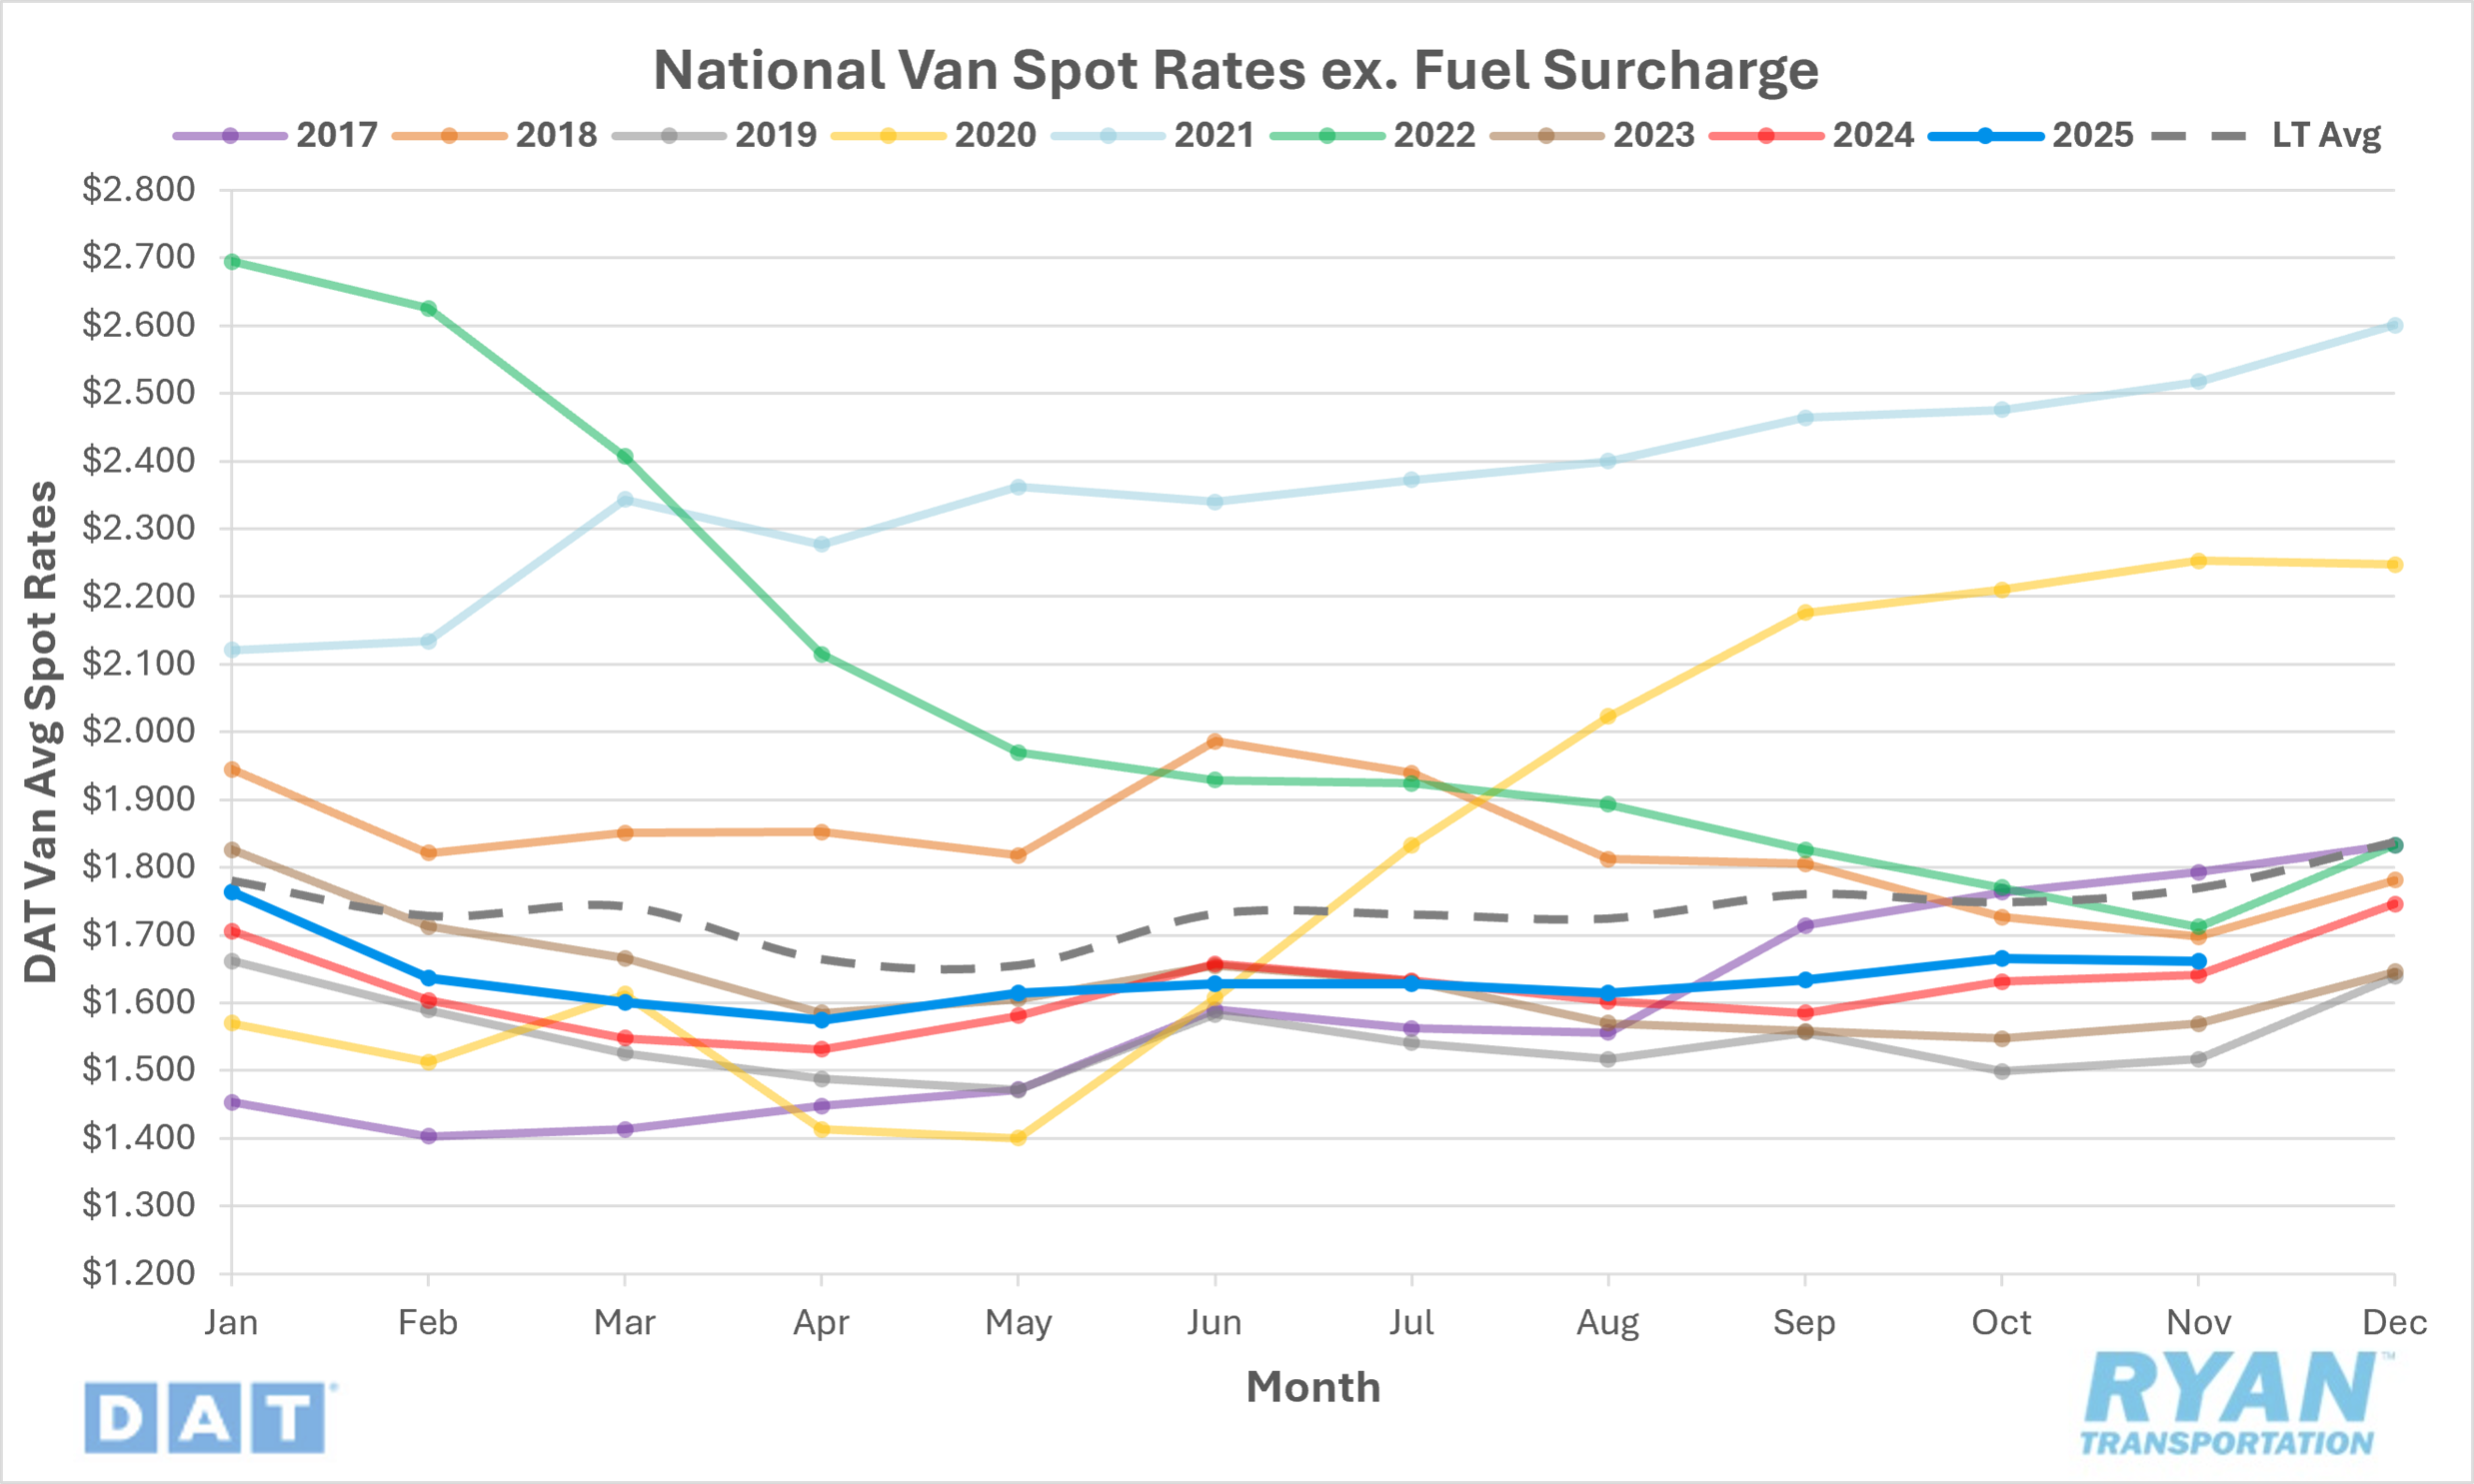
- The national average dry van spot rate, excluding fuel, was slightly lower but essentially flat in November, dropping by 0.2% MoM, or a fraction of a cent, to $1.66.
- Compared to November 2024, average dry van spot linehaul rates were up 1.2% YoY but were 6.1% below the LT average.
- Initially reported average dry van contract rates, exclusive of a fuel surcharge, rose 0.8% MoM in November and were 0.5% higher YoY.
Load-to-Truck Ratio
Key Points
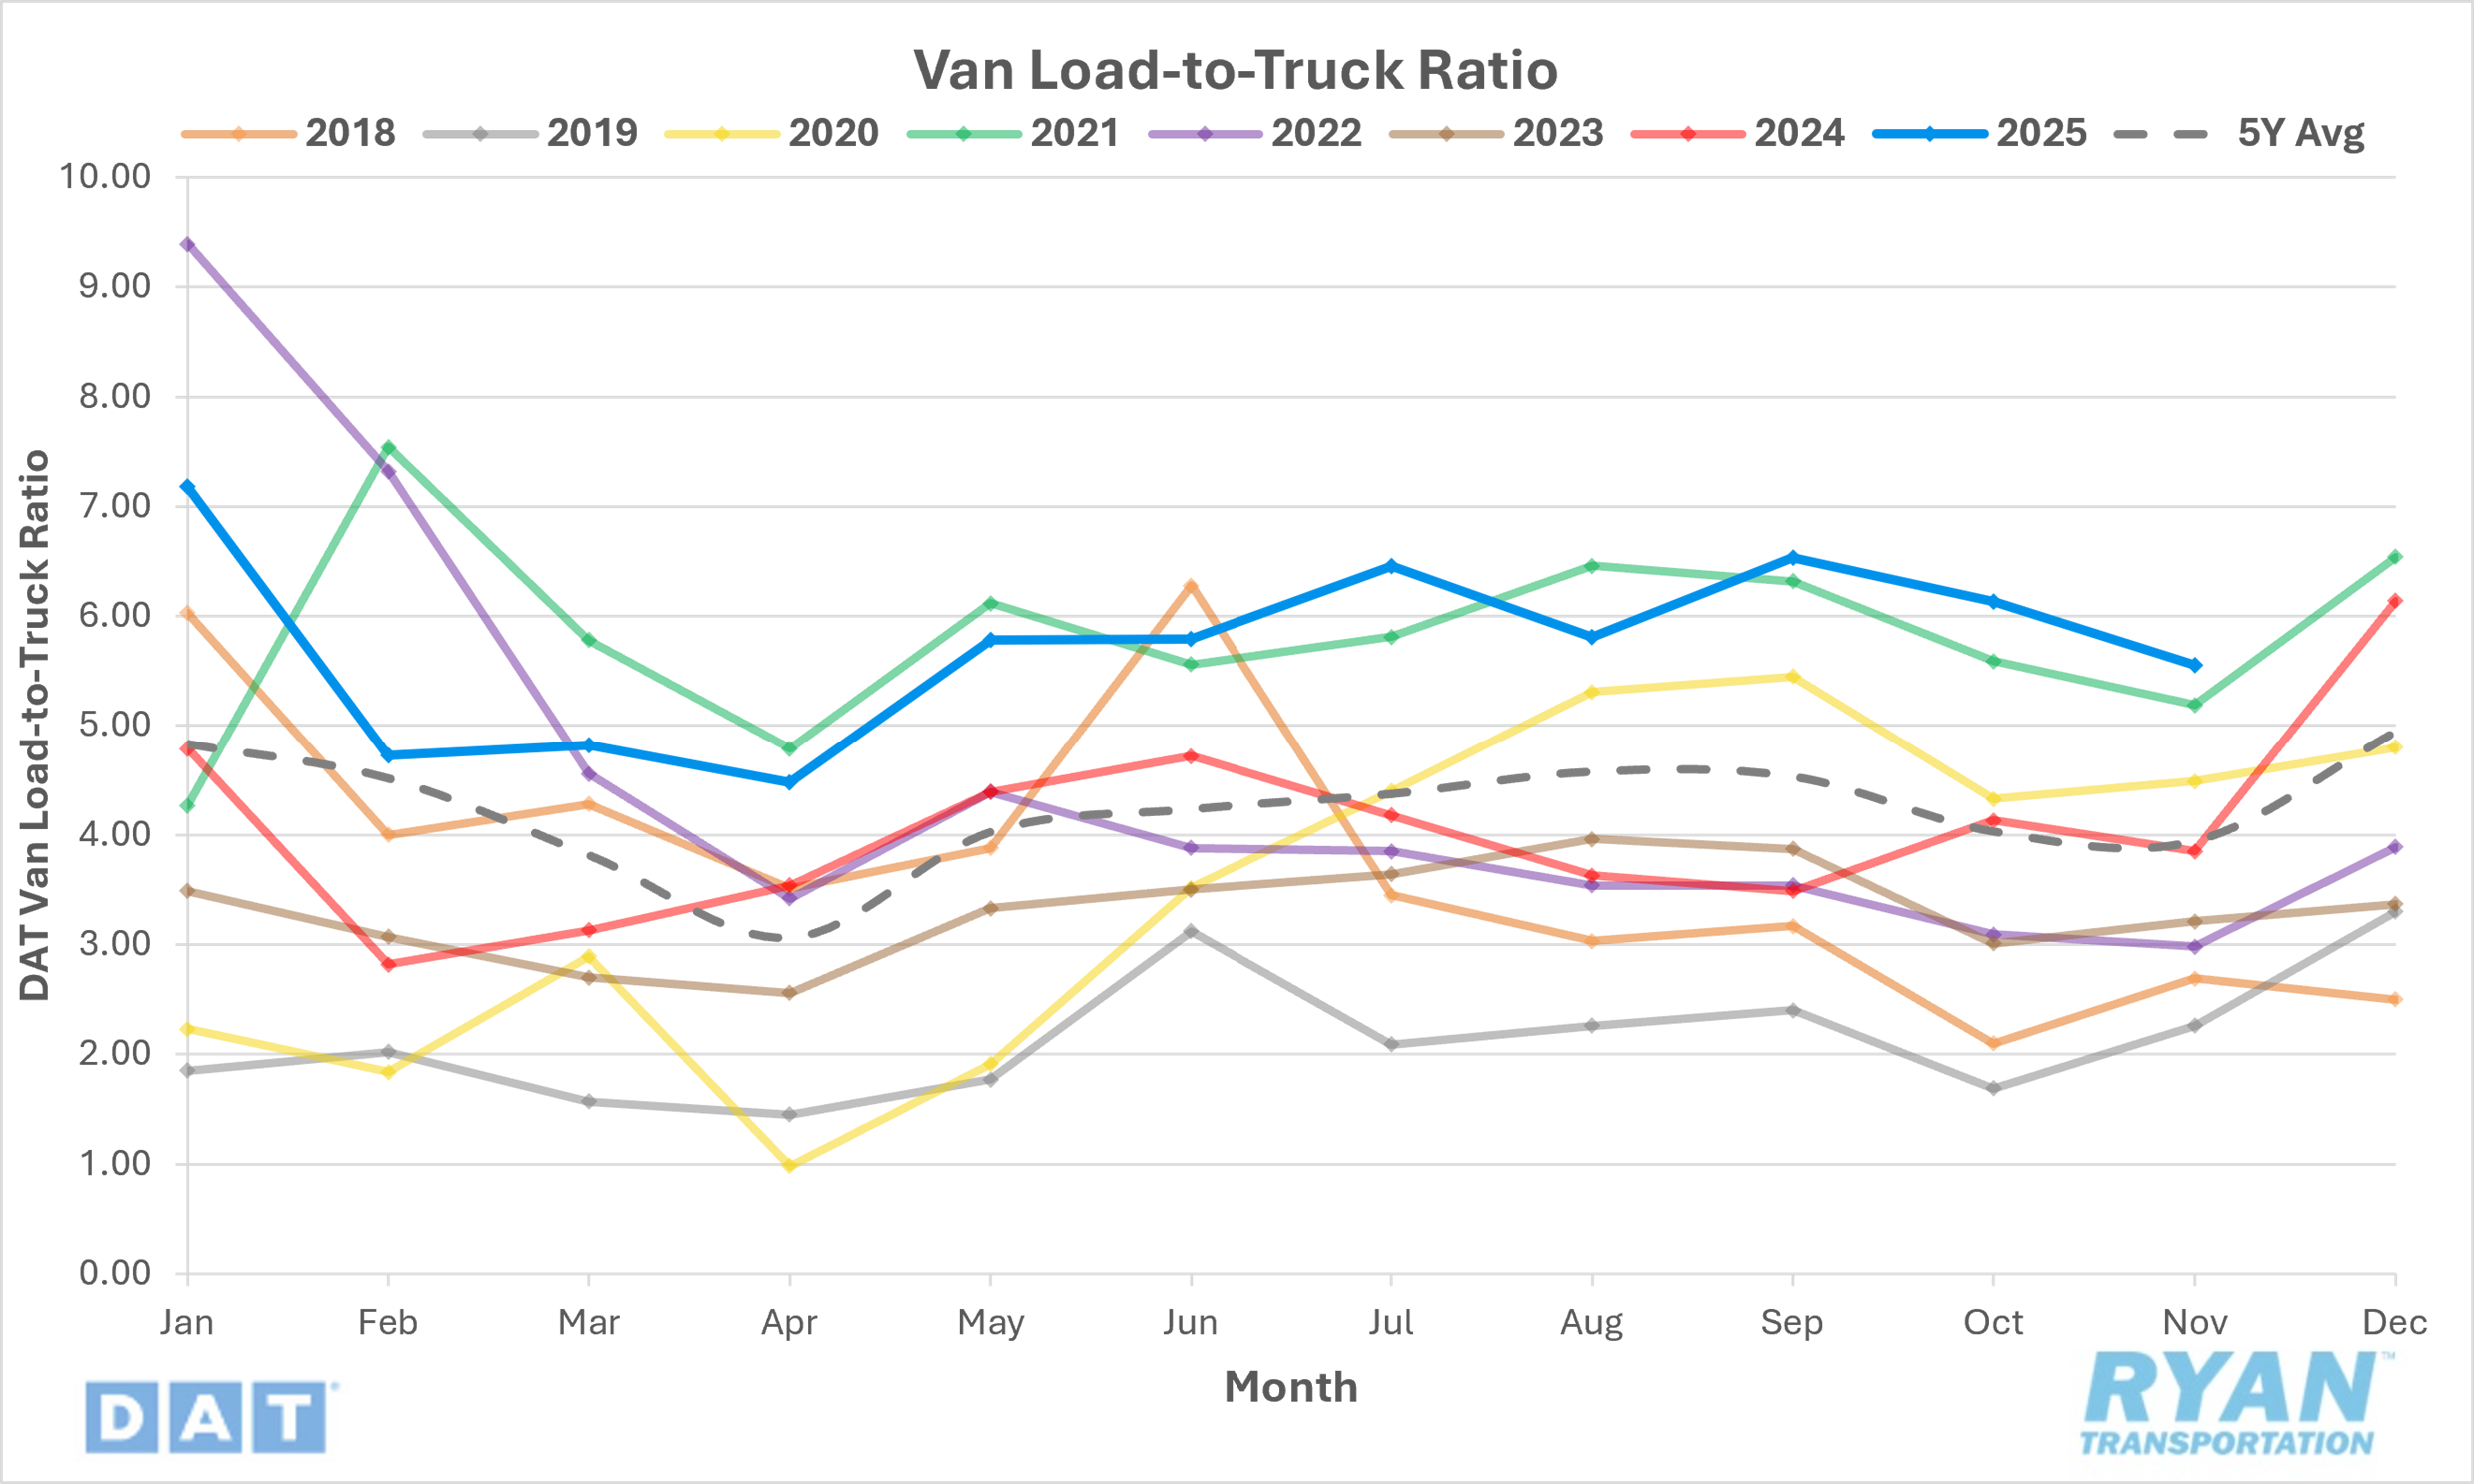
- The dry van load-to-truck ratio (LTR) declined 9.5% MoM in November, dropping from 6.13 in October to 5.55.
- Compared to the same time last year, the dry van LTR was 44.2% higher YoY and 40.7% above the 5-year average.
- According to load board data collected by DAT Freight & Analytics, dry van load posts declined 15.6% MoM while truck postings for dry vans fell 6.7% MoM.
Market Conditions

Dry Van Summary
Dry van market conditions in November 2025 remained under significant pressure as tariff and trade policy uncertainty continued to weigh heavily on manufacturing and freight demand. Ongoing concerns around pricing volatility and supply chain disruption have constrained capital investment and long-term planning, particularly among machinery and transportation equipment manufacturers. While importing remains more economical than reshoring for some shippers, the broader uncertainty has stalled order activity and limited freight visibility. This environment has translated into persistently soft volumes, low equipment utilization and limited prospects for a traditional peak season as carriers head toward 2026 focused on cost discipline and operational efficiency.
Freight data further reinforces the challenging demand backdrop. The U.S. Bank National Shipments Index declined 2.9% in the third quarter and was down 10.7% year over year, extending a multiyear contraction that has reduced shipment volumes by more than 40% since late 2020. Weakness in manufacturing, slowing residential construction and reduced discretionary consumer spending have all contributed to lower dry van freight flows. Corrugated cardboard shipments — a key leading indicator for retail and packaged goods — fell to their weakest third-quarter level since 2015, signaling subdued inventory replenishment ahead of the holiday season. This softness was also reflected in the ATA For-Hire Truck Tonnage Index, which posted its largest monthly decline in nearly two years in October and its steepest year-over-year drop of 2025.