Back to August 2025 Industry Update
August 2025 Industry Update: Truckload Rates
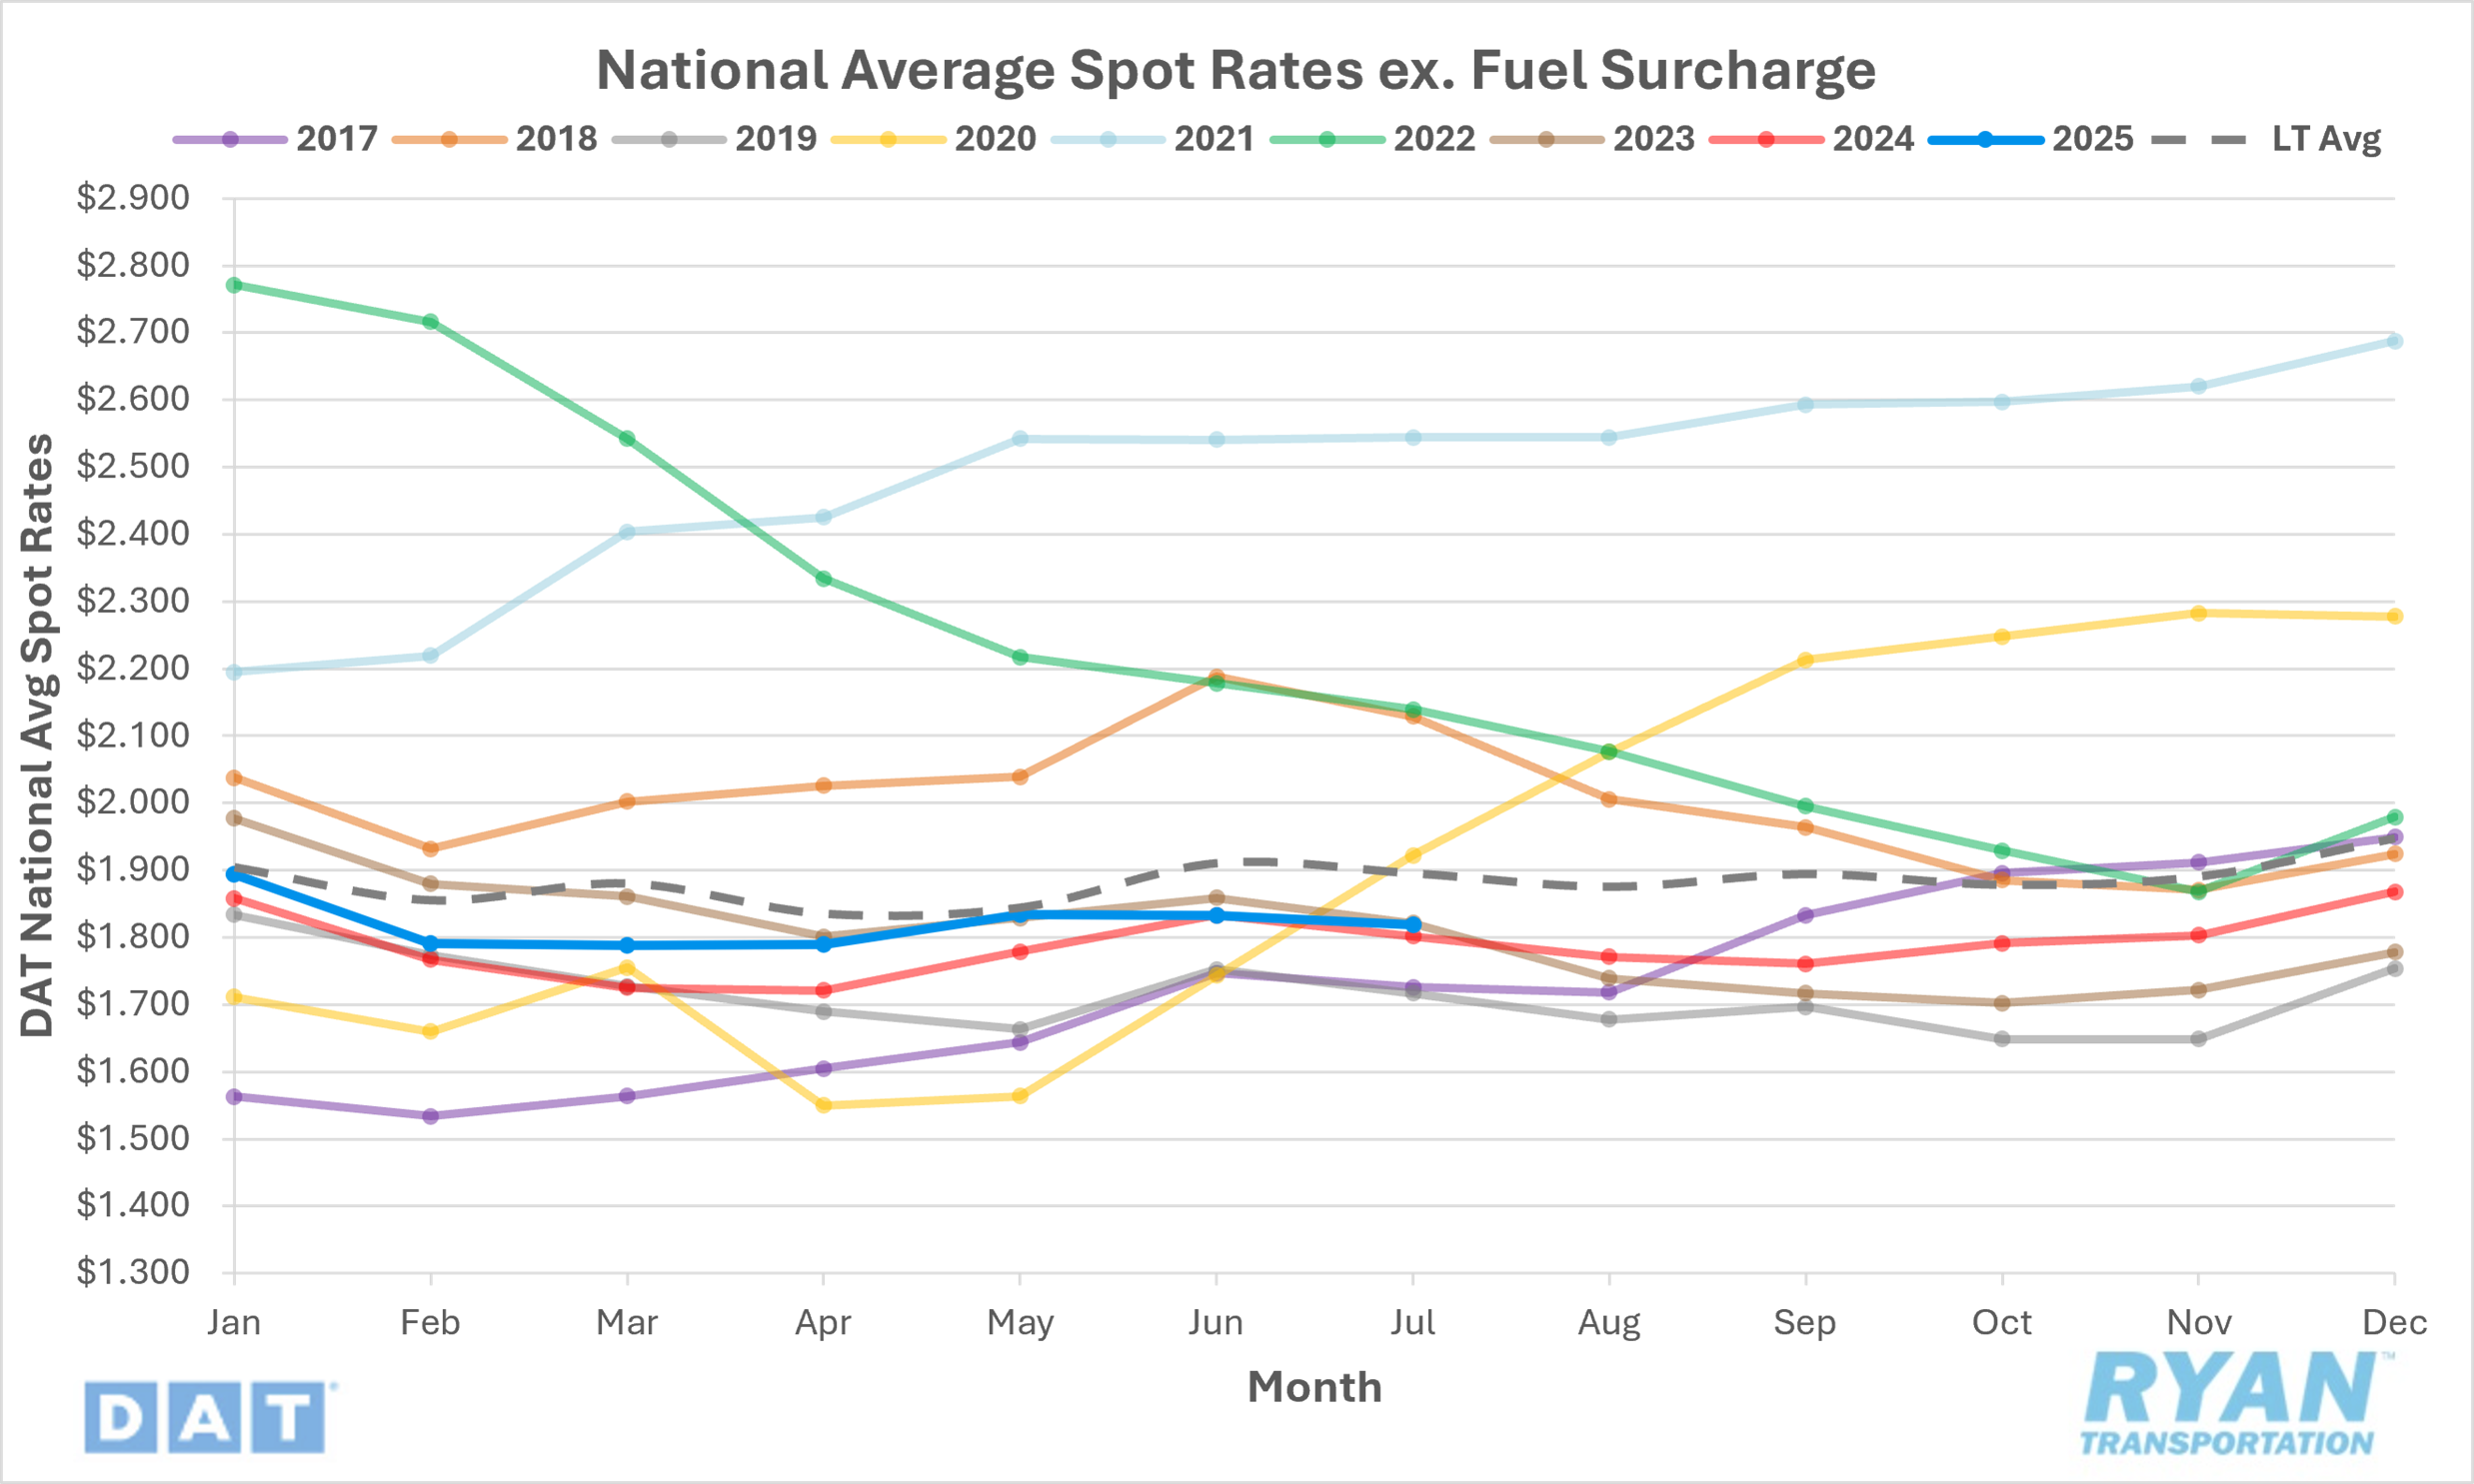
Average spot rates retreated in July as peak summer shipping season came to a close and excess capacity remains in the market.
Spot Rates
Key Points
The national average spot rate, excluding fuel, declined 0.7% MoM, or just over $0.01, to $1.82 in July.
Average linehaul rates were up 1.0% YoY compared to July 2024 but were 4.5% below the long-term (LT) average.
Contract Rates
Key Points
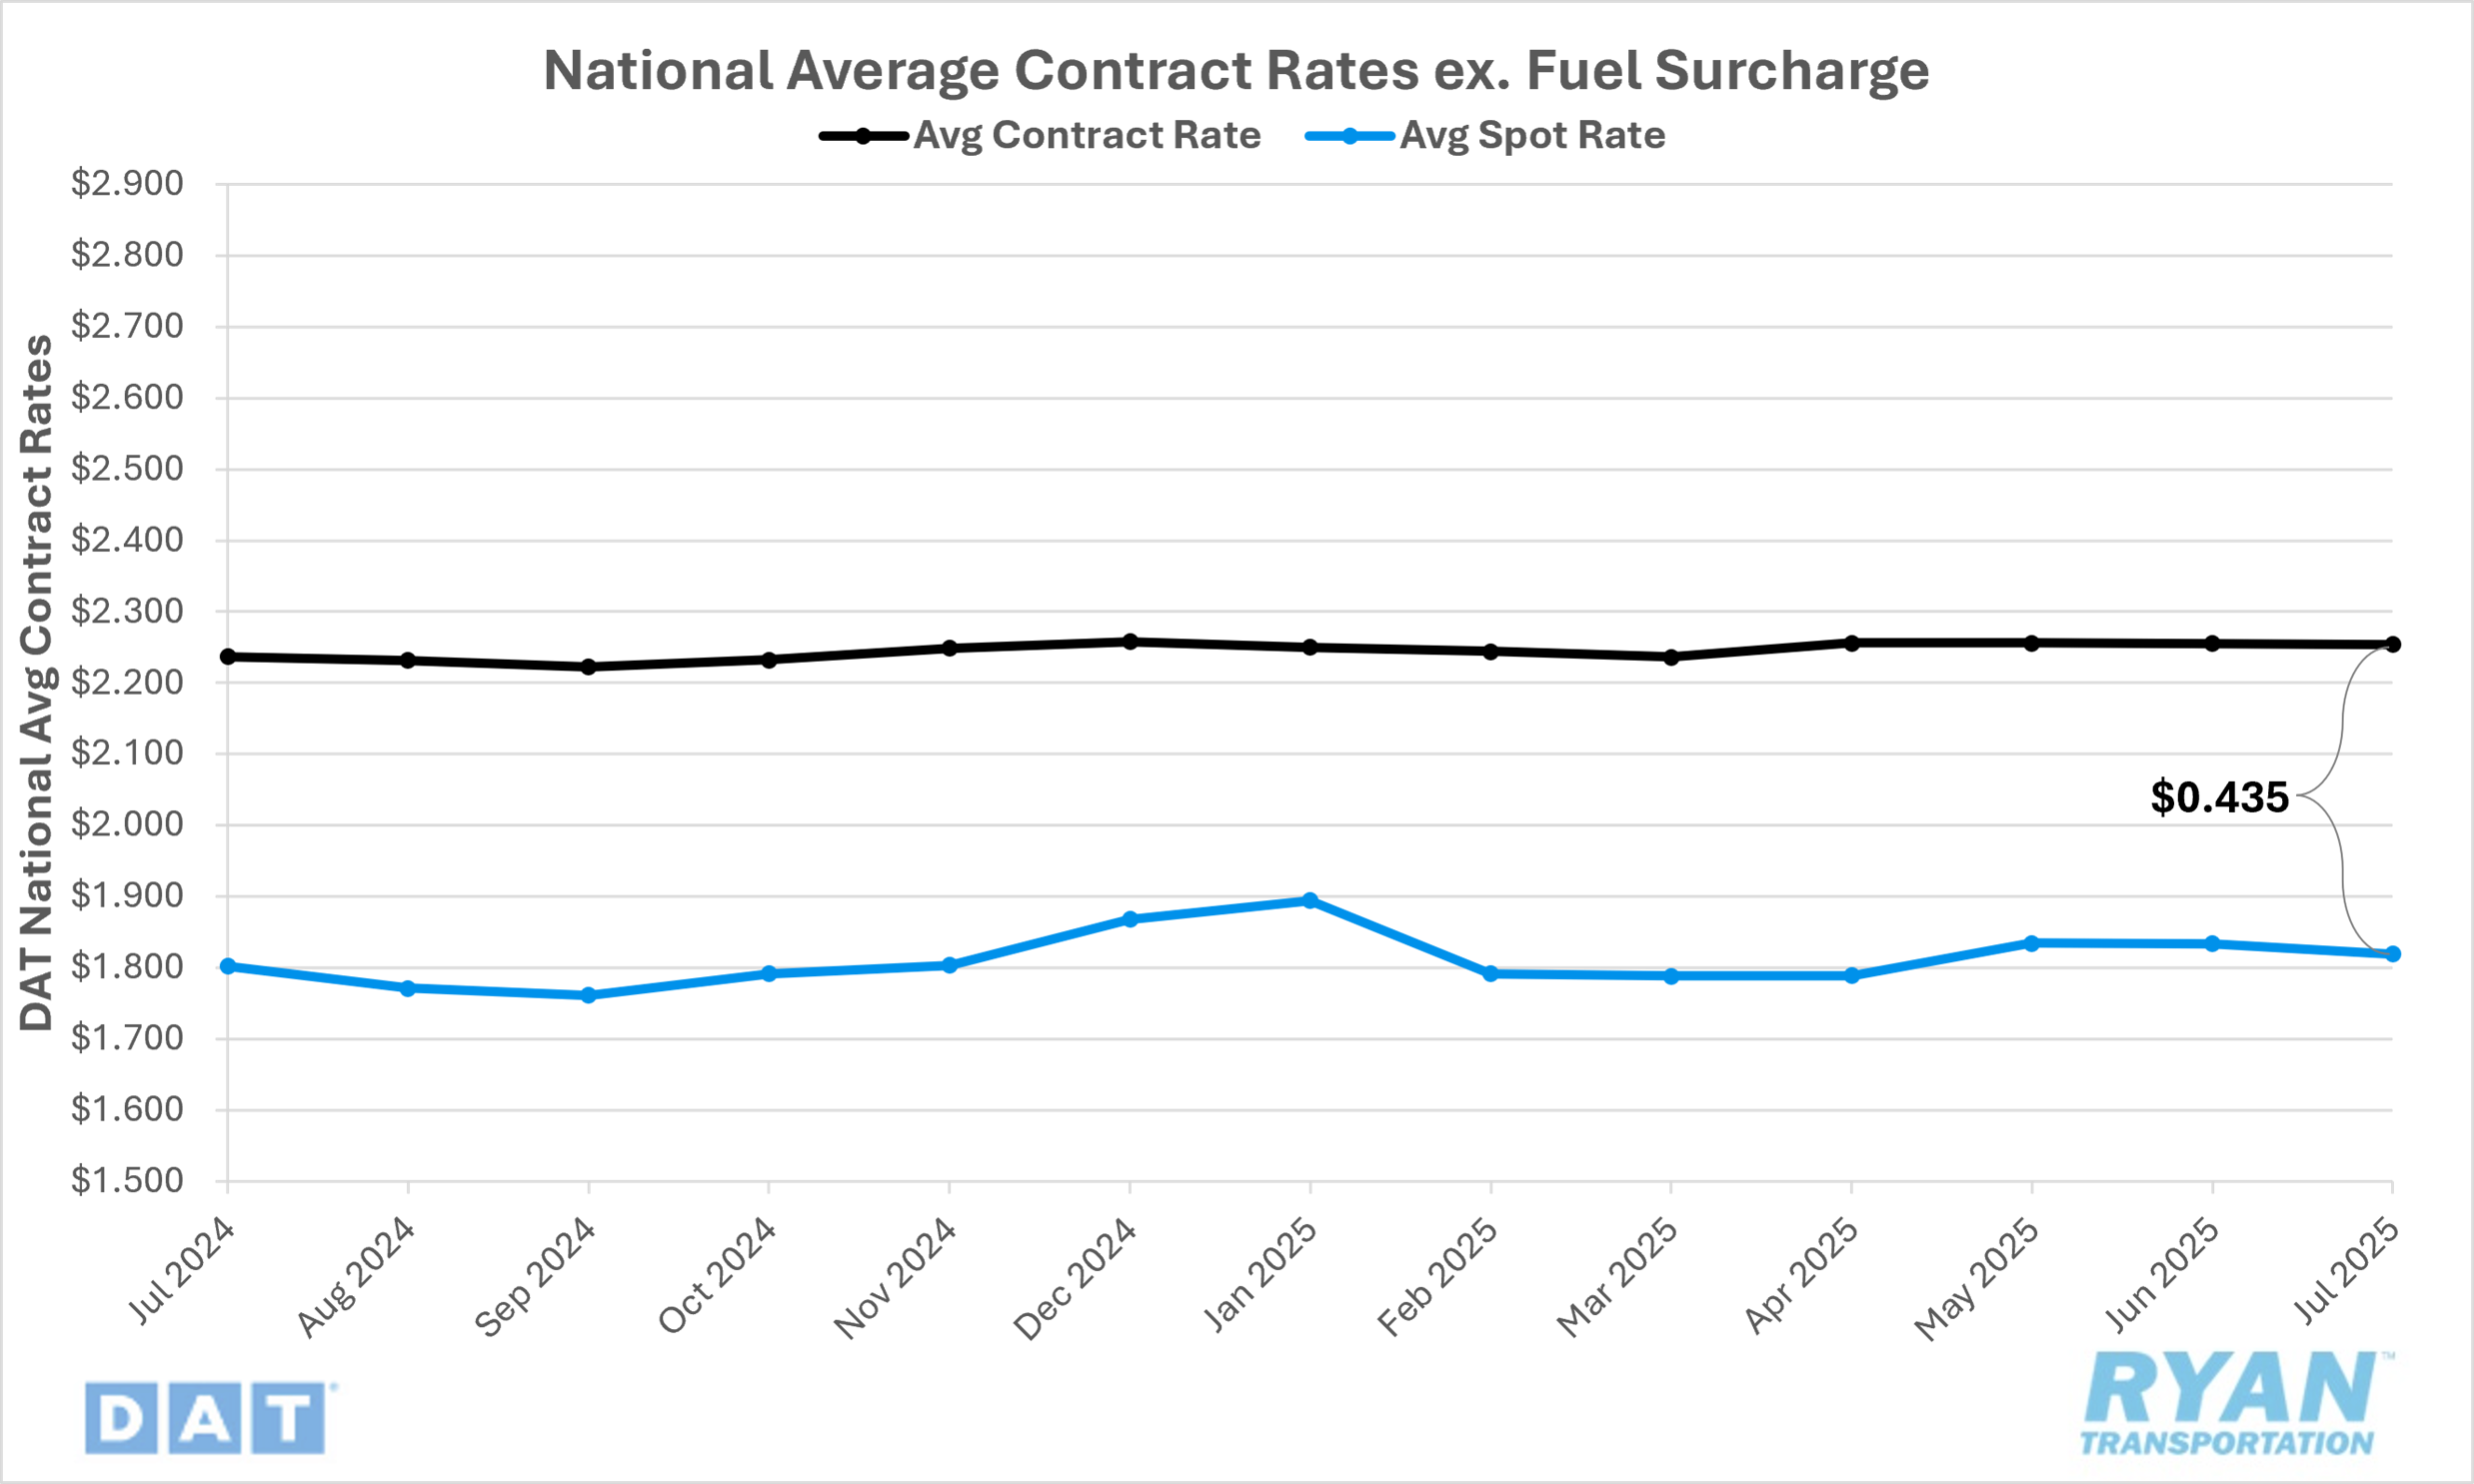
Initially reported average contract rates, excluding fuel, continued to trend flat MoM in July compared to June.
On an annual basis, initially reported average contract linehaul rates were up 0.4% YoY compared to July 2024.
The contract-to-spot spread increased, rising just over $0.01 from $0.422 in June to $0.435 in July.
Summary
After holding nearly flat MoM in June — declining by only a fraction of a cent — average national spot linehaul rates resumed their downward trajectory in July at an accelerated rate. On a seasonal basis, July’s average MoM decrease of just over $0.01 marginally outperformed the historical norm of nearly $0.02 but remained largely consistent with typical seasonal trends. This minimal outperformance, however, was sufficient to push annual comparisons back into positive territory after reverting to year-ago levels in June.
According to DAT’s 7-Day Average Spot Linehaul Rate Index, rates initially spiked by approximately $0.04 leading into the Fourth of July holiday. However, those gains were swiftly reversed as spot rates declined steadily throughout the month, particularly in the first half. Combined weekly declines of $0.04 over the first two weeks erased the pre-holiday increase, with an additional $0.02 WoW drop in the third week before rates stabilized in the final week of July. By month’s end, average spot rates had fallen roughly $0.06 from their early-July peak.
In the contract market, initially reported average contract linehaul rates remained virtually unchanged for the third consecutive month in July, following a modest $0.02 increase in April. This continued an ongoing pattern of stability in the contract market, where monthly rate movements have averaged just $0.001 over the past 12 months. Despite the lack of notable MoM movement, contract rates continued to trend above year-ago levels for the fourth consecutive month, marking only the fifth instance of positive annual growth in the past 34 months.
Why It Matters
The continued decline in average spot rates in July further supports the ongoing imbalance between excess carrier capacity and subdued freight demand. While seasonal softness in spot rates during July is not unusual, it is important to contextualize the trend observed so far this year. Historically, July declines follow sequential rate increases in May and June, driven by peak summer shipping demand. However, the limited uptick in May and the stagnant trend in June suggest that July’s rate deterioration reflects not only seasonal patterns but also persistent weakness in underlying market fundamentals.
According to the Q3 2025 TD Cowen/AFS Freight Index Forecast, the Truckload (TL) Linehaul Cost Per Shipment (CPS) increased by 1.7% QoQ in Q2 2025, while Miles Per Shipment (MPS) rose by 1.8% over the same period. While the report suggests the alignment between the cost and distance metrics could indicate the emergence of more stable market dynamics, the uncertainty surrounding tariff policies makes it unclear as to whether the gains in Q2 represent a structural shift or temporary deviation. Despite the modest quarterly improvement, the index recorded its tenth consecutive YoY decline in Q2. For Q3, the index is projected to edge down 0.4% QoQ, reaching a level 5.6% above its January 2018 baseline, though a minor YoY increase of 1.0% is forecasted.
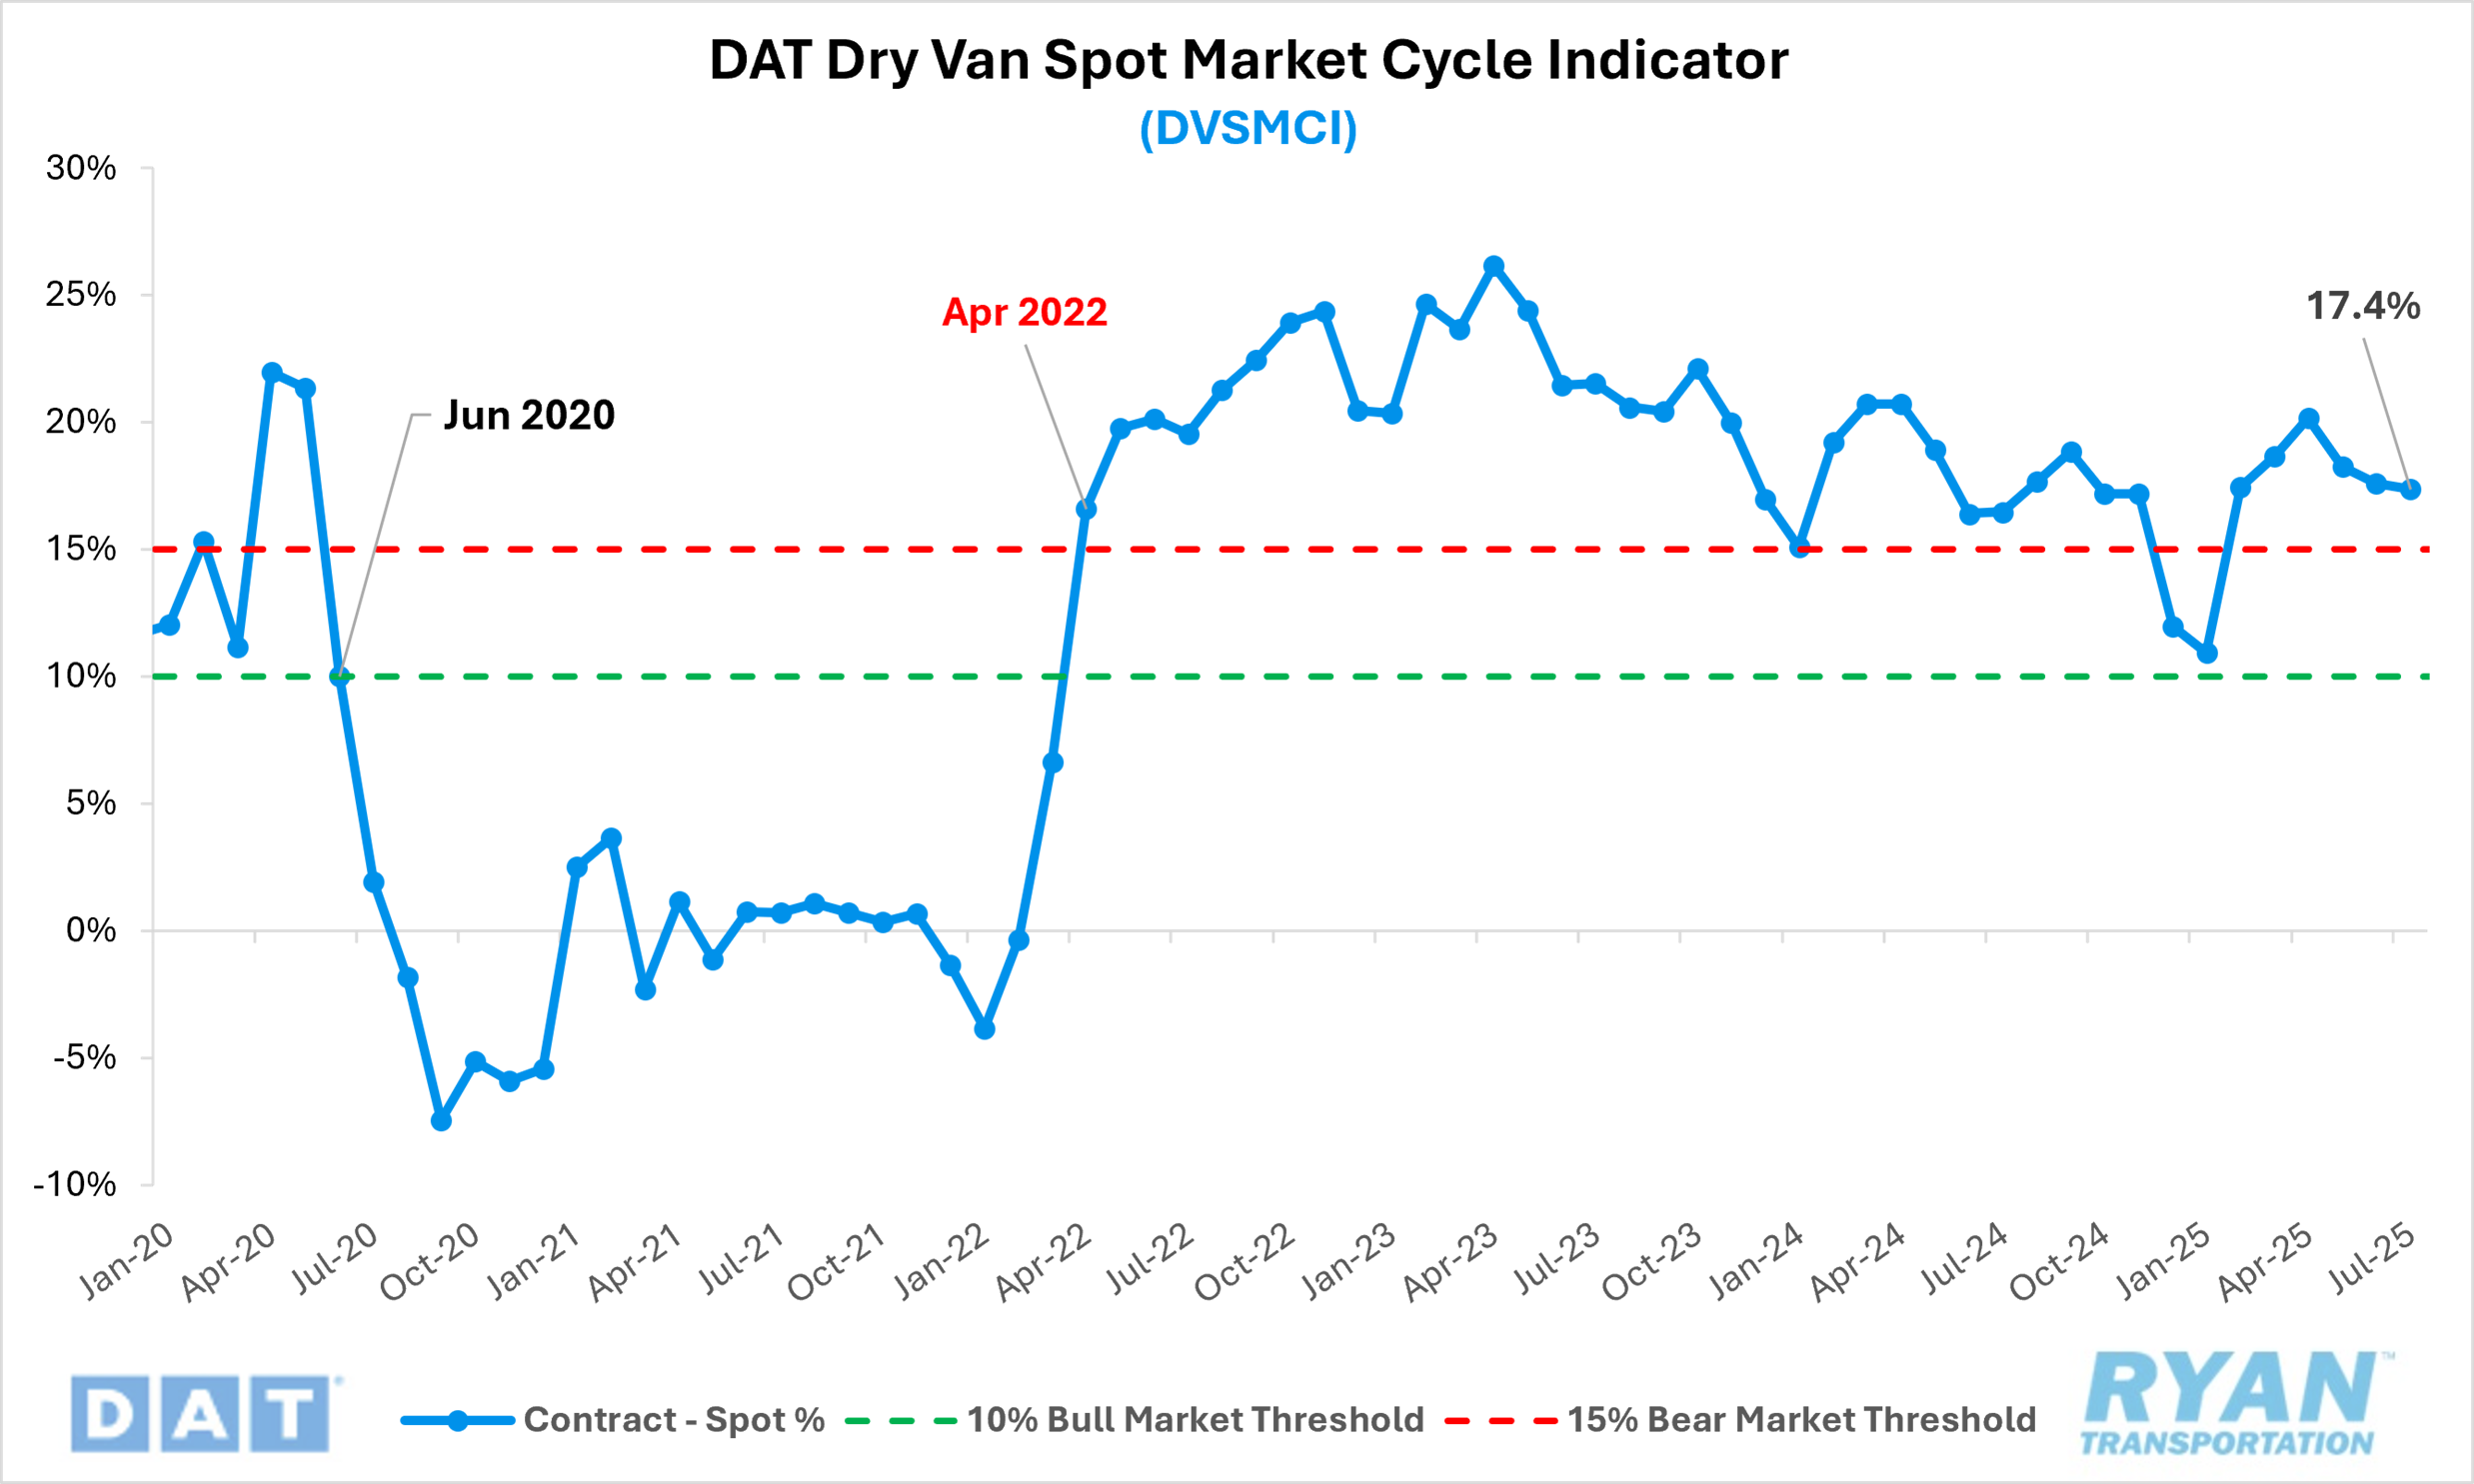
In the face of continued pricing pressure, the DAT Dry Van Spot Market Cycle Indicator (DVSMCI) continued to trend incrementally toward equilibrium in July, falling by 0.2 percentage points to 17.4%. This marked the fourth consecutive monthly decline for the index since its YTD peak at 20.2% in April. Developed by Dr. Jason Miller of Michigan State University, the DVSMCI measures the spread between spot and contract rates relative to historical averages. Sustained readings above 15% typically indicate bearish market conditions, while readings below 10% suggest a more bullish environment. Although current readings remain well above the bullish threshold, the steady improvement signals that the market continues to gradually work toward rebalancing.