Back to September 2026 Industry Update
September 2026 Industry Update: Truckload Demand
Main Takeaways
- Truckload demand softened in August as accepted volumes remained subdued and freight growth increasingly shifted toward rail and intermodal transportation.
- Manufacturing strength and lean inventories continued to support freight activity, helping maintain a stable floor for truckload demand despite moderating volume growth.
Summary
Truckload demand softened in August as shippers worked to rebuild inventory levels depleted during the peak summer shipping season. Contracted volumes continued to trend near the lower end of their historical range, even as overall shipping activity remained relatively healthy, supported by manufacturing activity and industrial production. Limited freight volume growth in the truckload sector suggests over-the-road providers are likely losing market share to rail carriers. The shift in shipping strategy comes as shippers aim to reduce aggregate logistics outlays and offset substantially elevated inventory carrying costs by slow-walking volumes via the less expensive domestic intermodal sector.
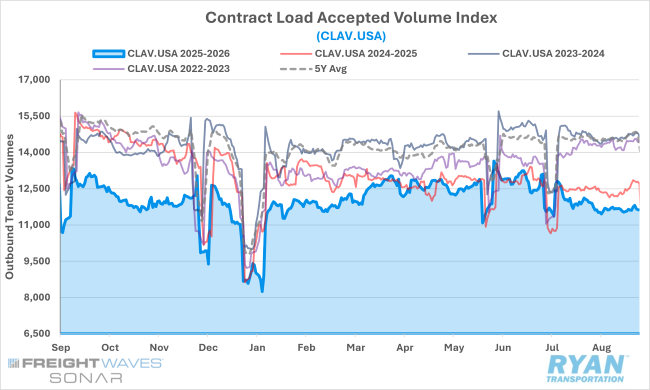
SONAR Contract Load Accepted Volumes Index (CLAV.USA)
Key Points
- Following a sharp contraction in July from their highest level in two years, average tender volumes accepted under contracted agreements continued to decline in August for the second straight month, dipping 3.4% MoM.
- Annual comparisons turned notably weaker in August and remained negative for the fourth straight month, down 6.3% YoY from the 0.5% decline recorded the previous month.
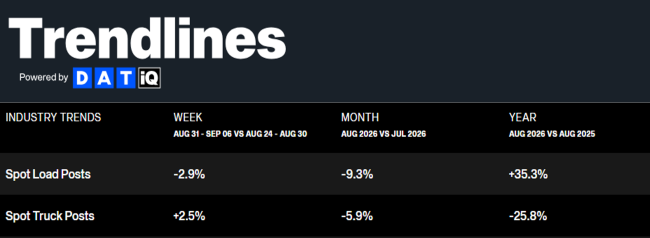
DAT Trendlines
Key Points
- Spot market activity continued to soften for the second straight month but continue to trend above year-ago levels, marking 17 straight months.
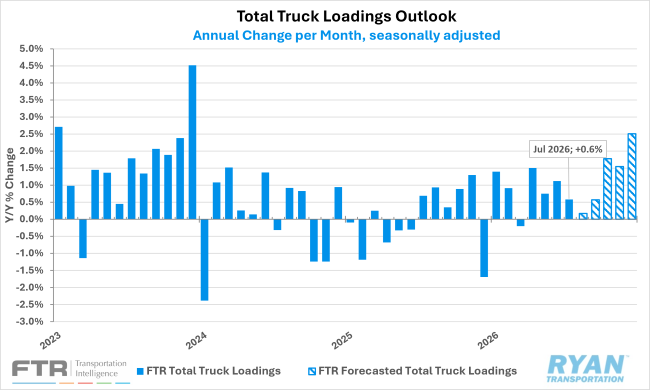
FTR Total Truck Loadings Outlook
Key Points
- In its latest forecast, FTR’s total truck loadings for 2026 eased to +1.0% YoY growth, down from +1.5%, mainly due to a weaker outlook for bulk aggregate loads.
- Across major equipment types, loading outlooks remained mixed: dry van and flatbed loadings improved on stronger automotive and industrial loadings, while refrigerated eased slightly.
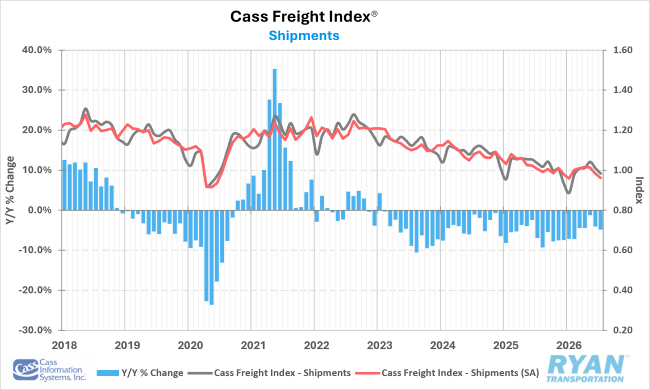
Cass Freight Index Shipments Forecast – July 2026
Key Points
- The shipments component of the Cass Freight Index® fell 2.6% MoM in July following a 3.1% decline in June and was down 4.8% YoY compared to July 2025.
- Seasonally adjusted (SA), shipments fell 2.2% MoM and 4.5% YoY in July.
- According to the Cass report, normal seasonal trends would put the index's shipment component down roughly 3% YoY in August.
LMI® AT A GLANCE
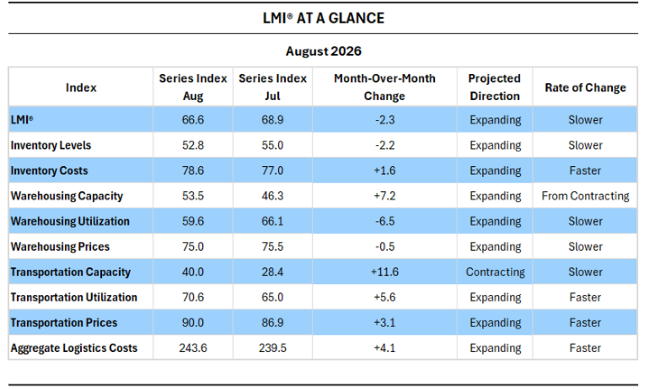
Key Points
- The LMI® read 66.6 in August, down (-2.2) from July’s 68.9 and 4.4 points below the recent four-year peak of 71.1 in June.
- Despite slower growth in Inventory Levels (-2.2 to 52.8), Inventory Costs (+1.6 to 78.6) and Transportation Prices (+3.1 to 90.0) continued to accelerate in August, driving Aggregate Logistics Costs above 240.0, the threshold that generally indicates higher levels of supply-driven inflation.
- Per the LMI® report, the bifurcation between the slight contraction in Inventory Levels reported by Upstream firms (producers/wholesalers) and the rapid expansion of inventories reported by Downstream firms (retailers) in August likely reflects retailers rebuilding inventories for Q4 after running them down during the back-to-school season.
Descartes U.S. Container Import Volumes
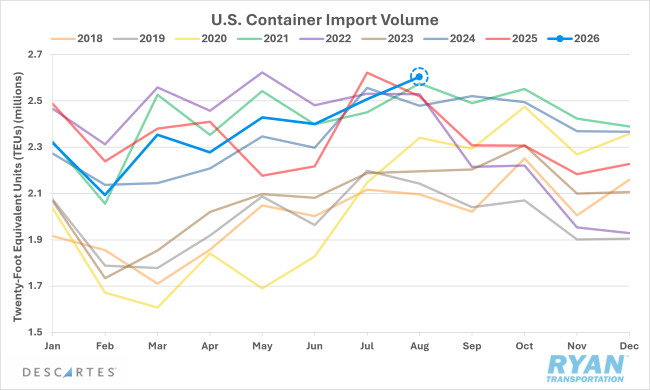
Key Points
- U.S. containerized imports continued to climb in August, increasing by 3.8% MoM from July to reach 2,603,709 twenty-foot equivalent units (TEUs) — the third-highest monthly volume on record, behind only May 2022 and July 2025.
- Compared to August 2025 levels, imports were up 3.3% YoY and 21.5% above August 2019 levels, while YTD totals are down slightly by just 0.4% YoY compared to the first eight months of 2025.
- August TEU levels continue to indicate resilient import demand despite persistent policy and geopolitical uncertainty, increased port delays and higher international shipping container costs
Drewry World Container Index
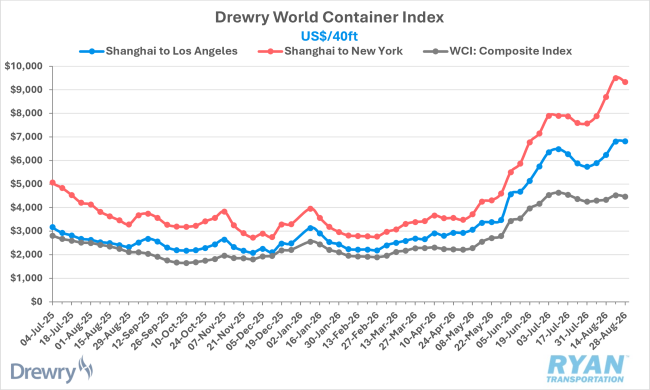
Key Points
- After steady declines throughout July, the Drewry WCI moderated in August as rebounding demand and aggressive capacity management through blank sailings in the Transpacific trade lanes pushed the overall index up through the first three weeks of the month.
- This was before geopolitical pressures and port congestion caused rates to drop in the final week, leaving the index up 5.1% MoM from where it started and 111% higher YoY than August 2025 levels.
- Within the Transpacific trade lanes, Shanghai to Los Angeles increased 15.7% MoM from $5,894 to $6,818, while Shanghai to New York City rose 18.2% MoM from $7,893 to $9,333.
Outlook
Truckload demand is expected to remain steady throughout the remainder of 2026, supported by continued manufacturing expansion, lean inventory levels, and relatively resilient broader economic conditions. However, growth is likely to remain moderate as shippers continue to leverage intermodal networks where service and pricing advantages exist. Seasonal freight activity and ongoing industrial investment should support truckload volumes, but demand is unlikely to accelerate meaningfully without stronger consumer spending or a broader increase in goods movement.