Back to September 2026 Industry Update
September 2026 Industry Update: U.S. Economy
Main Takeaways
- Manufacturing activity remained in expansion territory for an eighth consecutive month, supported by stronger production levels, employment growth and strong demand.
- Residential construction activity remains volatile, with housing starts weakening considerably while permits were more stable but still weak historically.
- Consumer spending rebounded in August as discretionary services remained the primary growth driver, despite evidence of shifting buying behaviors as customers start seeking lower-cost alternatives and value.
Summary
The U.S. economy continued to expand at a modest pace in August, supported by ongoing strength in the manufacturing sector, steady data center and AI infrastructure investment and the persistent resilience in consumer spending. Domestic factory activity remained a bright spot as production levels continued to expand amidst healthy order backlogs and easing, though still elevated, pricing pressures. At the same time, broader economic growth remains uncertain as housing activity remains discouraging, the labor market continues to show signs of cooling despite improving payroll figures and consumer sentiment remains at historically low levels.
United States ISM Manufacturing PMI
Key Points
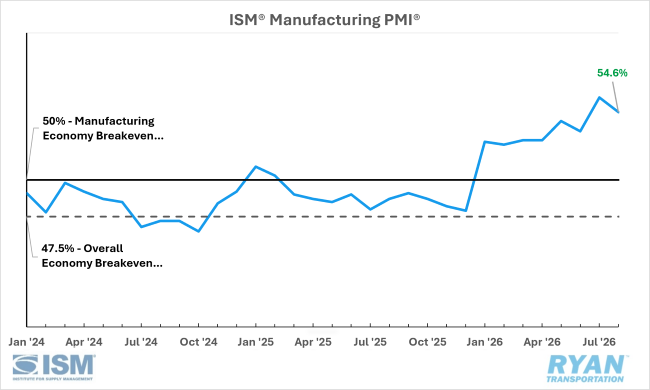
- U.S. manufacturing activity remained in expansion territory in August, but at a slower pace than in July, with the ISM® Manufacturing PMI® registering 54.6%, down 1 percentage point from July’s reading.
- Five of the six largest manufacturing industries expanded in August, in this order: Transportation Equipment; Petroleum & Coal Products; Computer & Electronic Products; Machinery; and Food, Beverage & Tobacco Products.
- In the manufacturing economy, 22% of sectors' gross domestic product (GDP) contracted in August, up from 20% in July, while 2% of manufacturing GDP was in strong contraction, up from zero percent in July.
Manufacturing at a Glance
Key Points
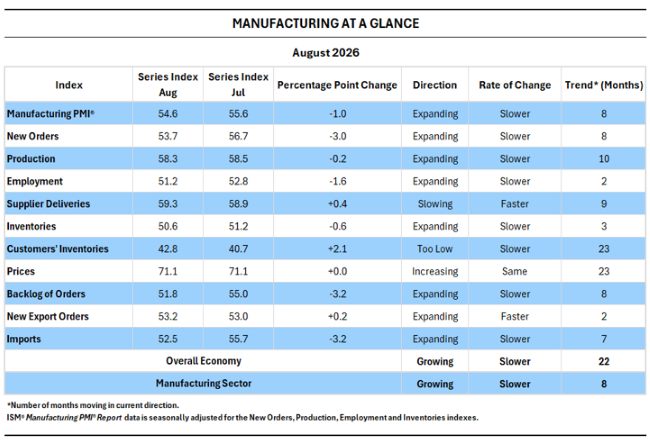
- All five subindexes that factor directly into the Manufacturing PMI® remained in expansion territory in August, with only one (Supplier Deliveries) expanding faster than last month, indicating a continuing supply-chain slowdown.
- Three of the four demand indicators (New Orders, Backlog of Orders, and New Export Orders) remained in expansion territory. At the same time, the Customers’ Inventories Index continues to trend in “too low” territory, contracting at a slower rate, a positive for future production.
- Output components were mostly positive as the Production Index continued to expand for the 10th consecutive month. Meanwhile, the Employment Index remained in growth territory, though at a slower pace than in July.
- Finally, input factors remained mixed. The Supplier Deliveries Index expanded faster in August, the Inventories Index expansion slowed and the Pricing Index repeated its July reading, remaining in strong expansion territory for the 24th straight month.
New Residential Construction
Key Points
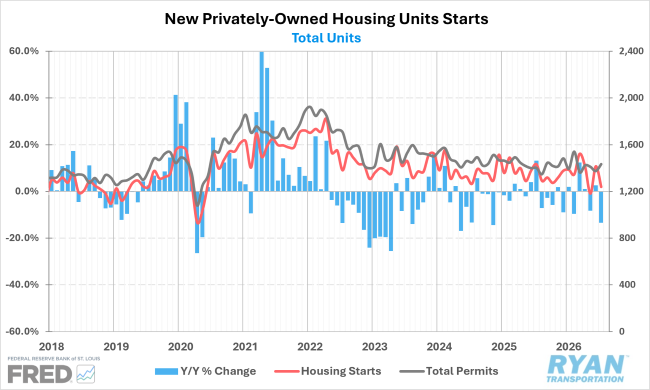
- Volatility in the residential construction sector continued in July, with total housing starts falling 12.4% MoM on a seasonally adjusted basis after a 19.7% spike in June and down 13.5% YoY, the weakest annual comparison since November 2024.
- July’s annualized rate of housing starts registered 1.239 million units, the lowest level since May 2020, except for the significantly weaker level recorded in May of this year of 1.182 million starts.
- Permits authorized for future construction rebounded in July, rising 4.3% MoM and up 2.4% YoY, with single-family permits rising 2.5% MoM while multi-family permits jumped 7.3% after a 4.1% decline in June.
Bank of America Consumer Checkpoint, Total Card Spending
Key Points
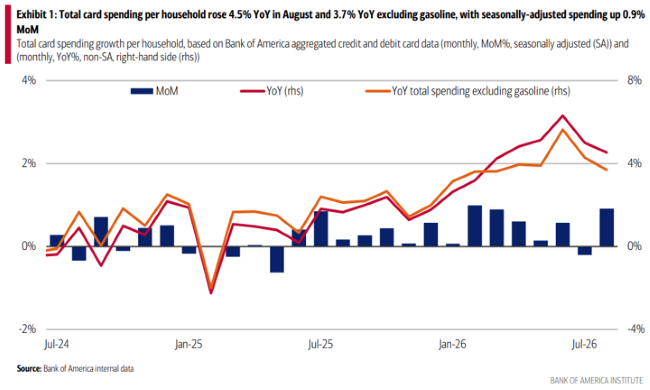
- Seasonally adjusted spending per household rebounded in August after a moderate decline in July, jumping 0.9% MoM and up 4.5% YoY, down from the 5.0% gain in July, according to Bank of America’s internal debit and credit card spending data.
- Excluding gasoline, total spending was up 3.7% YoY in August, down from 4.3% in July but almost 2.5 times the rate in 2025, with discretionary services remaining the primary driver of spending growth.
- Spending and wage growth have largely converged across income groups, with discretionary spending rising 5.9% YoY for higher-income households versus a 5.7% increase for lower-income counterparts, the smallest gap since January 2024.
Advanced Retail Trade Sales
Key Points
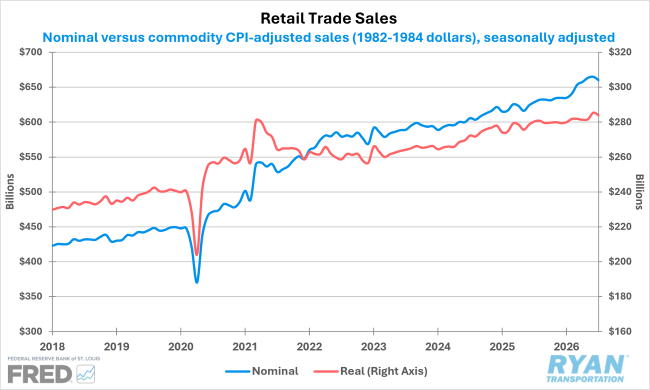
- Retail and food service sales declined 0.6% MoM, seasonally adjusted, in July, marking the first decrease since October and the largest monthly decline since May last year, while annual comparisons were up 4.9% YoY, the softest comparison since March.
- Lower gasoline prices in July kept gasoline station sales a net drag on overall retail sales, but to a much smaller extent than in June, with gasoline station sales down 0.9% MoM in July after a 5.8% decline in June but still 16.1% above year-ago levels.
- Excluding food service sales from restaurants and bars, retail trade sales declined 0.8% MoM and were up 5.0% YoY.
Outlook
Near-term economic conditions should remain relatively stable, with expansion through the remainder of 2026 supported by manufacturing growth and consumer resilience. Leaner inventories, strong industrial production and ongoing investment in technology and infrastructure should help sustain economic activity and freight demand in the months ahead. However, some cautionary signals remain, most notably inflation outpacing wage growth and the potential to erode consumer spending and demand. Additionally, how the Federal Reserve addresses these inflationary pressures will be worth watching, as a higher target funds rate could stifle further investment and cause the recent manufacturing recovery to stall.