Back to October 2026 Industry Update
October 2026 Industry Update: Truckload Demand
Main Takeaways
- Truckload demand softened in August as accepted volumes remained subdued and freight growth increasingly shifted toward rail and intermodal transportation.
- Manufacturing strength and lean inventories continued to support freight activity, helping maintain a stable floor for truckload demand despite moderating volume growth.
Summary
Despite a brief rebound following the post-Labor Day lull in shipping activity, overall truckload demand continued to soften in September. While contract volumes weakened, spot market activity gained market share as elevated rates and fuel costs, paired with tighter capacity, further disrupted routing guides. Import activity remained strong, and inventories continued to build in preparation for the Q4 holiday shopping season. Although data centers and automotive production remained strong, weak housing activity and increased competition from rail providers continued to limit broader truckload volume growth.
SONAR Contract Load Accepted Volumes Index (CLAV.USA)
Key Points
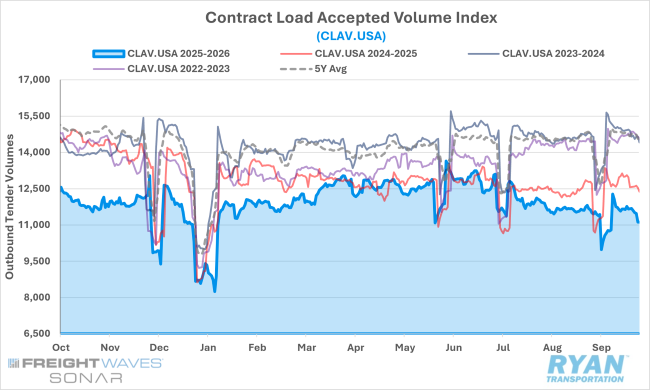
- Average tender volumes accepted under contract continued to decline for the third straight month in September, dropping 2.4% MoM.
- Following this decline, accepted contract tender volumes fell further in annual terms in September, down 8.3% YoY.
DAT Trendlines
Key Points
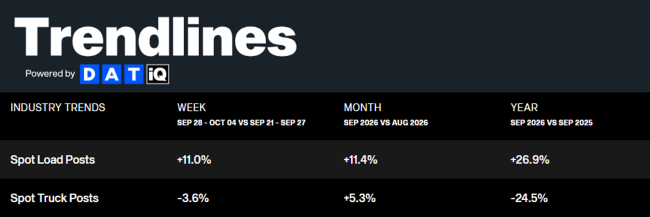
- Spot market activity rebounded in September following two months of declines and has remained elevated compared to year-ago levels for 18 consecutive months.
FTR Total Truck Loadings Outlook
Key Points
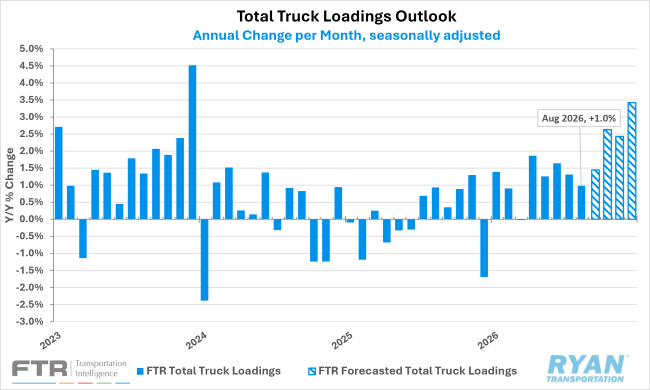
- FTR revised its 2026 total truck loadings outlook upward in its latest release, with loadings improving to +1.6% YoY from +1.0% previously, driven primarily by renewed strength in bulk/dump loadings.
- Across major equipment types, total loading forecasts for the dry van and refrigerated sectors remained unchanged in September, registering +1.8% YoY and +1.7% YoY, respectively, while flatbed loadings rose marginally from +4.1% YoY in the prior outlook to +4.4% growth for 2026.
- The 2027 total truck loadings outlook also rose, with forecasts climbing to +1.9% YoY from +1.5% previously.
Cass Freight Index Shipments Forecast – August 2026
Key Points
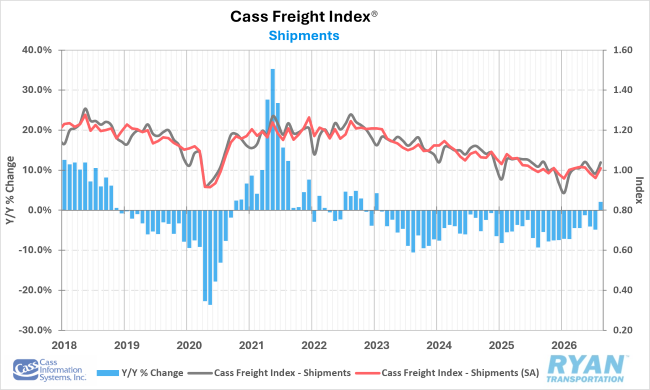
- The shipments component of the Cass Freight Index® rose 5.6% MoM and was up 2.1% YoY in August, marking the first YoY increase since January 2023 and ending a 42-month streak of annual declines.
- In seasonally adjusted terms, the shipments component rose 5.0% MoM in August, nearly reversing the June and July declines, and was up 1.8% YoY from August 2025.
- According to the latest Cass Report, normal seasonal trends reflect a 1% YoY increase in the shipments component for September.
LMI® AT A GLANCE
Key Points
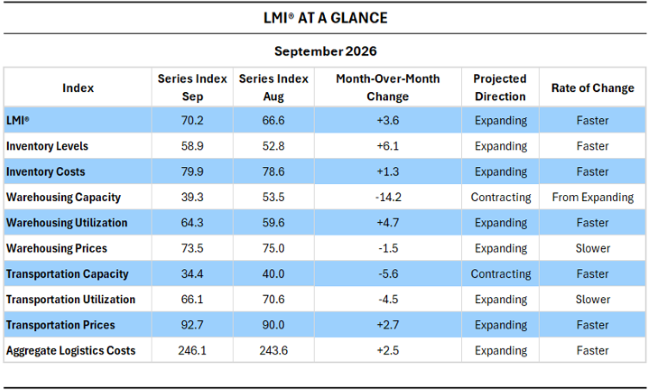
- The September 2026 LMI® read in at 70.2, up (+3.6) from August’s reading of 66.6 and the second-highest reading in four years, just behind June’s reading of 71.1.
- Inventory Levels rebounded sharply in September (+6.1) to 58.9, driven disproportionately by upstream firms at the wholesale level. Higher warehousing and storage costs led companies to rush imports ahead of the neo-seasonal trend of commodities moving down the supply chain to retail, which typically occurs in mid-October in preparation for the holiday shipping season.
- The elevated cost metrics between Inventory Costs, Warehousing Prices and Transportation Prices have pushed aggregate logistics costs to 246.1 in September, up (+2.5) from August and the highest reading for this aggregate metric since April 2022, adding significant pressure on supply chains and consumers alike.
Descartes U.S. Container Import Volumes
Key Points
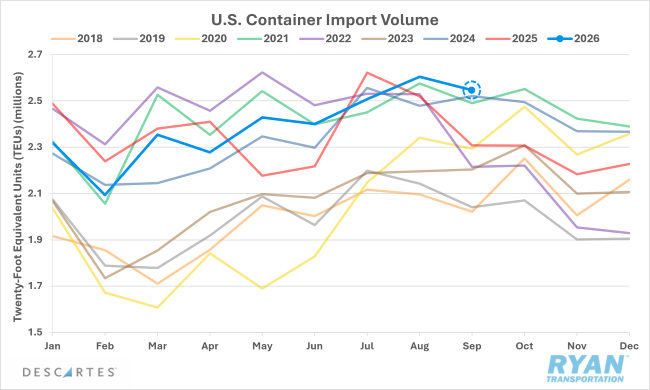
- U.S. containerized imports fell 2.2% MoM in September to 2,546,261 twenty-foot equivalent units (TEUs).
- Despite the monthly decline, imports were well above the same month last year, up 10.3% YoY, marking the highest September volume on record and 24.8% above September 2019 levels.
- Imports from China rose sharply in September, up 4.5% MoM from August and 21.2% YoY compared to September 2025 levels, while most imports from other origin countries declined.
Drewry World Container Index
Key Points
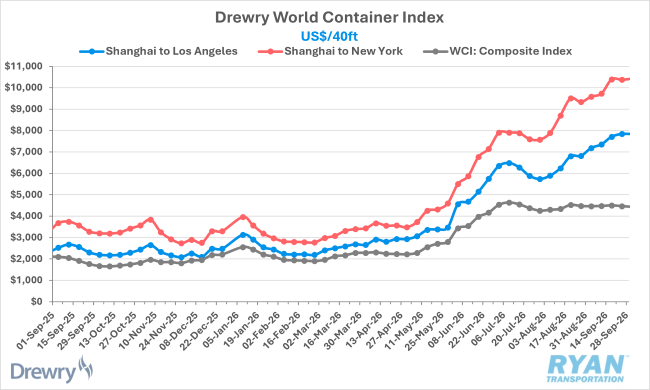
- The pre-Golden Week shipping rush and aggressive capacity management measures through blank sailings in the Transpacific trade lanes were offset by weakness in the Asia-Europe corridors. This stemmed from rising effective capacity as services through the Suez Canal gradually returned, keeping the global container index mostly flat throughout September, with the index down 0.7% MoM but still significantly above year-ago levels by an average of 137.2% YoY.
- Strength in the Transpacific trade lanes dominated global container rate performance, with Shanghai to Los Angeles up 15.0% MoM to $7,838 from $7,185. In comparison, Shanghai to New York City rose 11.1% MoM from $9,587 at the beginning of the month to $10,373 at the end of September.
Outlook
The near-term outlook for truckload demand remains mixed. Upside potential is supported by holiday inventory flows moving downstream as retailers replenish stock ahead of the shopping season, along with continued strength in domestic factory activity and data center investment. However, downside risks are becoming increasingly likely as persistent inflation and elevated energy prices weigh on consumer sentiment and the broader economic environment. Import activity will remain a key barometer of overall demand health, as high storage and handling costs continue to encourage shippers to maintain lean inventory positions throughout the remainder of the year.