Back to October 2026 Industry Update
October 2026 Industry Update: U.S. Economy
Main Takeaways
- Economic growth remained supported by resilient consumer spending, AI-related investment and continued manufacturing expansion despite growing signs of labor market softening.
- Housing activity continued to drag on freight-sensitive sectors, as construction and residential market indicators remained historically weak.
Summary
Broader U.S. economic indicators have largely been mixed and increasingly overshadowed by concerns over energy prices and supply constraints. The economy continued to expand through the third quarter, driven primarily by significant investments in artificial intelligence, resilient consumer spending — particularly on goods — and further growth in domestic manufacturing activity. However, residential construction and housing metrics remain historically weak and deteriorated further in August. Additionally, the labor market softened in September as payroll growth slowed to just 29,000 added jobs after combined downward revisions of 60,000 jobs to July and August estimates and a modest rise in the unemployment rate to 4.2%.
United States ISM Manufacturing PMI
Key Points
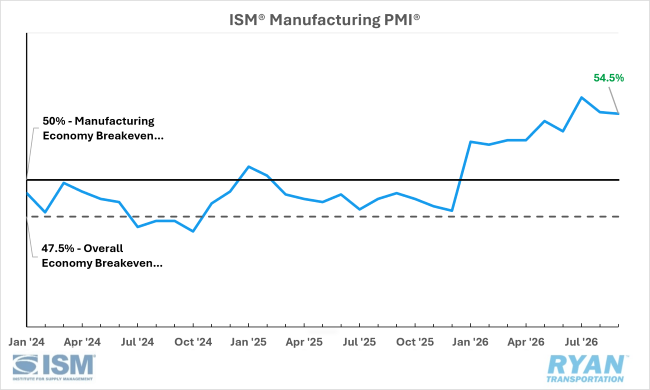
- U.S. factory activity remained in expansion territory in September, but at a slightly slower pace than in August, with the ISM® Manufacturing PMI® registering 54.5%, down just 10 basis points from August’s reading.
- Five of the six largest manufacturing industries expanded in September, in order: Computer & Electronic Products; Food, Beverage & Tobacco Products; Transportation Equipment; Machinery; and Chemical Products.
- In the manufacturing economy, 2% of the sectors’ gross domestic product (GDP) contracted in September, down from 22% in August, while 2% of the manufacturing GDP contracted sharply, the same as in August.
Manufacturing at a Glance
Key Points
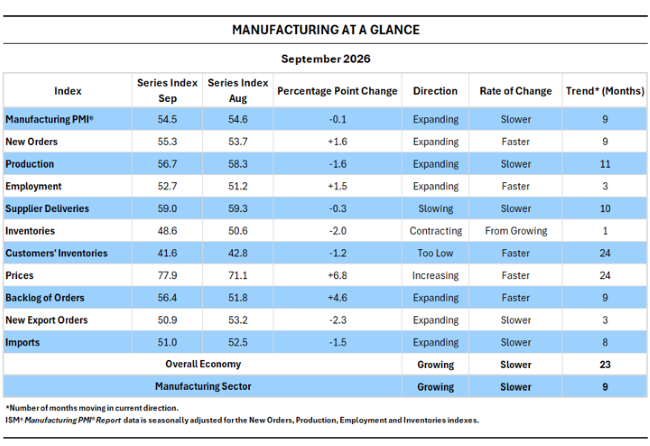
- Four of the five subindexes that directly factor into the Manufacturing PMI® remained in expansion territory in September, while the Inventories Index dropped into contraction territory for the first time in three months. Of those four, only New Orders and Employment grew faster than the previous month.
- Three of the four demand indicators (New Orders, Backlog of Orders and New Export Orders) remained in expansion in September, while the Customers’ Inventories Index remained in “too low” territory and continued to contract at a faster rate, typically a positive for future production.
- Output indicators were mostly positive: the Production Index expanded for the 11th consecutive month, while the Employment Index remained in expansion territory and rose 1.5 percentage points from the August reading.
- Finally, input factors remained mixed: the Supplier Deliveries Index fell 0.3 percentage points, and Inventories fell another 2 percentage points, returning to contraction, while the Prices Index spiked 6.8 percentage points and returned to its levels at the start of the Iran War.
New Residential Construction
Key Points
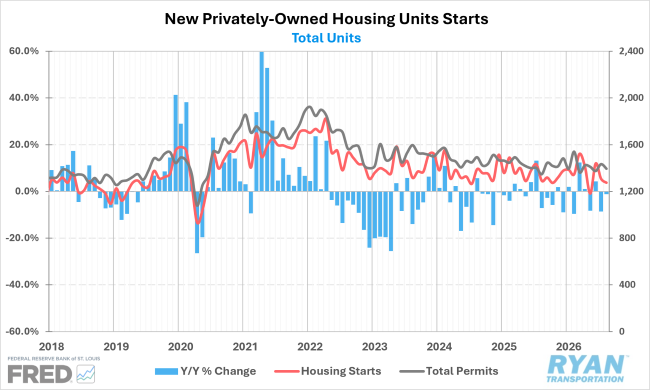
- Housing sector data was complicated, as upward revisions to July estimates pushed total starts down to 2.6% MoM in August on a seasonally adjusted basis, and they remain historically weak, down 1.2% YoY. August's 1.275 million annualized starts marked the lowest level since October last year, apart from May this year.
- The overall decline in housing starts continues to be driven by weakness in multi-family dwellings, which were down 15.5% YoY in August and fell 22.5% MoM after a 14.5% decline in July. Meanwhile, single-family starts rose 7.6% MoM and were up 5.2% YoY.
- Permits authorized for future construction fell 2.7% MoM but rose 3.5% YoY in August, the strongest annual comparison since February.
Bank of America Consumer Checkpoint, Total Card Spending
Key Points
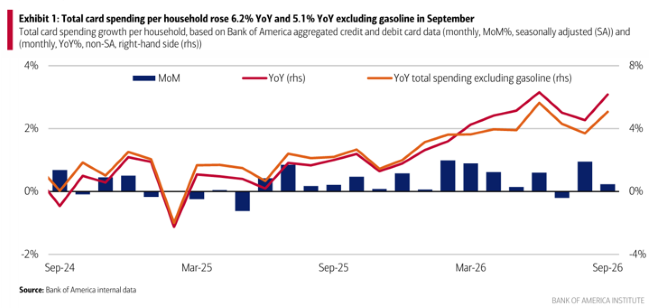
- Seasonally adjusted spending per household remained strong in September, with total aggregated credit and debit spending up 6.2% YoY and spending excluding gasoline up 5.1%, according to Bank of America’s internal spending data.
- Monthly spending was much more muted, rising 0.2% MoM on a seasonally adjusted basis, and was unchanged when excluding gasoline.
- Spending growth across income cohorts continued in September, with lower-income household spending rising 5.5% YoY, compared with 4.9% and 4.8% YoY for middle- and high-income households.
Advanced Retail Trade Sales
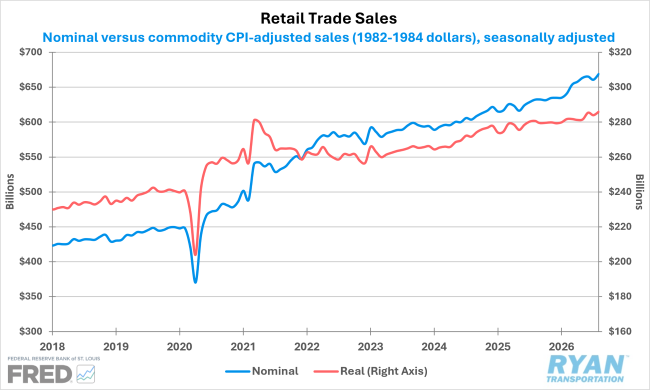
Key Points
- Retail and food service rose 1.2% MoM in August, seasonally adjusted, marking the strongest monthly gain since March, and were up 6.0%.
- Driven by high gas prices, gas station sales led August growth, rising 3.1%. However, total retail and food sales excluding gas stations were only a tenth of a point weaker, indicating that rising fuel prices did not significantly distort the data. On an annual basis, however, higher gas prices distorted the data slightly more, as total retail and food service sales were up just 4.9% YoY.
Outlook
Looking ahead, the economic outlook remains mixed, with several favorable indicators supporting continued growth through the end of 2026, though becoming increasingly dependent on the direction and timing of energy price movements. Some relief may emerge as G7 nations release strategic reserves to ease tight inventories; however, rising demand for distillates from both the fall harvest and the winter heating season is likely to limit that relief. These inflationary pressures, combined with a cooling labor market, will further complicate the Federal Reserve’s policy decisions in its final two meetings of the year. While the Fed’s preferred inflation measure remains above its 2% target, a significant portion of inflationary pressure is being driven by supply-side factors rather than excess demand, suggesting that additional rate increases could prove counterproductive.