Back to May 2026 Industry Update
May 2026 Industry Update: U.S. Economy
Main Takeaways
- Domestic manufacturing activity continued to expand amidst mixed demand, surging input costs and increased pressure on supply chains.
- Consumer spending remains resilient despite higher gas prices, with services spending continuing to dominate spending on goods.
- Residential construction and sales of new homes were positive in March, though the outlook remains weak as future permits softened and mortgage rates moved higher.
Summary
The domestic manufacturing sector remained in expansion territory, supported by moderate gains in new orders and by ongoing supply chain pressures that are lengthening lead times. However, much of the improvement in April appeared to be tied to inventory building, as firms accelerated purchases amid surging raw material costs, supply chain disruptions and concerns over future availability. Rising cost pressures associated with the Middle East conflict, combined with uncertainty surrounding future demand, have also placed additional strain on employment levels and raised questions about the sustainability of the recent momentum.
Other economic indicators released in April were mixed but generally stable. Among the more positive developments was the 2.0% annualized increase in real GDP during Q1 2026, with most major sectors contributing to growth. However, a surge in imports — which act as a drag on GDP — offset a meaningful portion of that strength. Housing indicators were similarly mixed: housing starts rebounded sharply in March after February weakness, while building permits reversed course after strong February gains and contracted substantially in March. Meanwhile, new home sales increased for a second consecutive month after an exceptionally weak January, while existing home sales posted their second-largest monthly decline in more than a year.
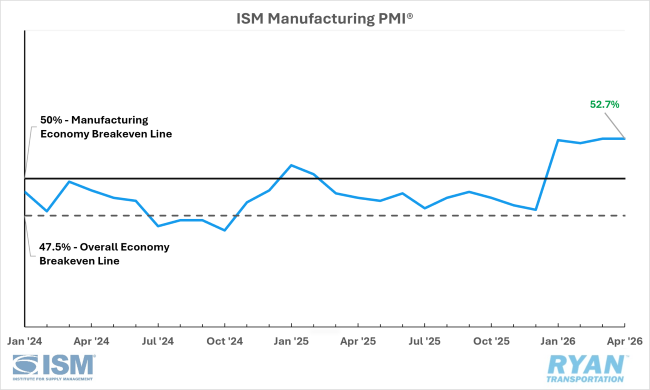
United States ISM Manufacturing PMI
Key Points
- U.S. manufacturing activity expanded for a fourth consecutive month in April, holding steady at 52.7%, though modestly below the median expectation of 53.0%.
- Four of the six largest manufacturing industries — including Transportation Equipment, Machinery, and Computer & Electronic Products — remained in expansion.
- Approximately 19% of manufacturing GDP was in contraction, up from 16% in March, while the share of GDP in strong contraction (PMI ≤45) declined to 2% from 4% MoM.
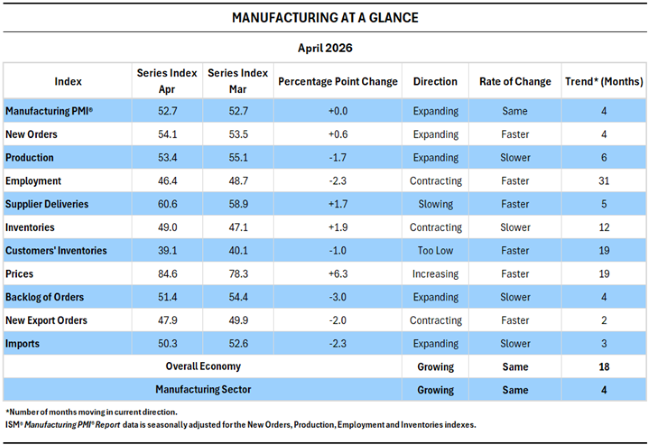
Manufacturing at a Glance
Key Points
- Modest gains in new orders and production, combined with increasing supplier delivery delays, continued to support headline PMI expansion.
- Demand remained uneven, with new orders expanding slightly faster than in March, while customer inventories stayed in “too low” territory, order backlogs weakened, and new export orders contracted further.
- Production growth slowed from March levels, and employment remained subdued as firms continued to rely on layoffs and attrition rather than backfilling positions.
- Input cost pressures intensified further, with the Prices Index rising for a third consecutive month and increasing 25.6 percentage points over the past three months to its highest level in four years.
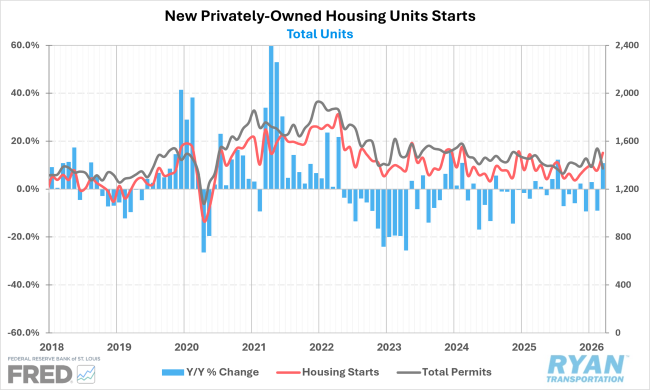
New Residential Construction
Key Points
- Housing starts rebounded sharply in March, rising 10.8% on a seasonally adjusted basis both MoM and YoY, reaching an annualized pace of just over 1.5 million units — the strongest level since late 2024 and well above March 2019 levels.
- Gains were evenly distributed across single‑family and multi‑family construction, with multi‑family starts up 13.5% YoY and single‑family starts up 8.9%.
- Permits for future construction declined 10.8% MoM following February’s 11.0% increase and were down 7.4% YoY, signaling increased uncertainty around the future construction pipeline.
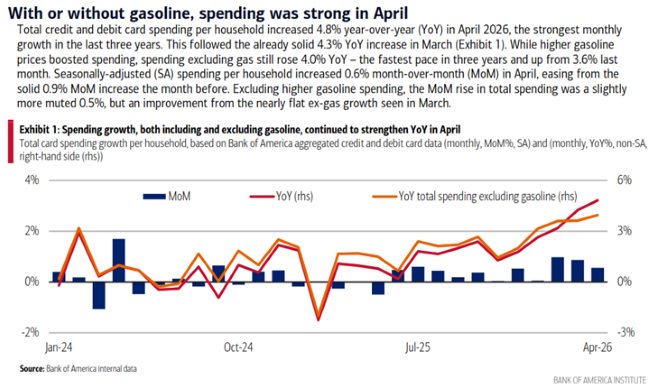
Bank of America Consumer Checkpoint, Total Card Spending
Key Points
- Seasonally adjusted spending per household posted its strongest YoY increase in three years in April, both including and excluding gasoline prices. Discretionary spending continued to contribute more to total card spending growth than essential categories, driven primarily by strength in services — including restaurants — and retail spending excluding gasoline.
- Spending disparities across income cohorts widened further in April, with higher‑income household spending rising 4.9% YoY, compared to increases of 3.1% and 3.6% for lower‑ and middle‑income households, respectively.
Advanced Retail Trade Sales
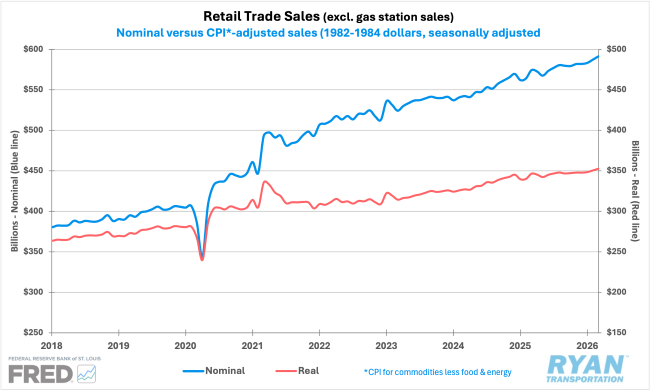
Key Points
- Retail and food service sales increased 1.7% MoM in March — the largest monthly gain since January 2023 — and were up 4.0% YoY.
- Reported gains were heavily influenced by a record 15.5% MoM increase in gasoline sales; excluding gas stations, retail and food service sales rose a more modest 0.6% m/m and 2.9% YoY.
- Retail sales excluding both food services and gasoline increased 0.7% MoM and were 3.0% higher YoY, indicating steady but selective consumer demand.
Outlook
Near-term expectations continue to reflect modest expansion in manufacturing activity, as firms increasingly build inventories to mitigate the risk of future price increases and supply chain disruptions. While real GDP growth remains positive, broader economic momentum is becoming increasingly constrained by elevated input costs, inflation sensitivity and uneven demand across sectors.
Consumers are expected to remain engaged, though more price-conscious, while housing activity is likely to stay mixed amid ongoing financing uncertainty. Overall, the outlook remains stable but fragile, with upside potential limited and downside risks tied primarily to inflationary pressures, energy markets and policy uncertainty.