Back to March 2026 Industry Update
March 2026 Industry Update: Truckload Supply
Main Takeaways
- The for-hire carrier population rose in February as capacity exits declined, while new entrants remained stable.
- Preliminary North American Class 8 truck orders surged in February, a sign that carriers may be anticipating further improvements in freight fundamentals.
Summary
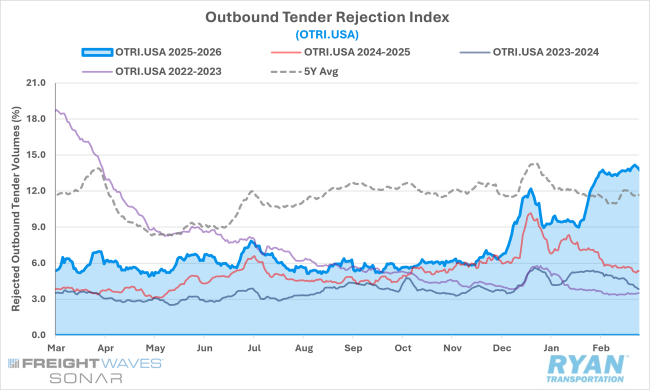
Tender rejection rates remained elevated throughout February following the late-January surge triggered by Winter Storm Fern and subsequent storms along the East Coast, which pushed rejection levels above 13% and to their highest point since early 2022.
While the initial spike was widely attributed to weather-related disruptions, the persistence of elevated rejection rates through the remainder of the month — ultimately exceeding 14% in the final days of February — suggests the storms likely exacerbated or exposed the underlying market vulnerability caused by capacity contractions. This shift in market fundamentals is reinforced by continued strength in equipment orders, with recent ordering patterns pointing to a more structured replacement cycle and forward-looking fleet planning rather than short-term catch-up purchases by carriers.
SONAR Outbound Tender Rejection Index (OTRI.USA)
Key Points
- After experiencing a boost from Winter Storm Fern at the end of January, outbound tender rejections continued to climb throughout February, rising steadily and surpassing 14% in the final days of the month for the first time since March 2022. Compared to February 2025, average tender rejections were 7.8% higher YoY and nearly 9% higher on a two-year stack.
Morgan Stanley Truckload Freight Index
Key Points
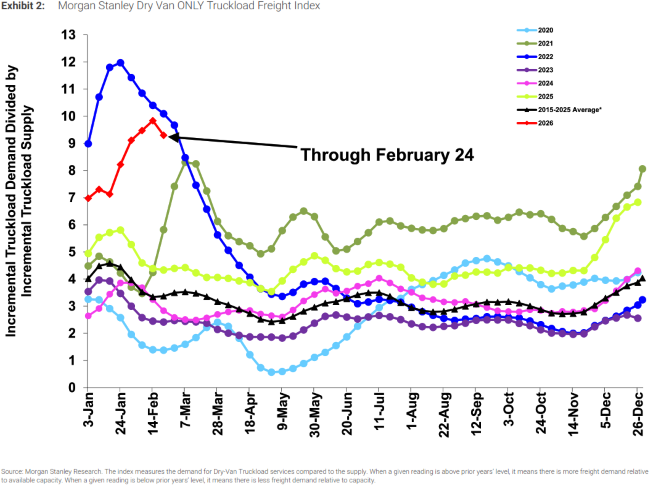
- The pronounced outperformance relative to seasonal expectations recorded by the Morgan Stanley Truckload Index (MSTLFI) in late January persisted into early February, driven by robust performance across both supply and demand components during the first half of the month.
- The index maintained its outperformance trajectory into the second half, albeit at a diminished magnitude relative to the front half, supported by sustained demand strength while supply metrics transitioned to underperformance.
- According to MSTLFI reporting, the refrigerated segment demonstrated alignment with overall index sentiment, outperforming seasonal expectations throughout the month, while the flatbed segment exhibited mixed performance, transitioning from outperformance in the first half to underperformance in the second half.
New Authorities, Net Revocations & Net Change in For-Hire Carrier Population
Key Points
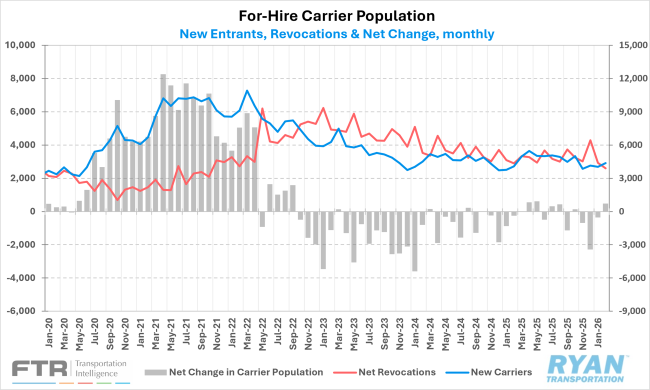
- The for-hire carrier population increased for the first time in four months during February, registering a net addition of 474 carriers — the largest monthly increase since May. According to FTR's preliminary analysis of FMCSA data, net revocations (revocations less reinstatements) declined to 3,899 carriers in February, representing a reduction of 484 carriers and marking the lowest monthly figure since October 2021.
- Concurrently, newly authorized for-hire trucking firms rose approximately 350 carriers to 4,373 in February, the highest quarterly pace in four months; however, this figure remains materially below pandemic-era norms.
Truck Transportation Payroll Employment
Key Points
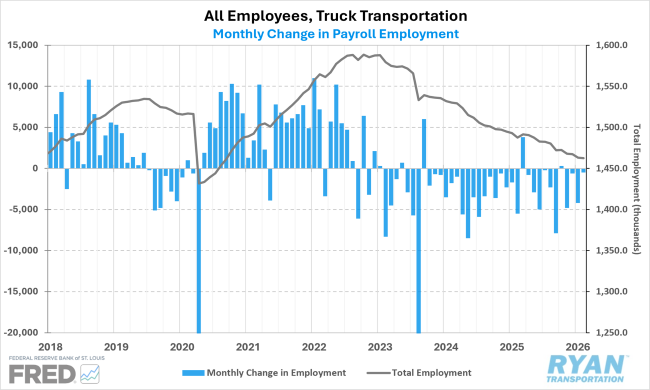
- Seasonally adjusted truck transportation payroll employment declined by 500 jobs in February, according to the Bureau of Labor Statistics. The decline followed slight upward revisions to December and January estimates totaling a net increase of 700 jobs, though January’s sharp drop from December remained largely unchanged. Despite the slower pace of contraction, employment in the sector is still down 4,700 jobs since December and 25,100 jobs from a year ago, reaching its lowest level since September 2020.
Preliminary North American Class 8 Tractor Net Orders
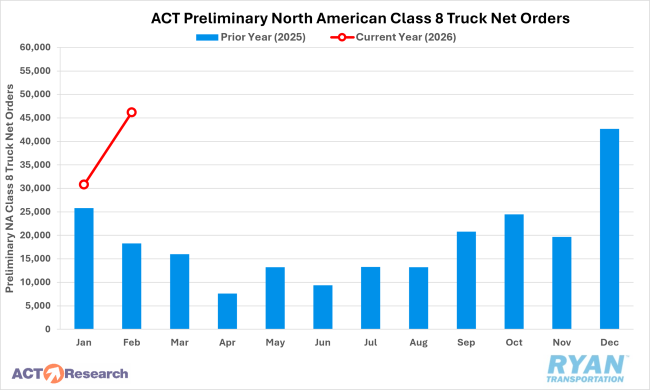
Key Points
- Preliminary North American Class 8 truck orders rebounded sharply in February following declines in January and remained significantly elevated compared to year-ago levels. Initial estimates from ACT Research and FTR indicate that orders rose roughly 45 – 50% sequentially and between 153 – 160% YoY versus February 2025.
- Both firms attributed the surge to stabilizing freight market conditions, improving carrier profitability expectations and fleets accelerating purchases ahead of anticipated cost increases tied to EPA’27 emissions standards.
FTR Active Truck Utilization
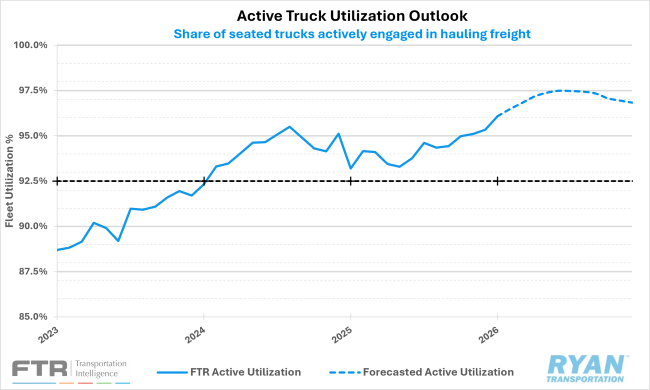
Key Points
- Despite significant downward revisions to trucking employment estimates, FTR’s latest forecast for active truck utilization remains largely unchanged, with utilization still expected to peak between 97% and 98% by mid-year. The only notable adjustment in the updated outlook is a slightly stronger utilization trajectory in the months following the peak.
Outlook
The persistence of elevated tender rejection rates in February, even after weather-related disruptions subsided, suggests the early stages of a longer-term cycle of capacity tightening and upward pressure on rates may be emerging. Some of the continued strength can be attributed to regional divergence, as rejection rates across the 13 key Midwest states — which account for roughly 47% of national truckload volume and have been heavily impacted by winter weather since December — hovered near 19 – 20%, compared to roughly 5% along the West Coast.
Looking ahead, normal seasonal patterns would suggest rejection rates should ease in the coming months ahead of peak domestic produce shipping season, though from a materially higher floor than in recent years. Capacity exits are expected to continue, but the pace has moderated in recent months, potentially reflecting the improvement in spot rates since late last year. Near-term conditions are therefore likely to remain relatively tight, though the supply side remains highly elastic, meaning that without a sustained improvement in demand, any further tightening could be reversed.