Back to March 2026 Industry Update
March 2026 Industry Update: Truckload Demand
Main Takeaways
- Contracted freight volumes rose slightly in February but remain weak compared to previous years, while spot volumes continue to gain considerable market share.
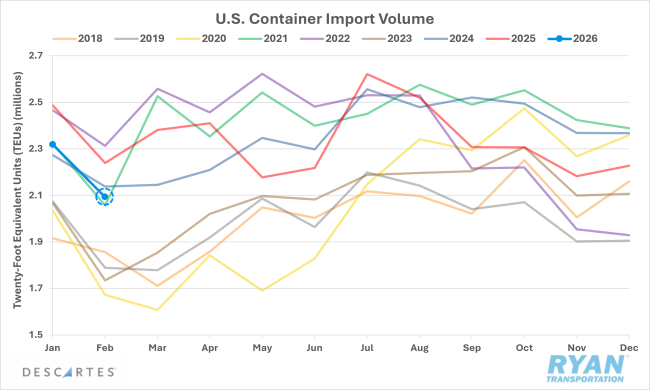
- U.S. containerized imports declined sharply and fell below 2025 levels but continue to trend in line with typical seasonal patterns.
Summary
Freight volumes increased modestly in February compared to January and outperformed typical seasonal trends for what is historically the softest demand month of the year. The improvement was likely driven by stronger manufacturing activity and shipment backlogs created by transit delays after recent winter storms. By equipment type, flatbed demand benefited the most, as increased upstream industrial activity typically leads to higher shipments of bulkier items related to manufacturing and/or construction. Despite the sequential gains, overall freight volumes remain well below levels seen in prior years, indicating that the broader demand environment remains relatively weak.
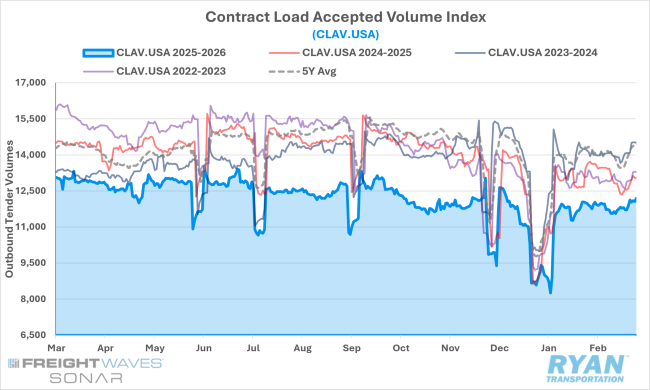
SONAR Contract Load Accepted Volumes Index (CLAV.USA)
Key Points
- Average load tenders accepted under contract in February, as measured by the FreightWaves SONAR CLAV Index, increased 6.8% sequentially from January levels. However, after adjusting for the post-holiday normalization that depressed volumes in early January, the underlying increase was more modest at 0.9% MoM. Despite rising for a second consecutive month, accepted load volumes remained 9.7% below February 2025 levels and 15.9% lower on a two-year stack.
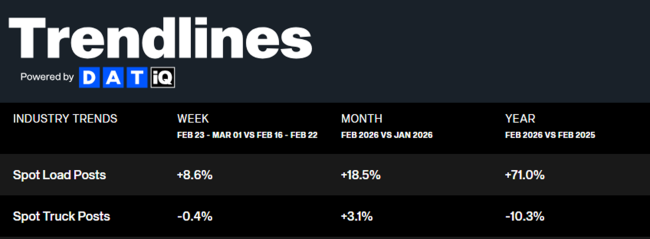
DAT Trendlines
Key Points
- According to load board data from DAT Freight & Analytics, spot market volumes remained resilient in February, increasing 18.5% MoM from January and surging 71% YoY compared to the same month last year. The increase marked the third consecutive month of sequential gains and the 12th out of the last 13 months to register annual growth in spot market volumes.
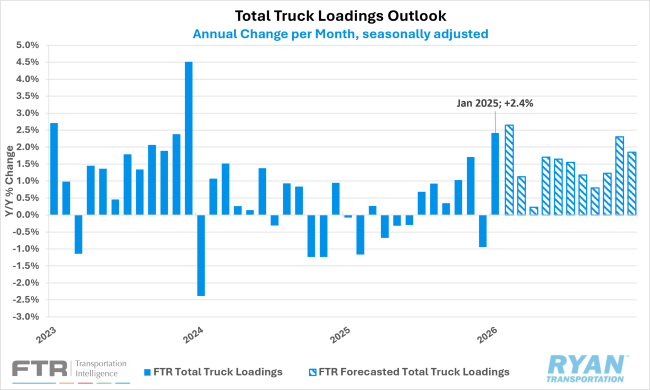
FTR Total Truck Loadings Outlook
Key Points
- FTR modestly revised its 2026 total truck loadings outlook upward to +1.4% YoY growth from the previously forecasted +1.3%. This largely reflects a slight downward revision to 2025 growth, which was lowered from +0.3% YoY to +0.1%. By equipment type, dry van loadings in 2026 are now projected to rise +1.4% YoY (up from +1.3%), while refrigerated and flatbed loadings saw more meaningful upward revisions, with reefer expected to grow +2.8% YoY (previously +2.5%) and flatbed loadings forecast to increase +2.1% (previously +1.7%).
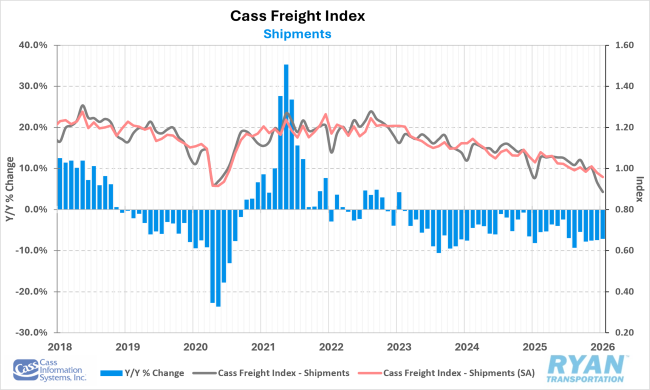
Cass Freight Index Shipments Forecast – February 2026
Key Points
- The shipments component of the Cass Freight Index declined 7.1% YoY in January following a 4.9% MoM decrease, reaching a new cycle low, according to the latest report. Historically, the report notes shipments tend to decline roughly 11% YoY in February, though a rebound following winter weather disruptions could keep volumes from falling to that extent.
Descartes U.S. Container Import Volumes
Key Points
- Total U.S. container import volumes declined 9.7% MoM from January and were down 6.5% YoY compared to February 2025 levels. Despite the sequential and annual declines, volumes followed typical seasonal patterns and remained in line with post-pandemic averages for the month, suggesting underlying demand is relatively stable despite ongoing policy uncertainty.
LMI at a Glance
Key Points
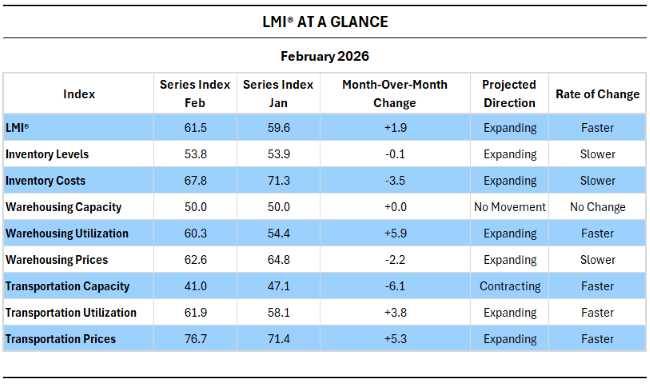
- The Logistics Managers’ Index (LMI®) recorded its fastest rate of expansion in February since the 62.8 reading in February 2025, though under markedly different conditions. Unlike the earlier expansion, driven by inventory buildups ahead of tariffs, February’s growth reflects leaner inventory strategies that are beginning to reinvigorate the index’s transportation metrics. According to the report, all three transportation components posted their strongest movement since the start of the freight recession, with Transportation Utilization reaching its fastest pace of expansion since May 2022 and Transportation Prices climbing to their highest level since March 2022.
Drewry World Container Index
Key Points
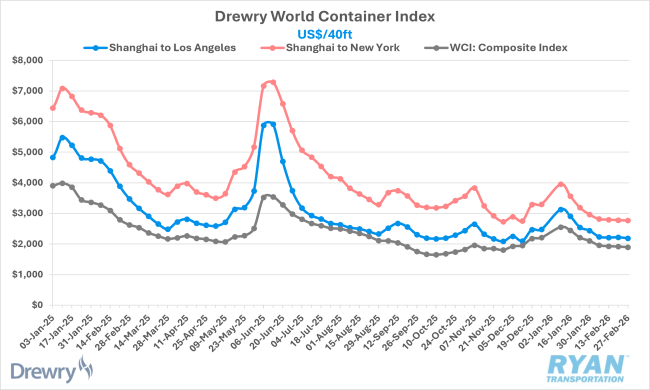
- The Drewry World Container Index (WCI) — a key benchmark for global container shipping that tracks spot rates for 40-foot containers across eight major trade lanes — declined 1% WoW to $1,899 at the end of February and remains roughly 28% below levels recorded during the same week in 2025. Rates on major lanes also weakened, with Shanghai-to-Los Angeles prices falling just over 1% WoW and Shanghai-to-New York declining 0.4%; on an annual basis, those routes are down approximately 37% and 40%, respectively
Outlook
Looking ahead, the demand outlook for 2026 remains highly uncertain, with several variables capable of acting as either upside catalysts or downside risks. The most constructive factors include continued resilience in manufacturing and industrial production, as well as the potential for a near-term increase in imports following the Supreme Court’s ruling limiting the administration’s use of IEEPA tariffs. Additional support could come from higher tax refunds and the possibility of fiscal stimulus ahead of the midterm elections, both of which could help sustain consumer spending. That said, broader economic indicators tied closely to freight demand remain soft, while persistent inflation and a cooling labor market continue to pressure household budgets.