Back to June 2026 Industry Update
June 2026 Industry Update: Truckload Demand
Main Takeaways
- Contract volumes softened slightly while spot activity regained momentum and continued its long streak of annual growth.
- Import volumes and containerized freight strengthened, supporting overall freight demand.
Summary
Demand has largely remained stable over the past few months as the shifts in the market continue to be driven by supply-side factors. Contract volumes softened slightly as spot market volumes continued to regain market share, while both remain stronger than at the same time last year. Imports rebounded after declines in April but remain weaker than 2025 levels, though elevated by historical standards.
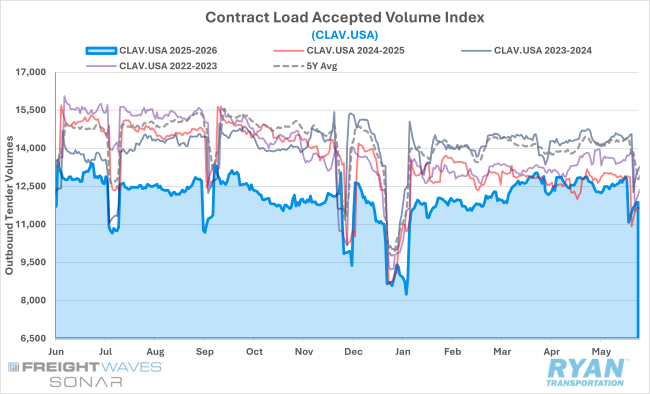
SONAR Contract Load Accepted Volumes Index (CLAV.USA)
Key Points
- Following a four-month streak of sequential gains, accepted contract volumes declined 2.5% MoM in May. Eliminating distortion from the post-holiday slowdown, tender volumes were mostly unchanged, registering a 0.7% MoM decline.
- Annual comparisons turned negative in May after briefly rising in April for the first time since October 2022, as current accepted tender volumes were down 2.3% YoY compared with May 2025 levels.
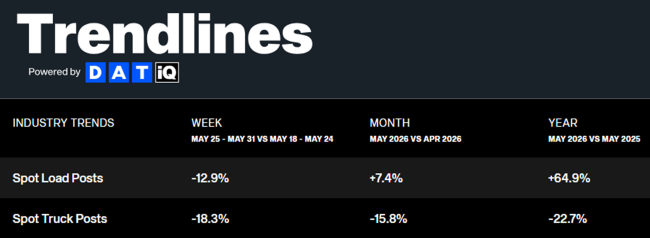
DAT Trendlines
Key Points
- Spot market activity rebounded in May after softening in April, rising 7.4% MoM but continuing a 14-month streak of annual gains.
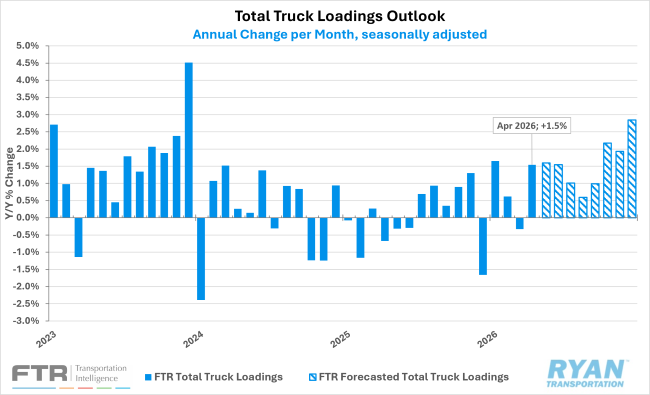
FTR Total Truck Loadings Outlook
Key Points
- A sharply stronger outlook for bulk aggregate loadings led FTR to forecast total truck loadings for 2026 rising by nearly a full point to +1.3% YoY, up from the previously forecast +0.4%.
- The forecast for total truck loadings in 2026 improved across all equipment types, with flatbed loadings revised up to +3.6% YoY from +3.2% previously, driven by strengthening in the dominant building materials group and a large improvement in industrial loadings.
- Stronger automotive loadings led to upward revisions to the dry van outlook, with loadings projected to grow by 1.7% YoY, up from the previous forecast of 1.3%.
- Improvements in food loadings were partially offset by a slight deterioration in major non-food categories, leading to the refrigerated loadings outlook for 2026 rising slightly to +1.8% YoY growth from +1.7% previously.
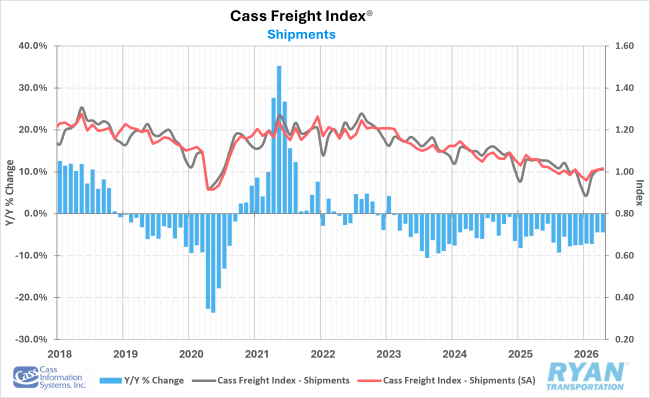
Cass Freight Index Shipments Forecast – April 2026
Key Points
- The shipments component of the Cass Freight Index® fell 4.4% YoY in April but increased 0.4% MoM following sequential monthly gains of 10.4% in February and 3.0% in March.
- Based on the April seasonally adjusted rate, shipment volumes are projected to rise 1.7% YoY in the second half of 2026, further supporting the possibility of a late-year recovery.
- Normal seasonal trends suggest shipment volumes will decline 1% YoY in May.
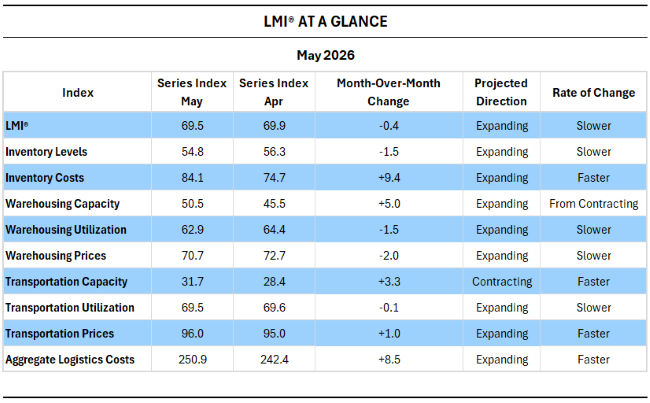
LMI® AT A GLANCE
Key Points
- The LMI® read in at 69.5 in May, down (-0.4) from April’s 69.9 reading, marking the second-fastest level of expansion since March 2022’s 76.2 reading.
- The continued rise in Inventory Costs, which registered its fastest rate of expansion since May 2022, is inextricably linked to the slowing buildup in Inventory Levels and resulted in the largest gap (29.2) between the two metrics in the history of the index. The previous high occurred in November 2021 at the peak of the last freight cycle.
- Per the LMI® report, the buildup of inventories in recent months has largely been driven by upstream firms in the supply chain, such as manufacturers, to get ahead of further increases in fuel prices or potential shortages of critical components. Meanwhile, downstream firms, such as retailers, continue to employ leaner inventory strategies.
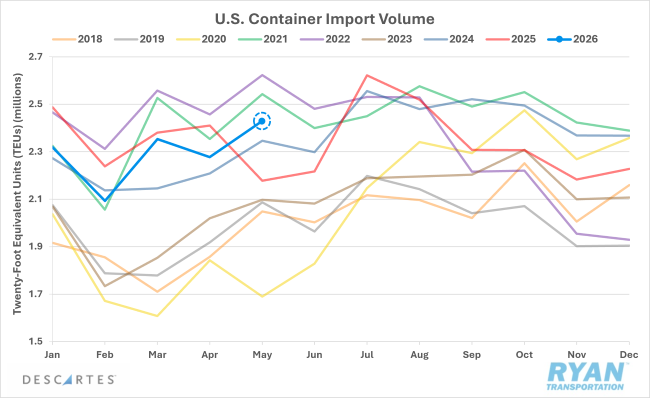
Descartes U.S. Container Import Volumes
Key Points
- U.S. containerized imports rebounded in May, rising 6.6% MoM from April and 11.5% YoY from May 2025.
- May’s monthly gains are in line with typical seasonal growth patterns, though YTD imports remain 1.9% lower than the same time frame in 2025 and 16.4% higher than the same period in 2019.
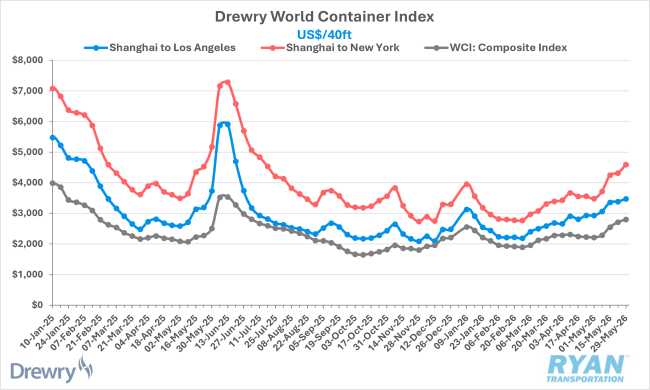
Drewry World Container Index
Key Points
- After declining throughout April, early peak-season demand and cargo frontloading ahead of expected bunker adjustments on July 1 pushed global container rates higher throughout May, ending the month 26.3% higher than where they started.
- Transpacific rates were also notably stronger in May, with Shanghai to Los Angeles rising 18.5% MoM, while Shanghai to New York rates increased 32% MoM.
Outlook
Heading into the summer shipping season, overall freight demand is expected to strengthen in the near term as produce and beverage volumes increase for refrigerated and dry van carriers, while construction activity continues to support flatbed demand. Spot markets are likely to benefit the most from this influx of freight, as already tight capacity conditions are expected to tighten further with the onset of CVSA International Roadcheck, followed by the Memorial Day shipping push. Longer-term demand expectations remain less certain, however, as sustained elevated fuel prices could create inflationary pressures that weaken consumer demand and constrain future manufacturing output.