Back to June 2026 Industry Update
June 2026 Industry Update: U.S. Economy
Main Takeaways
- Manufacturing indicators showed broad based expansion, with multiple subindexes strengthening across major industries.
- Consumer spending and retail activity continued to grow, supported by solid card spending trends and strong nonstore retail performance.
- Housing and construction data remained mixed, with single family softness offset by strength in multi family and permitting activity.
Summary
U.S. factory activity appears to be in a true growth cycle after months of uncertainty, supported by multi-month expansions in key demand gauges and stronger output levels. Some cautionary signals still exist, however, as the ongoing war with Iran has put added pressure on supply chains and continues to drive input prices higher, especially for fuel and oil-related products. Additionally, overall sentiment continued to decline in May, as geopolitical instability and tariff uncertainty remain focal points in negative panelist comments, which continue to make up the largest share of survey responses in both the ISM® and S&P Manufacturing PMI® business survey results.
Despite the continued resilience in industrial activity, the broader economic backdrop remains mixed, reflecting the ongoing bifurcation between hard and soft data. Recent surveys suggest households and businesses remain cautious as consumer confidence softened further amidst inflation pressures, and businesses continue to navigate uncertainty surrounding trade policy and global developments. Meanwhile, the second estimate released by the Bureau of Economic Analysis (BEA) for real GDP growth in Q1 2026 was mostly unchanged from the initial estimate released a month earlier, continuing to reflect a modest annualized rate of 1.6% following a lackluster 0.5% increase in Q4 2025.
United States ISM Manufacturing PMI
Key Points
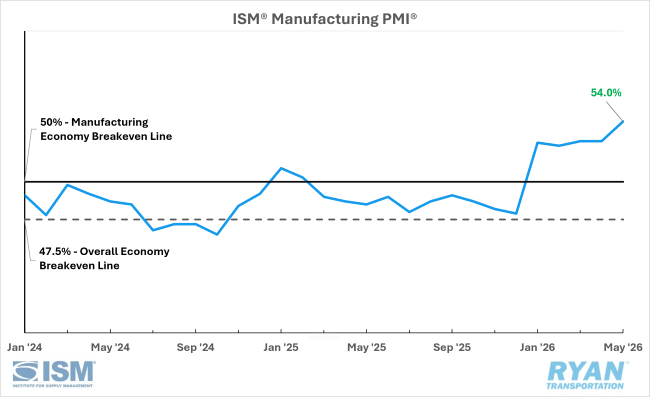
- U.S. manufacturing activity expanded for the fifth straight month in May, at a faster rate than the previous month, with the ISM® Manufacturing PMI® registering 54.0%, up 1.3 percentage points from April and its highest reading since 55.9% in May 2022.
- All six of the largest manufacturing industries registered expansion in May, in the following order: Computer & Electronic Products; Machinery; Transportation Equipment; Petroleum & Coal Products; Chemical Products; and Food, Beverage & Tobacco Products.
- Only 2% of the sector’s GDP was in contraction in May, down from 19% in April, while the share of GDP in strong contraction remained unchanged from April at 2%.
Manufacturing at a Glance
Key Points
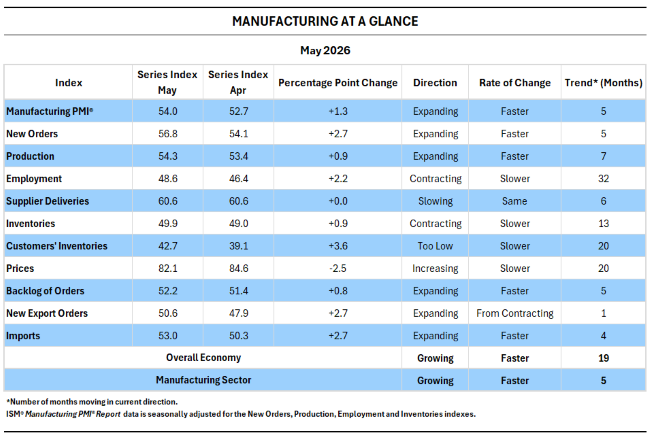
- Of the five subindexes that directly factor into the Manufacturing PMI®, four (New Orders, Production, Employment and Inventories) registered improvement in May from April, while three (New Orders, Production and Supplier Deliveries) remained in expansion territory.
- Overall demand indicators were positive in May, with three of the four (New Orders, Backlog of Orders, and New Export Orders) expanding, while Customers’ Inventories remain in “too low” territory, which is typically considered a positive for future production.
- The output components were mixed as the Production index expanded for the seventh consecutive month, while the Employment index remained in contraction, though at a slower rate than in April.
- Inputs (defined as supplier deliveries, inventories, prices and imports) improved mostly from April, as the Prices index showed slower growth while Supplier Deliveries remained unchanged at their highest level since May 2022 (65.7%).
New Residential Construction
Key Points
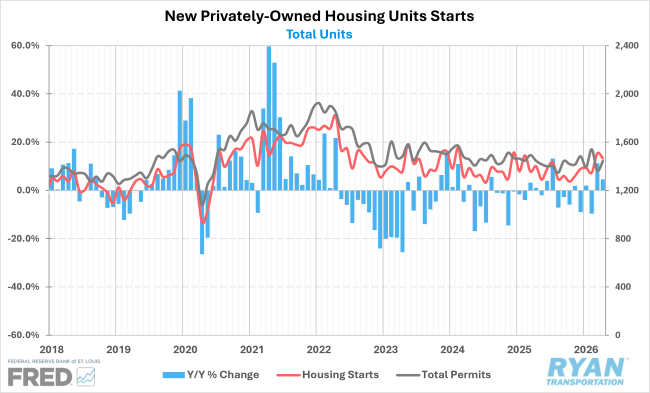
- After a strong increase in March, housing starts softened in April, declining 2.6% MoM, seasonally adjusted, but were still up 4.6% YoY, down from the March comparison but otherwise the strongest since July of last year.
- Starts of single-family homes declined 9.0% MoM and were down 2.4% YoY, while starts for multi-family dwellings of five or more units rose 14.3% MoM and were up 23.3% YoY compared to April 2025.
- Permits authorized for future construction increased 5.8% MoM in April following a sharp contraction in March, but were down slightly by 0.2% YoY.
Bank of America Consumer Checkpoint, Total Card Spending
Key Points
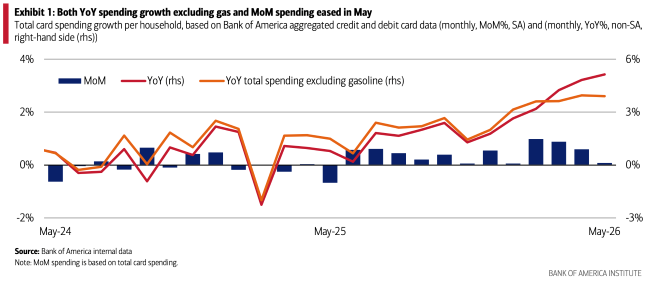
- Consumer spending remained resilient in May as total aggregate credit and debit card spending per household increased 5.1% YoY — the largest gain in nearly four years — following the 4.8% YoY increase in April, but was up just 0.1% MoM on a seasonally adjusted basis.
- Though higher spending on gasoline was a significant contributor to this strength, total spending excluding gas was still up 3.9% YoY, slightly weaker than April’s growth of 4.0%.
- The spending gap between income cohorts narrowed in May to its lowest level since June 2025, with total card spending for lower- and middle-income households increasing 4.1% and 4.3% YoY, respectively, compared to the 5.4% YoY growth recorded by higher-income households.
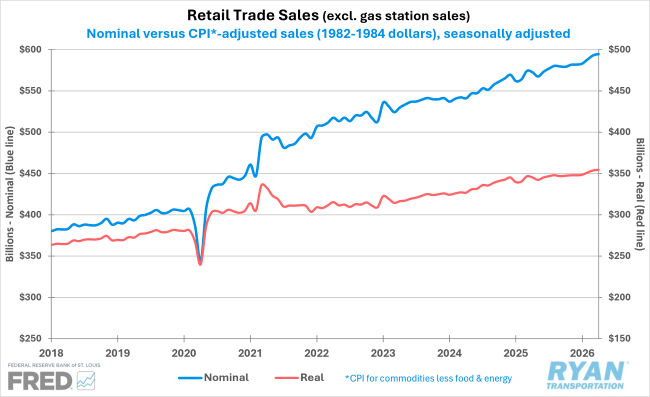
Advanced Retail Trade Sales
Key Points
- Total retail and services sales rose 0.5% MoM on a seasonally adjusted basis in April and were up 4.9% YoY.
- When excluding gasoline station sales, which rose 2.8% MoM in April following a 13.7% surge in March, total sales ticked up just 0.3% MoM.
- Sales for nonstore retailers posted the largest increase in April, rising 1.1% MoM and 11.1% YoY. This increase, combined with a slight decline in sales for motor vehicles and parts dealers, resulted in a gap of less than $1.7 billion between the two sectors, setting up nonstore retailers to potentially surpass motor vehicles and parts as the largest retail sector for the first time ever
Outlook
Looking ahead, the near-term outlook has become much less certain as rising inflation levels pose a significant threat to the continued resilience of the manufacturing sector and broader economic growth. Consumer spending is expected to remain stable, though household budgets remain under pressure as savings rates have declined sharply, credit card balances are at their highest levels on record and delinquencies are reaching their highest levels since the period following the 2008 financial crisis. While the housing market continues to crawl along the floor, data center construction is expected to keep driving growth for the economy and the freight industry.