Back to August 2026 Industry Update
August 2026 Industry Update: Truckload Demand
Main Takeaways
- Freight demand eased in July as both contracted and spot market volumes declined from June's elevated levels, though activity remains generally stronger than last year's freight recession environment.
- Strong import volumes, healthy inventory conditions and a positive manufacturing backdrop continue to support expectations for modest truckload demand growth through year-end.
Summary
Truckload demand moderated in July following exceptionally strong freight activity during June, which SONAR described as the strongest shipping month since the pandemic. Contract tender volumes, spot market activity and freight shipment indicators softened sequentially as the market moved beyond the traditional early-summer peak. Still, underlying demand remains supported by manufacturing expansion, resilient consumer spending and healthy import volumes. Intermodal and container activity also continues to run well above typical seasonal patterns, indicating that goods movement remains active throughout supply chains. Despite the recent cooling, freight fundamentals continue to point toward modest truckload volume growth through the remainder of 2026.
SONAR Contract Load Accepted Volumes Index (CLAV.USA)
Key Points
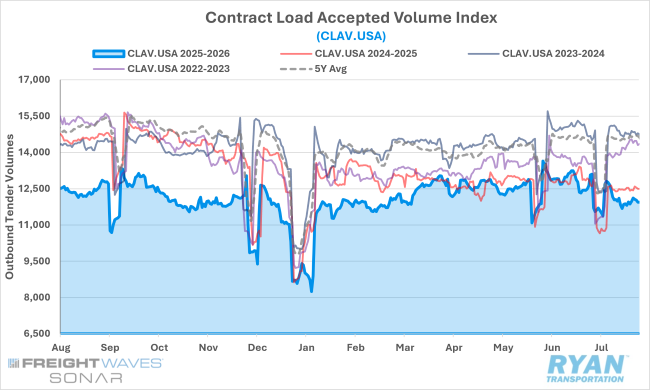
- Following a strong rebound in June after dipping in May, tender volumes accepted under contracted agreements declined in July, dropping 6.4% MoM. Removing post-Fourth of July holiday distortion, accepted tender volumes saw little change, registering 6.2% lower MoM.
- Annual comparisons remained negative for the third straight month in July, registering 0.5% lower YoY compared to July 2025.
DAT Trendlines
Key Points
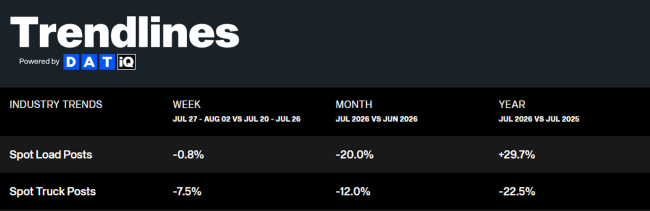
- Spot market activity softened in July compared to June but continues to trend above year-ago levels, marking 16 straight months.
FTR Total Truck Loadings Outlook
Key Points
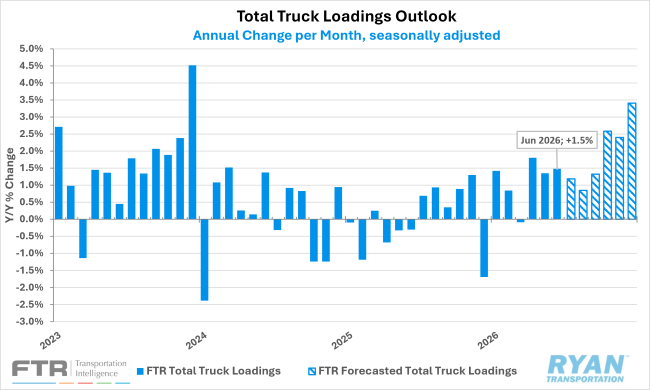
- In its latest forecast, FTR’s total truck loadings in 2026 remained unchanged at +1.5% YoY growth, as a strong van outlook offset notably weaker bulk aggregate loadings.
- Across the major equipment types, loading outlooks were relatively mixed: dry van loadings were revised up to +1.6% YoY growth from the previous forecast of +1.3%, while flatbed loadings remained unchanged at +3.7% YoY, and refrigerated loadings were slightly weaker by 0.1%, dropping to +1.8% YoY.
Cass Freight Index Shipments Forecast – June 2026
Key Points
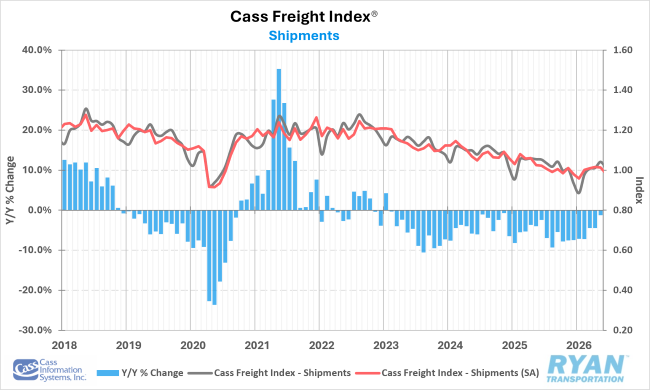
- The shipments component of the Cass Freight Index® fell 3.1% MoM in June and was down 4.1% YoY.
- Seasonally adjusted (SA), shipments in June fell 2.9% MoM, reversing most of the year-to-date gains observed so far this year.
- According to the Cass report, the normal seasonal trend would put the shipments components down roughly 3% YoY in July.
LMI® AT A GLANCE
Key Points
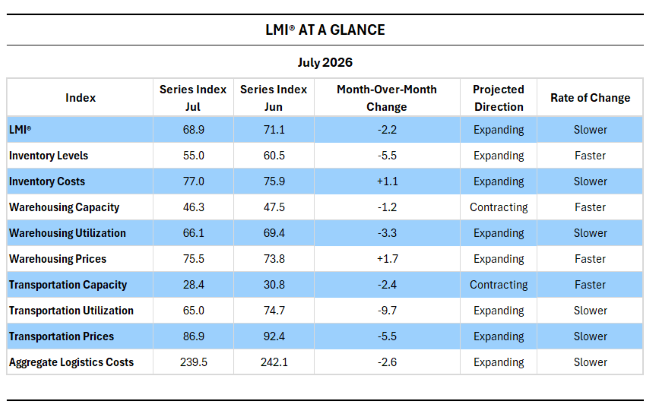
- The LMI® read in at 68.9 in July, down (-2.2) from June’s reading of 71.1, which had been the fastest rate of expansion since March 2022, and remains well above the all-time average of 61.7.
- The slowdown in expansion in July was a result of slower Inventory Level growth (-5.5 to 55.0), while the continued expansion in the overall index continues to be primarily driven by the robust growth across cost metrics, with July differing from June in that those higher costs are associated with considerably slower expansion in Inventory Levels.
- Per the LMI® report, the slowdown in Inventory Level expansion was driven by Downstream retailers in July, while their Upstream counterparts continued to reflect consistent levels of expansion between June and July, indicating some of the surge in imports in June was due to retailers trying to stay ahead of potential tariff increases set to take place in July.
Descartes U.S. Container Import Volumes
Key Points
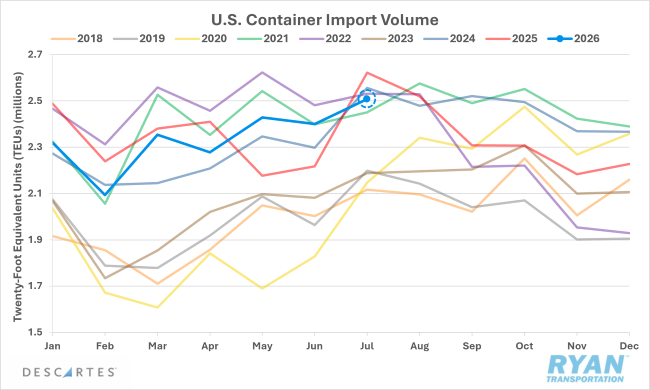
- U.S. containerized imports rebounded in July, increasing by 4.5% MoM from June, and were 4.3% below the record set in July 2025, narrowly missing the overall record set in May 2022.
- Through the first seven months of 2026, containerized imports are down just 0.9% YoY compared to the same time last year but remain well above pre-pandemic levels.
- The strength in imports in July suggests seasonal demand remains resilient, even as the broader trade environment remains uncertain, with elevated risks in the Strait of Hormuz, shifting trade policy and disruptions in the Red Sea influencing freight costs, routing decisions, and sourcing strategies.
Drewry World Container Index
Key Points
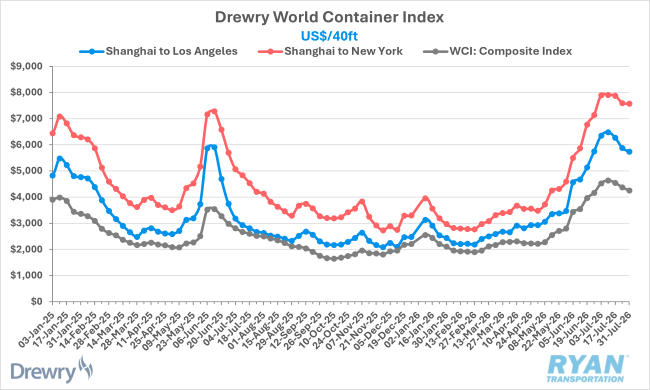
- After rising sharply in June, the Drewry World Container Index (WCI) softened throughout much of July, registering consecutive declines in the last three weeks due to weaker demand and slower front-loading activity, ending the month 6.1% lower MoM than where it started but still over 70% higher YoY than July 2025.
- The decline in the WCI was driven primarily by lower spot rates on the Transpacific trade lanes, with Shanghai to Los Angeles falling 9.6% MoM but still 118.0% higher YoY, while Shanghai to New York fell 4.1% MoM but is up 83.3% YoY.
Outlook
Truckload demand is expected to remain constructive through year-end, although growth is likely to normalize after the unusually strong early-summer freight surge. Manufacturing activity, inventory replenishment efforts and continued import flows should support freight volumes, while dry van demand forecasts have improved modestly in recent months. Seasonal softness is likely through late summer, but most indicators suggest freight volumes are stabilizing at levels well above those seen during the freight recession. Barring a significant deterioration in consumer spending or trade activity, demand should remain supportive of a healthy freight environment through the second half of the year.