Back to April 2026 Industry Update
April 2026 Industry Update: Truckload Supply
Main Takeaways
- First quarter for-hire authority revocations registered their lowest quarterly total since Q4 2021, as the carrier population registered moderately higher by 430 carriers.
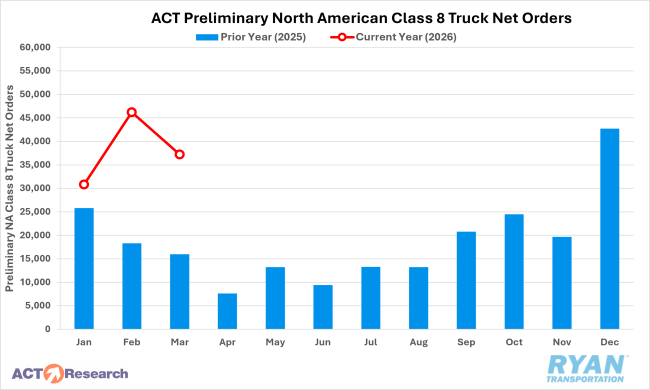
- Despite declining from their February highs, preliminary North American Class 8 truck orders remain considerably higher than 2025 levels, further indicating improving freight fundamentals
Summary
Tender rejections have not retreated from the elevated levels observed following the late-January winter storm disruptions and instead continued to increase throughout March, further highlighting the cumulative impact of capacity contraction over the past several years. While carrier exits have shown signs of stabilizing in recent months, truckload employment has continued to decline, falling to its lowest level since September 2020 and the lowest level since November 2017 if the era of pandemic distortions is excluded. These trends point to a tightening supply environment that is becoming more pronounced as demand begins to recover.
The evolving market dynamics are further reinforced by strength in equipment orders, which suggest a shift toward more disciplined fleet management. Current order patterns indicate a structured replacement cycle and longer-term fleet planning, rather than reactive, short-term capacity additions, supporting the view that supply growth will remain measured in the near term.
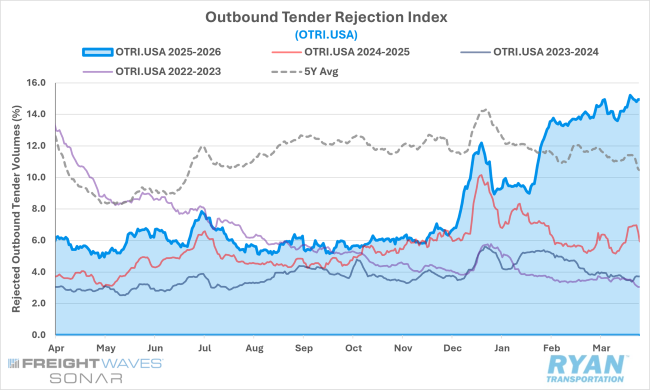
SONAR Outbound Tender Rejection Index (OTRI.USA)
Key Points
- Following a series of winter storm disruptions in February that drove the largest month‑over‑month increase since August 2020, average tender rejections advanced further in March, rising 81 basis points to 14.4%. As a result, rejection rates reached their highest annual comparison since June 2021 at 8.4% YoY and are up 10.6% on a two-year stack basis.
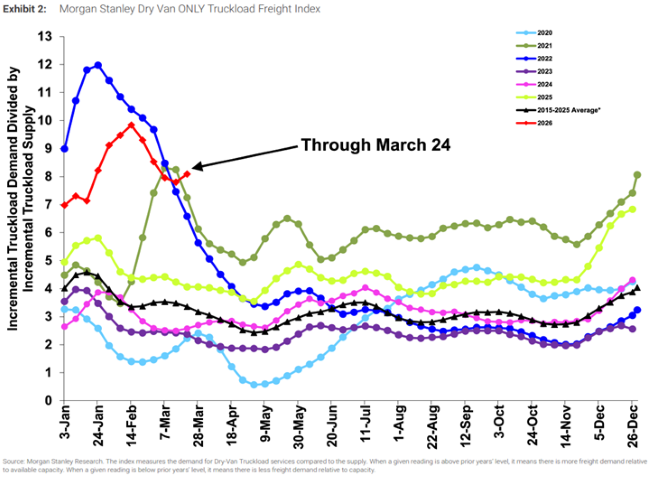
Morgan Stanley Truckload Freight Index
Key Points
- The Morgan Stanley Truckload Freight Index was mixed in March, with sequential declines in the first half of the month that underperformed typical seasonality due to softness in both the supply and demand components.
- The index reversed course in the second half of March, registering sequential gains and returning to seasonal outperformance as both components aligned more closely with historical norms.
- Reefer and flatbed indices followed a similar pattern — underperforming early in the month before strengthening in the latter half.
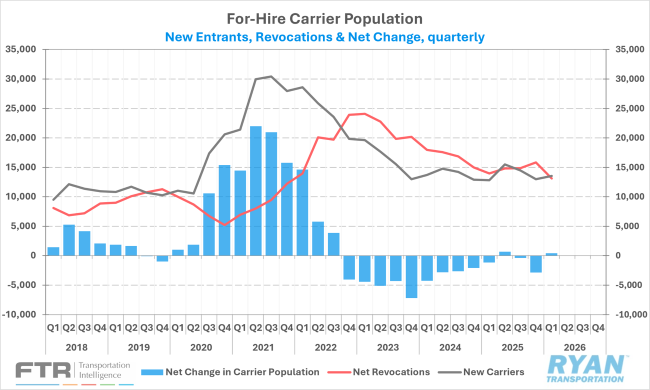
New Authorities, Net Revocations & Net Change in For-Hire Carrier Population
Key Points
- New carrier entrants exceeded exits for a second consecutive month in March, resulting in a net expansion of 315 carriers within the for‑hire population.
- According to preliminary Federal Motor Carrier Safety Administration data, net revocations less reinstatements rose sharply by nearly 950 carriers to 4,843 — primarily due to a calendar-related timing effect — following February’s lowest level since October 2021, while newly authorized carriers increased by approximately 800 MoM to 5,158.
- On a quarterly basis, the carrier population expanded by 430 carriers in Q1 2026, marking only the second quarterly increase since Q3 2022, as net revocations (net of reinstatements) recorded their lowest quarterly total since Q4 2021.
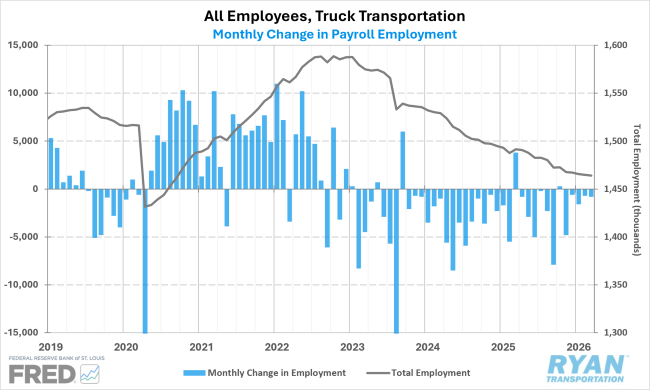
Truck Transportation Payroll Employment
Key Points
- Seasonally adjusted truck transportation payroll employment eased by 800 jobs in March, according to the Bureau of Labor Statistics, following upward revisions to prior months, with January revised up by 2,600 jobs and February by 2,400 jobs.
- Truck transportation employment now stands 3.5% below pre-pandemic levels in February 2020, while more detailed data through February indicate a continued decline in general freight truckload employment, which has fallen to its lowest level since February 2014.
Preliminary North American Class 8 Tractor Net Orders
Key Points
- Despite pulling back from record February highs, preliminary North American Class 8 truck orders continued to post substantial year‑over‑year growth in March, according to estimates from FTR Transportation Intelligence and ACT Research.
- Orders moved lower approximately 19 – 20% MoM but remained significantly elevated relative to 2025 levels, with estimates ranging from 133% to 137% higher YoY.
- While both firms noted that, although some of the recent strength likely reflects deferred replacement demand, the sustained momentum over the past four months increasingly points to improving underlying freight fundamentals.
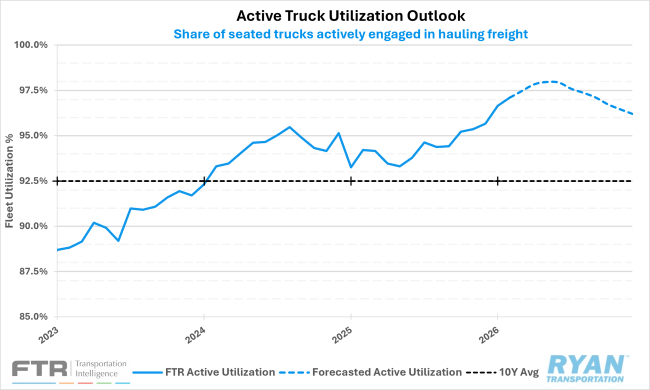
FTR Active Truck Utilization
Key Points
- FTR Transportation Intelligence modestly increased its near-term outlook for active truck utilization in 2026, with projections rising by approximately 0.5 percentage points and utilization expected to peak near 98% as early as May.
- However, concurrent revisions to a softer freight volume outlook, combined with expectations for incremental capacity growth, are anticipated to result in a more rapid deterioration in utilization beginning in Q3 2026 than previously forecast.
Outlook
The sustained increase in tender rejection rates, with no meaningful divergence in recent months, reinforces the view that transportation markets are in a longer-term capacity-tightening cycle, placing structural upward pressure on rates beyond typical seasonal demand fluctuations.
However, a portion of the current strength can be attributed to widening regional disparities, with rejection rates in the Midwest holding near 20% over the past two months, while the West Coast has remained notably lower in the 5 – 10% range over the same period.
Looking ahead, while historical seasonality would suggest some softening in April, near-term rejection rates are expected to remain firm relative to historical averages, with the potential for accelerated volatility as produce volumes enter the market and the manufacturing recovery continues. At the same time, capacity contractions are likely to moderate and may begin to reverse later in the year as carriers look to return to the market to capitalize on higher rates, ultimately contributing to a gradual normalization in tender rejections.