
Executive Summary
Not all news was good news in October, however. Manufacturing activity slowed and now the labor market, once the bedrock that propped up the economy, appears to be on unstable ground. Payroll growth was much weaker in October after initial strong gain estimates reported the month prior. Despite downward revisions to September’s reading, job growth in October was still only half of those revised figures. According to the recent NRF Retail Monitor report, which analyzes over nine billion credit and debit card transactions totaling more than $500 billion in annual spending, retail spending declined modestly in October by 0.03% MoM on a seasonally adjusted basis but was up 2.63% YoY.
For the truckload industry, the market remains in the late stages of cycle bottoming in the traditional truckload cycle. Demand levels have stabilized as supply continues to contract through increasing net fleet exits. Though the demand outlook through the next two quarters remains soft, capacity continues to be added to the oversupplied market, as Class 8 orders remain strong. Although significant progress has been made, further expansion of private fleets will continue pushing out the timeline of the market rebalancing, which we anticipate should reach an equilibrium in Q2 2024.
Main Takeaways
- Manufacturing activity in the U.S. contracted at a faster rate in October than in September and was driven by a decline in new orders and employment.
- Spot and contract rates were virtually flat in October but moved in opposite directions, widening the contract-to-spot spread further.
- Truckload demand levels remained stable in October while intermodal volumes continued to grow slowly.
- Following a surge in the first week of the month, rejection rates declined in October as supply continues to contract slowly.
- The for-hire truckload population declined in October as revocations continue to outpace new entrants.
- Monthly average fuel prices registered their first MoM decline after three consecutive months of gains.
Economy | Spot Rates | Truckload Demand | Truckload Supply | Fuel Prices | Dry Van Overview | Reefer Overview | Flatbed Overview | Intermodal
Economy
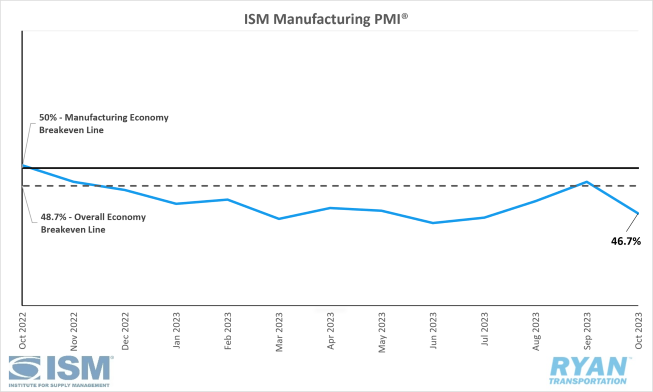
United States ISM Manufacturing PMI
Key Points
- The Institute for Supply Management (ISM) Manufacturing PMI® registered 46.7% in October, 2.3% lower than the 49.0% recorded in September.
- The New Orders Index recorded a 3.7% drop, down from 49.2% in September to 45.5% in October, moving further into contraction territory.
- The Production Index registered 50.4% in October, down 2.1% from the 52.5% reading in September.
- The Employment Index moved into contraction in October, registering 4.4% lower from the 51.2% recorded in September to 46.8%.
Summary
Manufacturing activity in the U.S. contracted for the second consecutive month in October, with the Institute for Supply Management's (ISM) Manufacturing PMI® registering a decline of 2.3% compared to September's reading. This contraction reflects ongoing order softness as businesses adjust inventory levels to align with current demand trends. The overall economy also returned to contraction territory, with the ISM PMI® registering below the 48.7% breakeven level.
The demand components of the PMI measured by the New Orders, Backlog of Orders and Customers’ Inventories indices eased further in October. The New Orders Index, a key indicator for future demand, contracted at a faster pace in October as customers’ inventories reached “about right” territory. The Backlog of Orders Index registered 42.2% in October, a 0.2% decrease from September’s reading of 42.4%. As new order levels continued to soften in October, companies were able to work through backlogs quicker, sending the index further into strong contraction territory.
The output and consumption components of the ISM PMI®, measured by the Production and Employment indices, combined for a 6.5% negative impact on the PMI® calculation, according to the ISM report. Companies have adjusted production output to maintain stable MoM levels and taken more immediate actions to reduce headcount, primarily through layoffs.
The input components of the diffusion index, measured by inventories, prices and supplier deliveries continued to accommodate future demand growth. The Supplier Deliveries Index indicated deliveries remain fast for the 13th straight month, however slightly slower compared to September. The Prices Index registered further decreases in October as well, indicating overall price discounts continue despite turbulence in the energy market last month.
Why It Matters
The positive momentum gained in September, which led to the overall economy returning to expansion territory after nine months in contraction, was snuffed out by the latest reading in October. The 2.3% MoM decline reported in the ISM Manufacturing PMI® has led many to believe that any sort of recovery within the manufacturing sector will be gradual at best. Based on the latest report, current forecasts project the manufacturing PMI® in the range of 48% to 52% through the first half of 2024.
Soft demand levels continue to hamper any real return to growth within the sector and are likely to remain deflated through the next few quarters. Customers’ inventories moving back to just the right level has negative implications for both future demand and production levels. Higher interest rates have been a major headwind for companies, forcing manufacturers to reduce headcounts via layoffs in an effort to become leaner in the midst of uncertainties surrounding future demand trends. Tim Fiore, Chair of the ISM’s Manufacturing Business Survey Committee, expects the current cycle to drop readings in the first half of 2024 below what has been experienced in the second half of 2023, with real recovery not happening until the second half of next year.
Of the six biggest manufacturing industries (Computer & Electronic Parts; Chemical Products; Transportation Equipment; Food, Beverage & Tobacco Products; Machinery; and Petroleum & Coal Products), Food, Beverage & Tobacco Products was the only industry to register growth in October.
Macro Impacts
- Total nonfarm payroll rose by 150,000 in October and came in below the 180,000 consensus estimate, according to preliminary estimates from the Bureau of Labor Statistics (BLS).
- Initial September estimates were revised downward from 336,000 added jobs to 297,000.
- The unemployment rate rose slightly by 0.1% from 3.8% in September to 3.9% in October.
- Total Transportation and Warehousing employment declined by 12,100 jobs with Truck Transportation decreasing by 5,000 jobs.
- In its most recent meeting, the Federal Reserve kept the federal funds rate at its current level of 5.25%-5.50%.
- For the second straight meeting and the third time this year, the Federal Reserve paused rate hikes in its battle against taming inflation.
- While the pause was expected, the Fed left the door open for further future rate hikes in order to achieve its 2% inflation target.
- According to the CME FedWatch Tool, at the time of this writing, the current consensus lists the probability of the target rate remaining at current levels at 85.7% during the next and final Fed meeting of 2023.
- Headline CPI was flat MoM in October while core CPI, which excludes food and energy, rose 0.2% MoM on a seasonally adjusted basis, according to the most recent report released by the Bureau of Labor Statistics (BLS).
- On an annual basis, the all-items index was up 3.2% in October while the all items less food and energy rose 4.0% seasonally adjusted, according to the report.
- Shelter continues to account for 70% of the increase in core prices and offsets the 5% decline in gasoline prices in October.
- Both annual headline and Core CPI came in under expectations of 3.3% and 4.1% respectively.
- The Personal Consumption Expenditures (PCE) Price Index, the Fed’s preferred gauge for measuring inflation, was up 0.4% MoM while core PCE registered a 0.3% increase in September, according to the Bureau of Economic Analysis (BEA).
- Real PCE registered a 3.4% increase over the last 12 months ending in September while core PCE was up 3.7%.
Industry Overview
October Key Figures (YoY)
| Truck Data Points | YoY Percentage (%) Change |
|---|---|
| DAT Spot Rates (incl. FSC) | -13.2 q |
| Fuel Prices | -13.5 q |
| ACT Class 8 Preliminary Orders | -24.9 q |
| ATA NSA Truck Tonnage* | -5.5 q |
| Cass Freight Index | -8.3 q |
| Cass Freight Shipments | -9.5 q |
| Cass Freight Expenditures | -23.3 q |
* Report released 10/24/2023
Spot Rates
Key Points
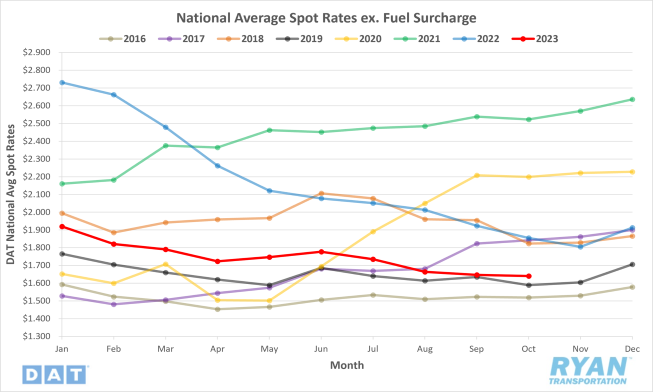
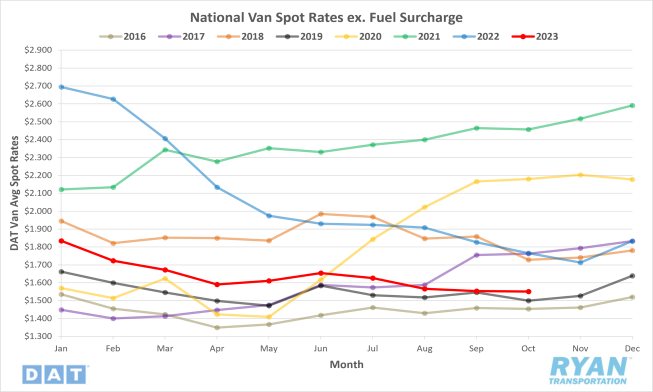
- The national average spot rate excl. fuel surcharge fell for the fourth consecutive month in October, dropping $0.007, or 0.4%, from September.
- National average linehaul rates are down 11.5%, or $0.214, compared to the same time last year and sit 17.9% below the 5-year average.
Contract Rates

Key Points
- After nine straight months of declines, the national average contract rate excl. fuel surcharge increased $0.016, or 0.8%, in October.
- Contract linehaul rates remained well below last year’s levels, registering 13.0% below the average in October 2022.
- Following downward revisions to September’s data, the contract-to-spot spread increased $0.023 in October to $0.530 from $0.507.
Summary
National spot rates excluding fuel continued their downward trend in October, albeit at a more moderate pace than in the previous three months. The average spot rate declined by just under a penny per mile, approaching pandemic-era levels. Following a slight uptick in the first week of October, the 7-day average linehaul spot rate exhibited consistent week-over-week declines throughout the month, ending approximately $0.05 lower than the starting point. By the final week of October, the 7-day average spot rate excluding fuel had fallen by $0.456 since the beginning of the year, reaching its lowest level in over three years.
Despite the continued weakening of spot market conditions, the national average contract rate excluding fuel managed to snap its nine-month streak of consecutive declines in October, increasing by just over a penny per mile. Prior to October, contract rates excluding fuel had registered declines in 18 of the last 20 months. Due to the inherent delay in contract rate data reporting, September's figure was revised downward, causing the initially reported contract-to-spot spread to narrow from $0.530 to $0.507. Based on the preliminary data reported for October at the time of this writing, the month-over-month increase in contract linehaul rates, while spot linehaul rates continued to decrease, has widened the contract-to-spot spread back up to $0.530. Both the revised September figure and October figure remain significantly elevated compared to the pre-pandemic average of $0.35-$0.45.
Why It Matters
The MoM decline in spot rates was in-line with typical seasonality in October, so it didn’t come as a complete surprise. Unlike the months on either side of it, October lacks any major holiday disruptions that create positive pressure on rates. Compared to the pre-pandemic years, the 0.4% MoM drop in spot rates registered this year in October was well below the 2.2% average decline for the same time period prior to 2020.
Monthly declines in linehaul spot rates have started to flatten out over the last three months, carrying positive implications that spot rates could have finally reached a bottom. As seasonality would suggest heading into the final two months of the year, multiple holiday disruptions and seasonal demand surges should result in some upward momentum for rates through the end of the year.
Despite considerable negative pressure from declining spot market conditions, contract rates have remained relatively stable over the past few months. Traditionally, October has marked the start of the annual bid season for the majority of customers looking to refresh rates in the coming year. While many customers still adhere to this practice, the volatility of the truckload market over the last three years has exposed vulnerabilities in operating under fixed rates for the full year. This has led many shippers and customers to adopt more dynamic pricing by moving to quarterly or bi-annual RFP processes in order to capture shifting market conditions. Implementation of “mini bids” has gained further momentum over the last two years as customers have looked to capitalize on savings from the declining market conditions.
The recent stabilization and increase, albeit minimal, could be a byproduct of the shorter bid contracts heading into peak holiday shipping season. Given the significant disparity between contract and spot market rates though, the stability in contract pricing should likely be temporary as contract rates still have a good amount of room to fall.
Truckload Demand
Key Points
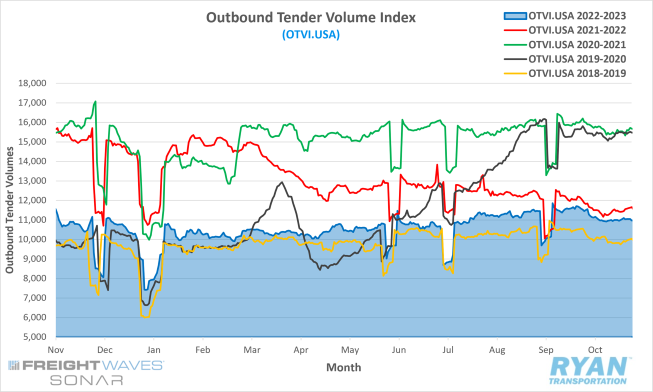
- The FreightWaves SONAR Outbound Tender Volume Index (OTVI), which measures contracted tender volumes across all modes, registered 10,971.54 at the end of the month, 4.2% lower than the 11,457.29 reading at the start.
- The monthly average of daily tender volumes recorded by the OTVI in October fell 1.0% MoM to 11,084.27 from the 11,193.12 recorded in September.
- Compared to the same time last year, October’s daily tender volume average was down 3.6% and sits 10.8% below the 5-year average.
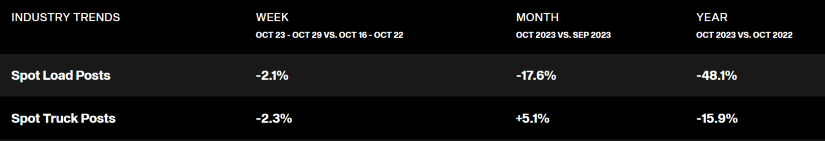
- Contract markets continue to dominate volumes as spot market activity fell by 17.6% MoM in October and is 48.1% below 2022 levels.
- According to the most recent Cass Freight Index report, which analyzes the number of freight shipments in North America and the total dollar value spent on those shipments, both expenditures and shipments registered MoM declines in October of 2.2% and 4.7%, respectively. On an annual basis, expenditures were down 23.3% while shipments were down 9.5%.
Summary
Following a sharp decline of 3.4% in the first week of October, demand levels, as measured by the Outbound Tender Volume Index (OTVI), remained relatively flat for the rest of the month, falling by just 0.8% over the next three weeks. While freight volumes remain subdued compared to previous years, the decline observed in October does not necessarily indicate a further softening of the market. Historically, a decline in demand at the start of Q4 is a well-established seasonal trend, evident even in buoyant freight markets like 2020 and 2021. Pre-pandemic data reveals that the average monthly decline registered by the OTVI in October was approximately 3.7%, with the average declining to 1.5% over the past three years.
The freight shipments that did take place in October continued to favor contract arrangements, as spot market activity exhibited further double-digit declines on a month-over-month basis. While the monthly comparisons in spot market volumes have been less favorable in the second half of the year, year-over-year comparisons have narrowed for both spot and contract market demand. Through the first six months of 2023, the average year-over-year decline in spot market volumes was just under 64%. Since July, that average has narrowed to 46.6%.
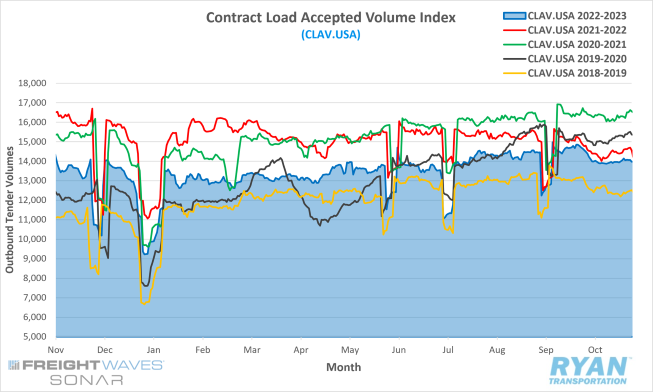
For contracted moves, the year-over-year differences in the OTVI have been significantly less pronounced, declining from an average of 22% below previous year's levels in the first half to just over 7% below 2022. However, annual comparisons in the OTVI can be somewhat skewed, as the index reflects both accepted and rejected tenders and can be inflated by an increase in rejection rates. Examining the Contract Load Accepted Volume Index (CLAV) shown below, which is similar to the OTVI but removes rejected tenders, provides a clearer picture. The average year-over-year difference in the CLAV shifted from just over 13% below 2022 levels in the first six months to 5% over the last four months. The narrowing year-over-year difference in the CLAV suggests that volume levels are starting to recover from their recent lows.
Why It Matters
The truckload market is strongly influenced by a number of wider economic events and impacts further up the supply chain. In the current macroeconomic environment, higher interest rates for manufacturers, current inventory levels at appropriate levels and consumer spending still primarily geared toward services are some of the major headwinds adding negative pressure toward volume growth. Though personal goods consumption spiked from an annualized 0.5% in Q2 to 4.8% in Q3, a vast majority of the uptick was related to durable goods which, as the name suggests, are built to last and be purchased less frequently.
According to Descartes System’s November Global Shipping Report, container import volumes increased 4.7% MoM September to 2,307,918 twenty-foot equivalent units (TEUs) and was 3.9% higher than October 2022 levels. Both September and October import volumes registered well above 2019 levels, however, indicating a likely counter to declines that are expected in the final two months of the year. Evidence of a downturn in imports over the next two months stems from a 37% decline in ocean shipment bookings in the first week of October. Since there is generally a 35- to 40-day lag between when shipments are booked and when they arrive at the ports, the impacts of that sharp decline are likely to be felt in the weeks leading up to Thanksgiving this year.
Truckload Supply
Key Points
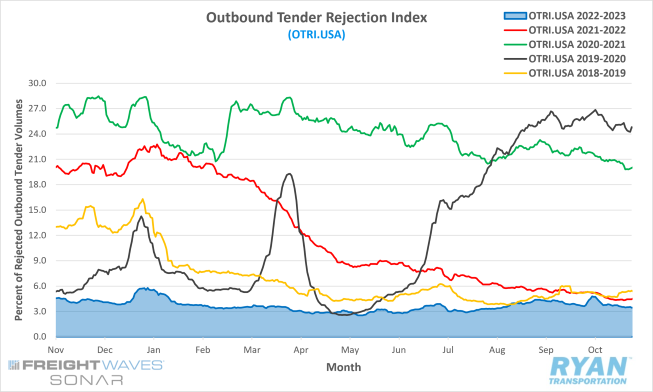
- The FreightWaves SONAR Outbound Tender Rejection Index, a measure of relative capacity based on carriers’ willingness to accept freight volumes under contract reflected as a percentage, registered 3.46% to close out October, 16 basis points (bps) below the 3.62% reading 30 days prior.
- The OTRI recorded its highest reading since January 10 of 4.79% in the first week of October.
- October’s average daily tender rejections registered a 9% decline MoM to 3.99% from September’s reading of 4.08%.
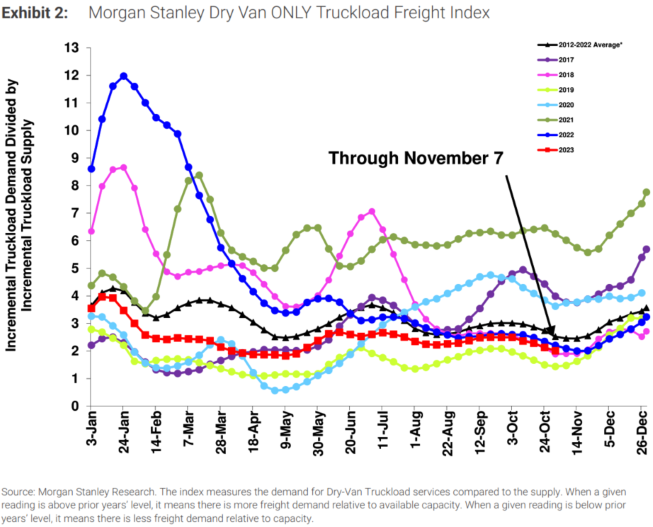
- The Morgan Stanley Truckload Freight Index (MSTLFI) declined throughout October and underperformed seasonality but continues to approach closer to long-term averages.
Summary
In contrast to the overall stability in freight volumes and moderate rate declines, rejection rates exhibited significant volatility in October. After a consistent decline throughout the latter half of September, the Tender Rejection Index surged by 117 bps in the first week of October to reach 4.79%, its highest level since the January 10 reading of 4.88%. Prior to the October spike, the Index's highest level since January was 4.39%, which occurred in the week leading up to Labor Day. Rejection rates remained above the 4% mark into the second week before steadily declining by 1.33% to end the month at 3.46%.
According to the most recent Morgan Stanley report, the MSTLFI, which gauges truckload demand relative to supply, experienced sharp increases for both its supply and demand components in early October. Similar to the OTRI, the increases were short-lived, as the demand component turned negative while supply levels remained somewhat elevated. The Index continues to approach long-term averages but remains below year-over-year levels, suggesting that supply continues to outpace demand.
Why It Matters
The unseasonable spike in rejection rates in the early half of October, despite volumes remaining flat, is a strong signal that capacity levels are beginning to drop. The 4.79% registered by the OTRI in October was 40 bps above the highs recorded by the Index ahead of Labor Day, when excess volumes and drivers taking time off drove up rejection rates. It is also worth noting that Labor Day rejection rates exceeded those recorded around July 4, which is generally the other way around in a normal market. As to the surge in rejection rates during that first week itself, analysts speculate it was likely a combination of factors. One possible explanation stems from disruptions from the UAW strike creating routing guide issues for carriers with heavy exposure to automotive freight. Another potential cause points toward harvest season being in full form from the PNW as well as apple harvests from Michigan and the Northeast.
Further support for the decline in supply has been in the form of headlines announcing more and more large asset carriers are being forced to close their doors or file for bankruptcy due the inoperable conditions. While industry recessions typically hit carriers the hardest, thinning margins have started to expose bottom lines for freight brokerages as well. Most notably, Convoy Inc. closed its doors in October after declining profits and increased cost of capital caused investors to pull funding. Though Convoy was the largest VC-backed domino to fall last month, they were not alone.
The market remains in the late phase of the classic truckload cycle as supply levels slowly continue to contract. As evident so far this year, demand has had little impact for driving positive change to the current conditions. Excess volumes have been easily absorbed by current capacity without much disruption and the overall bleak outlook in the near term implies it will not be the catalyst that returns the market to balance. Though the data from October suggests the process is underway, there is still a significant level of correction that needs to occur on the supply side in order for the market to reach an inflection point.
Truckload Capacity Outlook
Key Points
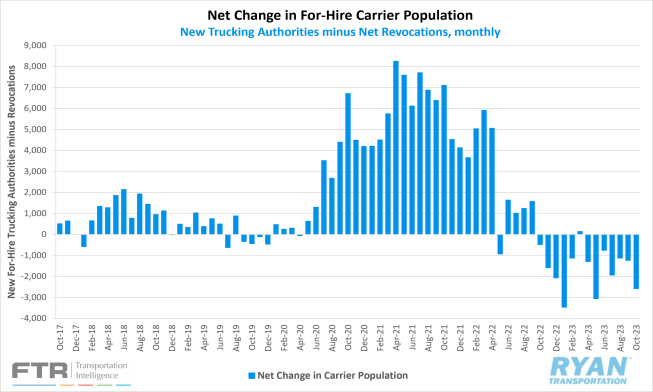
- Total net revocations, which measures total authority revocations minus the number of reinstatements, registered 7,433 carriers in October, a 16.2% increase over September’s figure of 6,398 carriers, per FTR’s preliminary analysis of the Federal Motor Carrier Safety Administration’s (FMCSA) data.
- Per FTR’s report, the number of newly authorized for-hire trucking firms in October was 4,859, a decline of 304 carriers, or 5.9% lower, than September’s reading of 5,163 carriers.
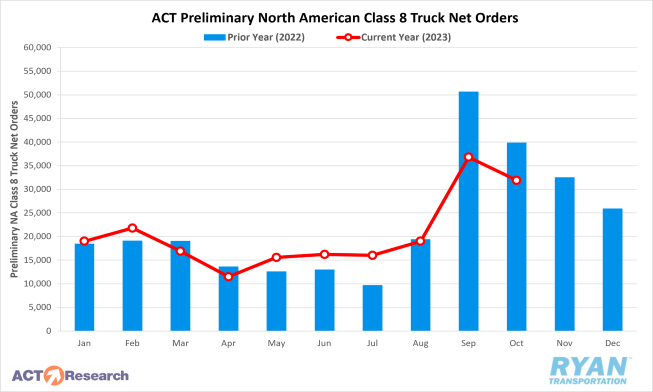
- Depending on the estimate, preliminary North American Class 8 orders ranged from 28,000 per FTR’s reporting and 31,900 based on ACT Research’s analysis.
Summary
The net change in the carrier population contracted by 2,574 carriers in October, more than doubling the decline of 1,235 carriers registered in September. This decline in carrier population was the third largest year-to-date (YTD), trailing only the decreases of 3,464 carriers in January and 3,058 carriers in July. The October decline was primarily driven by a notable surge in revocations, while newly authorized operating authorities recorded their lowest level since June 2020.
FTR and ACT Research both reported month-over-month (MoM) declines in preliminary North American Class 8 truck orders by 10% and 13%, respectively. On an annual basis, comparisons remained weak in October as FTR estimated year-over-year (YoY) declines around 35% and ACT was just shy of 25%. According to ACT's report, adjusting for seasonal factors puts October's count at 25,800 units, which is still the third-best number in the past 12 months. Despite the decline in orders, current backlogs have remained at healthy levels, with backlog orders expected to rise by 3,400 once full data becomes available later in November. Based on those estimates, that should put October's backlog total around 165,000, representing a healthy figure heading into 2024.
Why It Matters
According to FTRs reporting, the data tracked lags significant changes in market changes due to the time it takes for the revocation to finalize and take effect. This indicates that the surge in revocations in October was likely a byproduct of the spike in fuel prices that started in late July. New entrants continue to be propped up by a multitude of factors, per FTRs report. One of the most significant factors is the improvements in capacity management technology and the rise of digital freight platforms over the last few years that have helped lower the barriers to entry. The attempted dissolution of the owner-operator model, such as California’s AB5 law, has played a role in keeping new authorities elevated, despite the deteriorating market, throughout much of the year. Although, with conditions having declined to their current state, that segment of the market is now showing signs of gradually normalizing.
Even as net fleet exits continue at a historical pace, Class 8 equipment orders have seemingly remained fairly robust. Much of this demand has stemmed from larger fleets looking to replace older and high-mileage models that may have been kept in service longer as a result of the pandemic. Meanwhile, smaller fleets are withholding placing orders likely due to uncertainties surrounding the economy in 2024 and current interest rates. According to ACT, while backlogs are increasing as seasonally expected, they are well below the figures experienced over the last two years. This puts an emphasis on seasonal order activity in the months ahead. With the freight demand cycle expected to improve in 2024, lower equipment demand will result in tighter market conditions.
Fuel Prices
Key Points
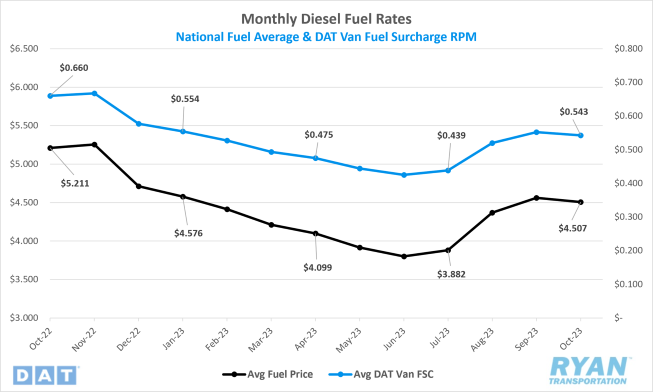
- After three months of consecutive increases, the national average price of fuel fell 1.2% MoM in October to $4.507.
- The monthly average fuel price in October was down 13.5%, or $0.705, compared to the same time last year.
- Builds on crude inventories outpaced draws for the first time since May, with the net change in commercial crude stocks for October increasing 7.8M barrels (bbls) versus the consensus of 6.1M bbls for the weeks ending October 6 and October 27, according to the Energy Information Administration (EIA).
Summary
The late summer rally in fuel prices finally came to an end in October, as the national average price of diesel recorded consecutive week-over-week (WoW) declined for the first time in 15 weeks. Through the first three weeks of the month, fuel prices registered a roughly $0.14 per gallon decline.
Since changes in retail price lag rack and future price swings, impacts from the Hamas invasion of Israel on October 7 were not felt at the pump until two weeks later, when prices spiked $0.10. The uncertainties surrounding the war in the Middle East were not enough to send the global oil market into a frenzy, however, as benchmark prices for retail diesel dropped just over $0.09 in the final week of October.
Builds on U.S. crude inventory posted its strongest month since February as U.S. production recorded all-time highs in October. Inventories surged by 10.2M bbls in the first week as domestic production rose by 300,000 to 13.2M bbls per day. According to Baker Hughes, the active drill rig count dropped to 497 in the first week of October, its lowest level since February 4, 2020, when the active rig count was also 497.
Following the 20-month low, October saw an additional seven drill rigs come back online, bringing the count up to 504 to close out the month.
Why It Matters
The outbreak of war traditionally causes significant shifts in the global oil market as fears of supply constraints artificially inflate demand levels, ushering in price surges across the board. A war in the Middle East would likely elicit a visceral reaction given its connection to the global oil trade, however, opposing forces have made the impacts far less damning.
Unlike the Russia-Ukraine war, where Russia at the time accounted for roughly 11% of global oil exports, the Israel-Hamas war currently has no immediate impact on supply. The scenarios that pose any potential considerable market disruption involves an attack on Iran or shut down of the Strait of Hormuz, the major passage of oil used by several Middle Eastern countries. These doomsday scenarios have been feared for over 50 years but have yet to happen.
Inflationary pressures and recessionary fears remain fixtures for declining demand levels keeping barrel prices under $100. Furthermore, supply side constraints from OPEC+ nations have been muddied recently by Iranian oil production, which has risen up to nearly 600,000 bbls per day over the past year. The current administration will likely be under pressure to further sanction supplies from Iran given its relationship to the Hamas terrorist organization.
Meanwhile, on the domestic side, draws on crude inventories were stymied by the peak autumn refinery season, opening the door for a significant build in October. While commercial crude stocks saw positive gains in October, record production paired with lower exports and refinery maintenance season did not have the same impact on the U.S. Strategic Petroleum Reserve (SPR). Current SPR levels remain near 40-year lows, which could pose problematic for helping to control any significant swings in oil prices by the administration in the near future.
Dry Van Overview
Dry Van Spot Rates
Key Points
- Dry van spot rates excl. fuel were virtually flat in October, declining only slightly by 0.1%, or $0.002, MoM to $1.551.
- Compared to 2022, dry van linehaul rates were down 12.1% and sit 19.5% below the 5-year average.
- Dry van contract rates excl. fuel increased 0.7%, or $0.014, MoM in October but remain 14.5% below 2022 levels.
Dry Van Load-to-Truck Ratio
Key Points
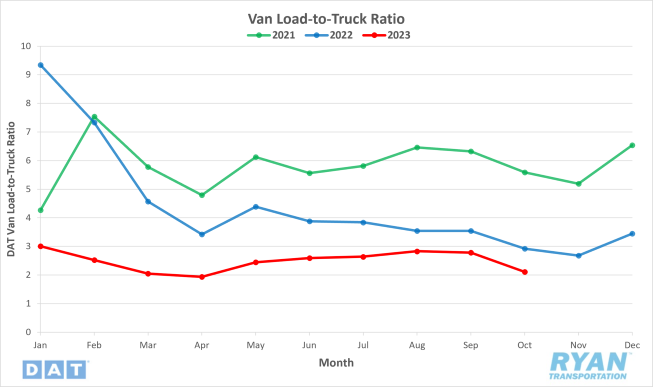
- The dry van load-to-truck ratio declined sharply in October, falling 24.1% MoM to 2.11 from 2.78 in September and sits 27.7% below the same time last year.
Dry Van Market Conditions
Dry Van Summary
Dry van volumes are at the lowest point since July 2020 and declined further the week ending October 13. Van LTR decreased in the first three weeks of the month from 2.17 to 2.00 but saw a decent increase for the remainder of the month to end at 2.37. The increase could be linked to Halloween, as the National Retail Federation (NRF) states the total spending on the holiday is expected to reach a record $12.2 billion. “More Americans than ever will be reaching into their wallets and spending a record amount of money to celebrate Halloween this year,” NRF President and CEO Matthew Shay said. “Consumers have been shopping early for festive décor and other related items, and retailers had the inventory to help customers and their families participate in this popular, fun tradition.” The overall decrease in dry van LTR could have been affected by the auto workers’ strike, but it’s too early to determine if this is the case or just an artifact of a very soft freight market. The Institute of Supply Management (ISM) Purchasing Managers Index (PMI) increased MoM in September, with a reading of 49%. This generally indicates an expansion of the overall economy, but economic activity in the manufacturing sector contracted for the eleventh consecutive month. Of the 16 industries that make up the PMI, five reported growths in September while the remaining 11 reported contraction. The Logistics Managers Index (LMI) for October came in at 56.5, up 4.1 from September. This is the third consecutive month of expansion after three consecutive months of contraction. This second consecutive month of expansion provides some evidence of a possible new freight trend. Whether increased inventories are temporary seasonal expansion or the sign of a larger move towards stronger economic growth remains to be seen.
The hope of a freight market recovery in 2023 is fading, with the forecast scenario of improvement in Q2 2024 in doubt. According to Prof. Jason Miller of Michigan State University, with the release of the latest Trucking Ton-Mile Index (TTMI), “We are a long way off from the increase in freight volumes that we will need to get ourselves out of this current freight recession. We will exit the recession in a much slower, more progressive manner than the past two cycles. Assuming the Federal Open Market Committee (FOMC) keeps interest rates elevated for longer, we may be looking at a soft demand environment for at least nine months and it looks increasingly unlikely that [there will be a] Q2 2024 recovery in freight volumes.” The weeks leading up to Thanksgiving will be key in assessing the freight economy’s strength, as van rates usually rise during this time. With peak retail season upon us, experts expect it to be mild this year, but it should not be taken lightly. Outbound tender volumes based on length of haul are strong indicators of what is happening in each market. The main source of volumes in the market are long-haul loads (800+ miles) and mid-haul loads (451 – 800 miles). Each metric is starting to decrease in volume, which is surprising, given that peak season typically sees these lanes rise. The mid-hauls will continue to be the leading indicator of what is happening in the market.
Reefer Overview
Reefer Spot Rates
Key Points
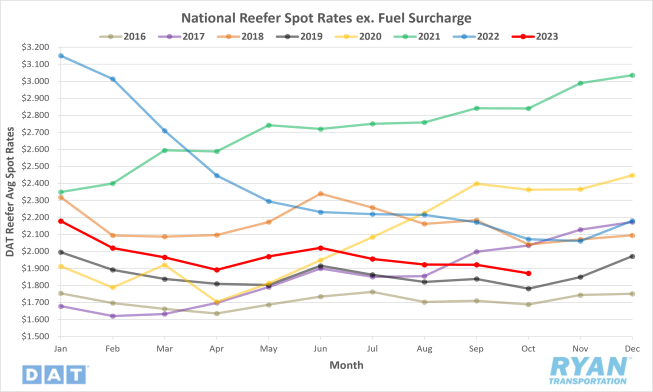
- The national average reefer spot rate excl. fuel declined for the fourth consecutive month, falling 2.6% MoM, or $0.050, in October to $1.872.
- Reefer linehaul rates in October were 9.6% lower than October 2022 levels and registered 15.7% lower than the 5-year average.
- Reefer contract rates exclusive of fuel dropped moderately in October, falling 0.4% MoM from September and sit 10.2% below the same time last year.
Reefer Load-to-Truck Ratio
Key Points
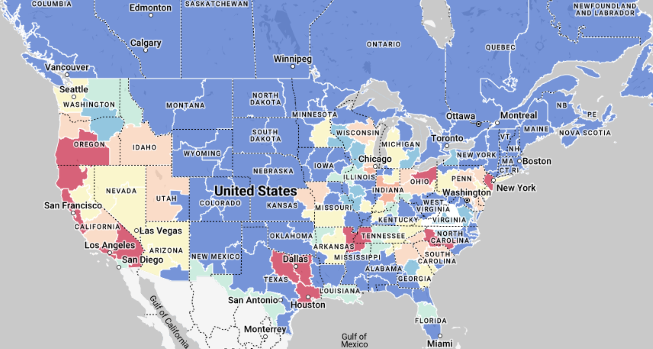
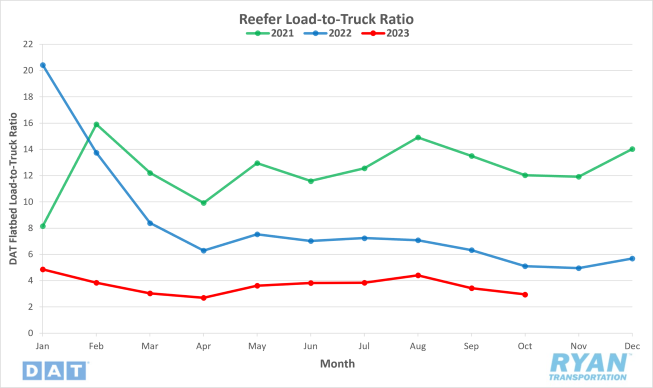
- The reefer load-to-truck ratio in October dropped 14% MoM in October to 2.95 from 3.43 and is 42.3% below 2022 levels.
Reefer Market Conditions
Reefer Summary
Refrigerated freight continues to have a rough go of it in October. WoW declines in the 7-day average linehaul were regular in the first two weeks, with rates decreased $0.08 before a $0.02 increase in the third week. However, rates closed out the month with an additional $0.03 decrease. With Thanksgiving right around the corner, and Christmas soon to follow, one would expect reefer rates and volumes to be on the rise to close out the year.
Sweet potato harvest season is in full swing just in time for Thanksgiving in North Carolina, the leading producer in the U.S., accounting for 76% of annual tonnage. This could cause a tightening in capacity, and for the past eight weeks the USDA has reported shortages of trucks in Delaware, Maryland and eastern Virginia; one of only 20 produce-growing regions tracked weekly to report a shortage of reefer equipment. Due to the eight-week delay for the curing and storage of sweet potatoes that is crucial in the “sweetening” process, peak shipping seasonality of the holiday staple should land right around Thanksgiving. According to the USDA, increased competition from South African and Egyptian growers contributed to North Carolina’s sweet potato acreage dropping from 105,000 acres in 2021 to 84,000 in 2022. Jeff Thomas, market director for Lucama, NC-based Scott Farms, said, “Everything from packaging and fuel to fertilizer has gone up. Meanwhile, sweet potato prices have stagnated, prompting some growers to transition to more lucrative crops like tobacco, soybeans, peanuts, cotton or corn.”
Halloween and Thanksgiving also signal harvest time for pumpkins, driving up demand for reefer carriers. This year’s commercial Midwest region pumpkin crop was in doubt, though, over the summer following 50 days in May and June with no rain. According to the USDA, Illinois is the top-producing pumpkin state in the U.S., producing 40% of the nation’s pumpkins. In 2021, the top six pumpkin producing states harvested more than 1 billion pounds (23,000 equivalent truckloads) of pumpkins combined. Illinois produced 652 million pounds (15,000 equivalent truckloads); more than the other five most productive states combined. Morton, IL is unofficially the “Pumpkin Capital of the World,” and a major contributor to that reputation is the Nestle Libby’s plant, which produces 85% of the world’s canned pumpkin.
Minnesota, on the other hand, is the number one state for turkey production. It shouldn’t come as a surprise that the Minneapolis market will be the land of 10,000 loads this Thanksgiving, as fresh turkeys are trucked from the area. USDA data shows Minnesota, North Carolina, Arkansas, Indiana and Missouri produce roughly 135 million live turkeys or 96,000 reefer truckloads. While 10% of that production is exported, just over 80% of those exports will cross the border into Mexico.
Flatbed Overview
Flatbed Spot Rates
Key Points
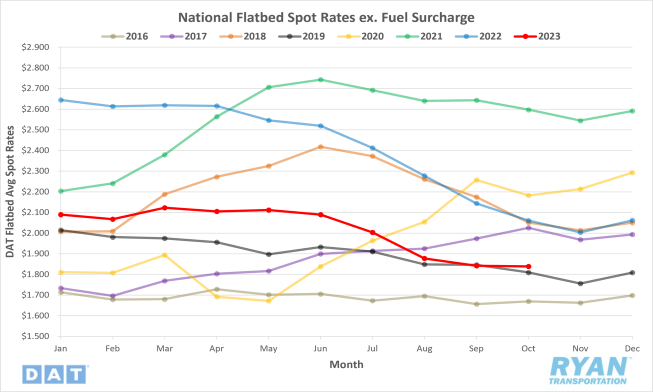
- Average flatbed spot rates excl. fuel remained virtually flat in October, falling just $0.004 MoM, or 0.2%, in October to $1.839.
- Flatbed linehaul rates in October were 10.8% below the same time last year and sit 14.1% below the 5-year average.
- Flatbed contract rates excl. fuel increased slightly MoM, up $0.025, or 0.8%, in October to $2.514 and remain 9.8% below October of last year.
Flatbed Load-to-Truck Ratio
Key Points
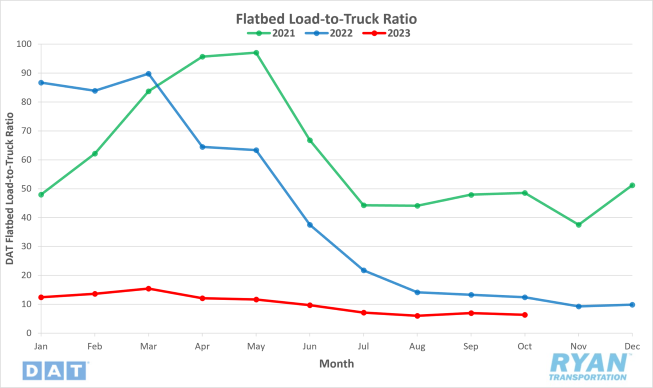
- The flatbed load-to-truck ratio declined further in October, dropping 8.4% MoM to 6.36 from September’s reading of 6.94 and are down 48.9% YoY.
Flatbed Market Conditions
Flatbed Summary
The flatbed sector registered further deterioration in October. The 7-day average spot rates decreased $0.04 in the first week, remained flat and then dropped $0.01 to finish out the month. The six weeks of gains reported last month in flatbed LTR were wiped out in October as LTR decreased drastically to start the month dropping from 8.08 to 6.6. LTR then steadily decreased to end the month at 6.11.
Construction spending reveals how much the government and private companies spend on projects and is a key indicator of flatbed volumes. According to the Commerce Department, spending on construction projects increased 0.5% in August to $1.98 trillion. Over the past year, construction spending has been up 7.4%. Private residential construction increased by 0.6% to $879 billion in August compared to the prior month. Public construction spending was $431.6 billion, up 0.6% from July and 14.1% compared to the same time in 2022. Public, non-residential construction comprised 98% of the month total and was 14.4% higher than last year. Flatbed capacity tightened in the second week of October in Gary, IN, the nation’s largest flatbed market for steel production.
Some good news for flatbed carriers is that manufacturing accounts for 60% of truckload demand. Data published by the U.S. Census Bureau reported that new orders for manufactured goods increased $6.7 billion in August. Other positive news from October is that new, single-family homebuilding rebounded in September. According to the U.S. Census Bureau, single-family home starts increased 3.2% to a seasonally adjusted rate of 963,000 units last month. On the contrary, single-family building permits declined 1.8% MoM, muting the surprising September result. The densely populated South has the highest volume of single-family starts at 593,000, up 2.8% MoM and 16% YoY. The volume of starts plunged 19% MoM in the smaller Northeast region.
Activity in the oil and gas industry gained momentum in October as the active drill rig count increased and production surged. Despite the gains, it was not enough to translate to increased flatbed conditions. Energy firms added two oil and natural gas rigs for a second week in a row in early October, according to Baker Hughes Rig Count. The count on October 20 rose to 504 but remained 19% below YoY levels, according to Baker Hughes. The Houston-to-Lubbock lane, servicing the Permian Basin, had the lowest flatbed rates of the year, paying carriers $2.24/mile. The Houston-to-Lubbock lane is the highest volume flatbed lane nationwide. Consistent with the lower annual rig count, volumes in this lane have fallen 21% over the last 12 months while spot rates are down 24% in the same timeframe.
Intermodal
Intermodal Spot Rates
Key Points
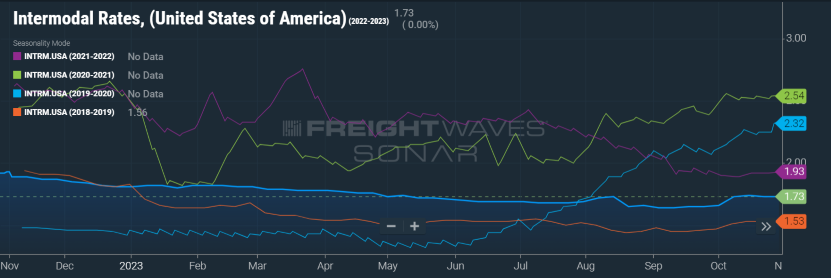
- The FreightWaves SONAR Intermodal Rates Index (INTRM.USA), which measures the average weekly all-in, door-to-door intermodal spot rate for 53’ dry vans across a majority of origin-destination pairings, registered a 4.8%, or $0.08, MoM increase in October.
- According to the Index, intermodal rates are down 10.4% compared to last year and remain 13.9% below the 5-year average.
Intermodal Volumes
Key Points
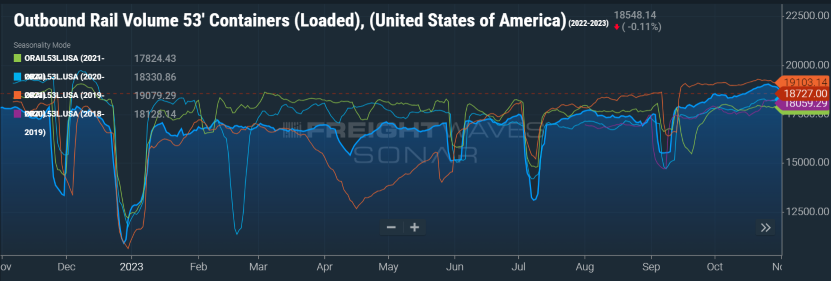
- Total loaded volumes for 53’ containers from all domestic markets, measured by the FreightWaves SONAR Loaded Outbound Rail Volume Index (ORAIL53.USA), increased 2.1% MoM in October.
- Compared to 2022 levels, volumes were up 5.6% YoY and sit 1.6% above the 5-year average.
Intermodal Summary
The intermodal sector registered mixed results amid its traditional peak season, as volumes registered growth concurrent with expectations for this time of year while rates remained muted. As rail carriers have maintained focus on improving service levels over the past year, volume levels have increased sequentially on a quarterly basis. Volumes reached an inflection point in September, turning positive YoY and continued that trend in October. The uptick in volumes over the year has been a pleasant surprise given the grim outlook heading into the final quarter and next year. Although the data has continued to trend positive, volumes have been trending closely with 2022 levels, which could translate to rapidly decelerating volumes over the next few weeks leading up to Thanksgiving. Current projections have volumes turning negative through the rest of the quarter and remaining flat for 2024, with growth returning in 2025.
The competitive dynamics with the truckload market have continued to diminish the return of growth in rates. The improved service levels and resiliency in consumer demand, as seen in the latest GDP figure, should continue driving market share back to the intermodal sector, allowing carriers to apply positive pressure on rates. Until then, carriers will have to continue slow hiring activity and likely reduce headcounts to maintain operating margins. Contract savings via the rail according to the FreightWaves SONAR Intermodal Contract Savings Index (IMCSI1.USA), which measures the percentage difference between initial reporting of intermodal contract rates and dry van contract rates in the same lane, measured 9.66% at the end of October. This 22-bps decline from the end of the previous month was expected, though, given the surge of volumes causing spot rates to rise over the month.
Further Reading
- U.S. rail carload and intermodal volumes are mixed in October, reports AAR – Logistics Management
- Class 8 Order Season Continues Below Year-Ago Surge – Transport Topics
- What downturn? US imports still rising, highest since boom – FreightWaves: American Shipper
- NRF’s Shay assesses holiday import and inventory trends heading into the holiday season – Logistics Management